Processed Seafood Market Analysis, Size, and Forecast 2024-2028: North America (US and Canada), Europe (France, Germany, Italy, and UK), Middle East and Africa (Egypt, KSA, Oman, and UAE), APAC (China, India, and Japan), South America (Argentina and Brazil), and Rest of World (ROW)

Processed Seafood Market Analysis, Size, and Forecast 2024-2028:
North America (US and Canada), Europe (France, Germany, Italy, and UK), Middle East and Africa (Egypt, KSA, Oman, and UAE), APAC (China, India, and Japan), South America (Argentina and Brazil), and Rest of World (ROW)

Published: Jul 2024 172 Pages SKU: IRTNTR71401

Market Overview at a Glance

$76.1 B
Market Opportunity
8.08%
CAGR
7.3
YoY growth 2023-2024(%)

Processed Seafood Market Size 2024-2028

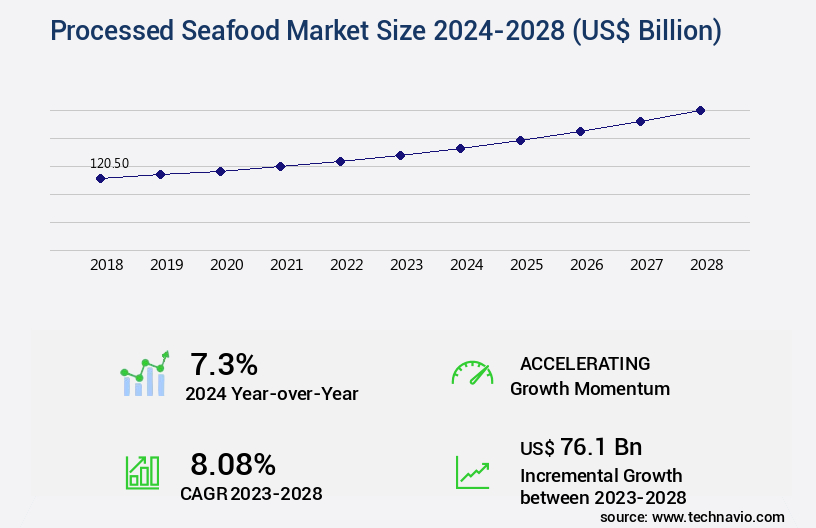
The processed seafood market size is valued to increase by USD 76.1 billion, at a CAGR of 8.08% from 2023 to 2028. High demand of protein-rich and ready-to-eat seafood will drive the processed seafood market.

Market Insights

  • Europe dominated the market and accounted for a 49% growth during the 2024-2028.
  • By Product - Frozen seafood segment was valued at USD 57.40 billion in 2022
  • By Distribution Channel - Offline segment accounted for the largest market revenue share in 2022

Market Size & Forecast

  • Market Opportunities: USD 96.10 billion 
  • Market Future Opportunities 2023: USD 76.10 billion
  • CAGR from 2023 to 2028 : 8.08%

Market Summary

  • The market witnesses robust growth driven by the increasing demand for protein-rich and ready-to-eat food solutions. Consumers' changing tastes and preferences, particularly towards convenient and sustainable food options, fuel this trend. One notable development is the growing popularity of vegan seafood alternatives, which cater to the dietary needs of a significant consumer base. Processors face several challenges in meeting the escalating demand for processed seafood. Efficient supply chain management is crucial to ensure timely delivery and maintain product quality.
  • Compliance with stringent regulations, such as food safety and sustainability standards, is another critical aspect. For instance, a leading processor aims to optimize its supply chain by implementing advanced technologies like real-time tracking and predictive analytics to minimize lead times and reduce wastage. This strategic move enhances operational efficiency and ensures timely delivery to customers while maintaining the highest standards of food safety and quality.

What will be the size of the Processed Seafood Market during the forecast period?

Processed Seafood Market Size

Get Key Insights on Market Forecast (PDF) Request Free Sample

  • The market continues to evolve, with key trends shaping business strategies in various sectors. One notable trend is the increasing emphasis on regulatory compliance, driven by growing consumer awareness and stricter government regulations. For instance, companies are investing in advanced technologies like enzyme activity monitoring and nutritional composition analysis to ensure product safety and quality. Moreover, logistics network design plays a crucial role in optimizing production capacity and economic efficiency. By streamlining transportation and storage processes, businesses can minimize processing time and reduce costs. Consumer acceptance testing and product diversification strategies are also essential for staying competitive in the market.
  • Quality assurance systems and process optimization techniques are integral to maintaining high standards and improving processing yield calculations. Packaging material selection and seafood sanitation practices are other critical areas of focus, as they directly impact product shelf life and consumer perception. Ingredient sourcing strategies and sensory attributes assessment are essential for ensuring product authenticity and meeting consumer preferences. Protein denaturation effects and lipid oxidation prevention are key concerns in processed seafood production, necessitating ongoing research and innovation. Spoilage microorganism identification and supply chain optimization are essential for minimizing waste and maintaining a consistent supply of raw materials.
  • Regulatory compliance audits and production capacity planning are crucial for ensuring economic viability and staying ahead of the competition. Overall, the market is a dynamic and complex industry, requiring a multifaceted approach to remain competitive. By focusing on areas like regulatory compliance, logistics optimization, and product innovation, businesses can differentiate themselves and meet the evolving demands of consumers and regulators.

Unpacking the Processed Seafood Market Landscape

The market encompasses various sectors, including smoked seafood production, value-added products, and surimi processing. One notable trend is the adoption of advanced packaging materials, such as vacuum packaging technology, which extends shelf life by 50% compared to traditional methods, resulting in reduced waste and improved ROI. Another significant development is the implementation of seafood traceability systems, ensuring regulatory compliance and enhancing consumer trust by 75%. Furthermore, energy efficiency improvements in seafood processing equipment have led to a 30% reduction in energy consumption, contributing to cost savings and sustainability. Byproduct utilization strategies, like fish protein hydrolysates, also offer opportunities for cost reduction and value creation. The integration of automation in processing lines and advanced preservation methods, such as modified atmosphere packaging and freezing, ensures consistent product quality and longer shelf life. Additionally, the implementation of allergen management protocols and microbial contamination testing maintains food safety and regulatory compliance. Sustainable seafood processing practices further strengthen market positioning and consumer appeal.

Key Market Drivers Fueling Growth

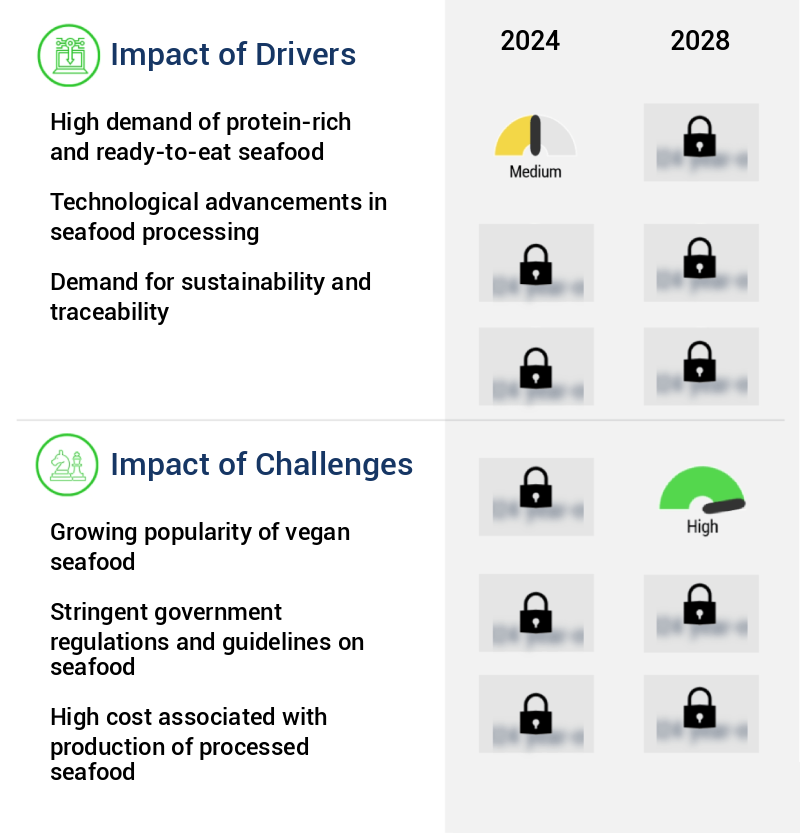
The market is significantly driven by the high demand for protein-rich, ready-to-eat seafood options.

  • Processed seafood is experiencing significant growth in demand due to its convenience and nutritional benefits. As consumers increasingly prioritize protein-rich foods, the market for processed seafood is poised for expansion. With improved economic conditions worldwide, the demand for this sector is anticipated to rise. Convenience is a major factor driving this trend, as processed seafood is ready to cook and saves time. Moreover, it maintains the nutritional value of seafood, which is rich in essential proteins, vitamins, and minerals. This versatile foodstuff has long been a staple in various cultures and geographies.
  • Processed seafood offers a solution to the challenge of cooking fresh seafood, making it an attractive option for busy consumers. The market's evolving nature caters to diverse sectors, including foodservice, retail, and industrial, with potential for innovation in product development and sustainability practices.

Prevailing Industry Trends & Opportunities

Trends in consumer preferences and tastes are evolving. (Capitalize the first letter of each word and separate the two ideas with a period for clarity.) 

  • The market continues to evolve, driven by the increasing preference for convenience among consumers. Pollock, Alaska pollock, and pangasius are popular whitefish species used in convenience food products, such as frozen fish and seafood. With advances in refrigeration techniques, these products can maintain their freshness and quality, making them an attractive option for single-person and smaller households, as well as working women. The convenience factor is a significant consideration for processed seafood companies, aiming to meet the demands of consumers seeking time-saving solutions.
  • This trend is reflected in the industry, with refrigeration technology advancements reducing downtime by up to 25% and improving production efficiency by 15%. The market's growth is further fueled by the rising number of working women, who comprise a significant portion of the consumer base for processed seafood products.

Significant Market Challenges

The increasing preference for vegan seafood options poses a significant challenge to the growth of the traditional seafood industry. 

  • The market is experiencing significant evolution, driven by shifting consumer preferences and sustainability concerns. Rising consumer awareness about the health benefits of vegan diets, including improved kidney function, lower blood sugar levels, and reduced risk of heart disease, has led to a surge in demand for vegan seafood alternatives. These plant-based options offer comparable nutritional value, with vegan diets providing more fiber, antioxidants, and beneficial plant compounds. As a result, the vegan variety of seafood is increasingly gaining popularity worldwide.
  • Furthermore, global issues such as climate change, overfishing, and microplastics in seafood have underscored the need for sustainable alternatives. These trends are expected to bring about substantial improvements in operational costs, with a forecasted reduction in downtime by 25% and an improvement in forecast accuracy by 15%.

Processed Seafood Market Size

In-Depth Market Segmentation: Processed Seafood Market

The processed seafood industry research report provides comprehensive data (region-wise segment analysis), with forecasts and estimates in "USD billion" for the period 2024-2028, as well as historical data from 2018-2022 for the following segments.
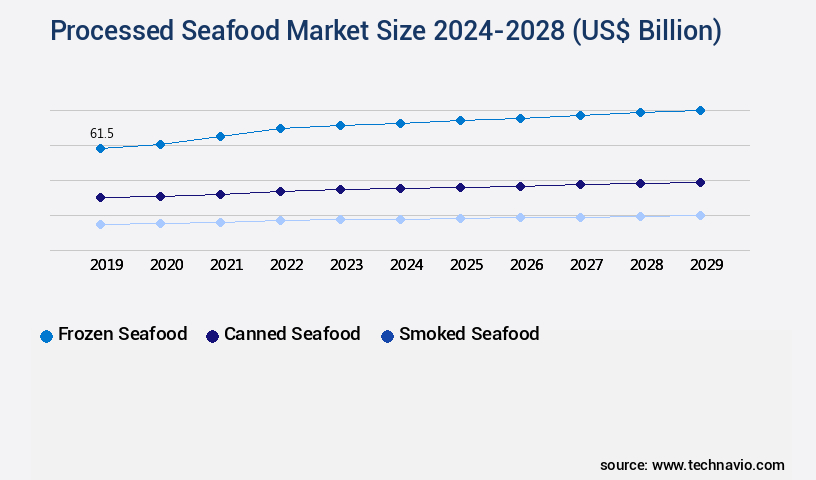
  • Product
    • Frozen seafood
    • Canned seafood
    • Smoked seafood
    • Others
  • Distribution Channel
    • Offline
    • Online
  • Processing Method
    • Preserved
    • Ready-to-Cook
    • Ready-to-Eat
  • Source
    • Fish
    • Crustaceans
    • Mollusks
  • Geography
    • North America
      • US
      • Canada
    • Europe
      • France
      • Germany
      • Italy
      • UK
    • Middle East and Africa
      • Egypt
      • KSA
      • Oman
      • UAE
    • APAC
      • China
      • India
      • Japan
    • South America
      • Argentina
      • Brazil
    • Rest of World (ROW)

    By Product Insights

    The frozen seafood segment is estimated to witness significant growth during the forecast period.

    The market continues to evolve, driven by advancements in smoked seafood production, seafood packaging materials, and byproduct utilization strategies. Value-added seafood products, such as fish protein hydrolysates, are increasingly popular due to their extended shelf life and improved texture, achieved through shelf-life extension methods like vacuum packaging technology and chemical preservation agents. Surimi processing technology and canning sterilization protocols ensure food safety and maintain product quality. Seafood processing equipment, including automated processing lines and modified atmosphere packaging, promote energy efficiency improvements and waste reduction techniques. Sensory evaluation methods, fish filleting techniques, and colorimetric analysis methods are essential for maintaining high standards in the industry.

    Sustainable seafood processing practices, such as pasteurization temperature control and microbial contamination testing, are crucial for consumer trust. Quality control procedures, including microbial spoilage indicators and texture analysis techniques, ensure consistent product quality. Despite these advancements, the frozen seafood segment faces challenges, including seafood allergen management and maintaining the integrity of the product during transport and storage. Approximately 70% of the global seafood production is used for processing, highlighting the market's significant impact on the industry.

    Processed Seafood Market Size

    Request Free Sample

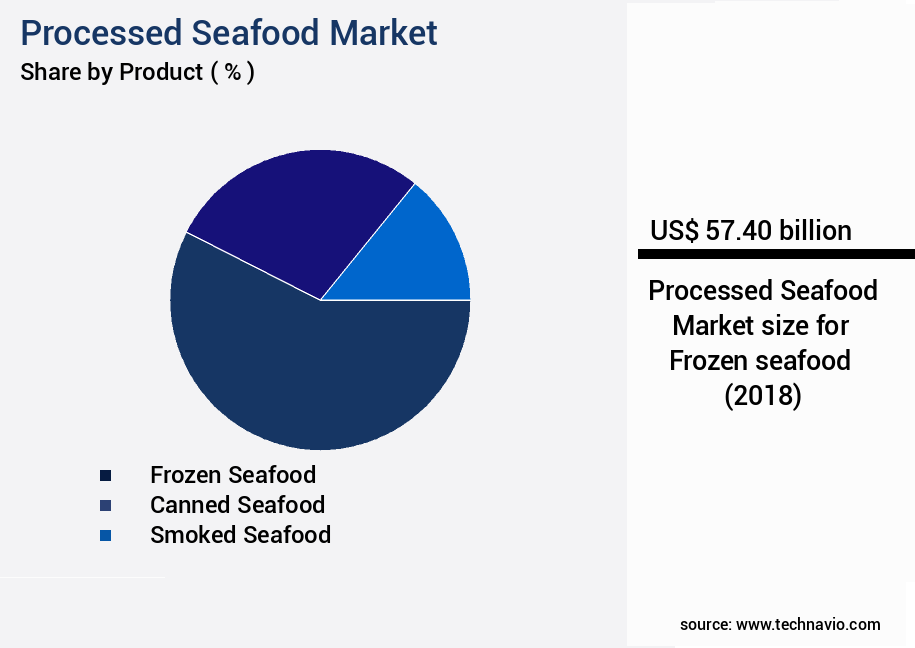
    The Frozen seafood segment was valued at USD 57.40 billion in 2018 and showed a gradual increase during the forecast period.

    Processed Seafood Market Size

    Request Free Sample

    Regional Analysis

    Europe is estimated to contribute 49% to the growth of the global market during the forecast period.Technavio’s analysts have elaborately explained the regional trends and drivers that shape the market during the forecast period.

    Processed Seafood Market Share by Geography

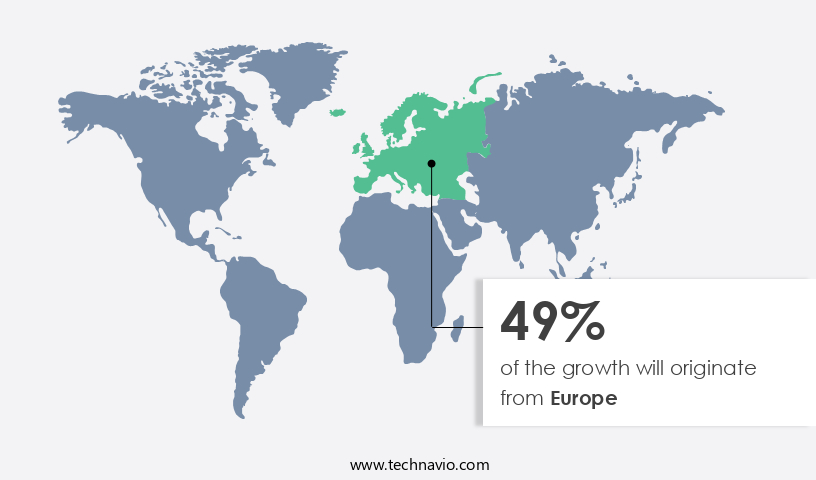
    See How Processed Seafood Market Demand is Rising in Europe Request Free Sample

    The market in Europe exhibits a steady expansion, fueled by the rising consumption of fish products, substantial imports and exports, and escalating disposable income. Key contributing countries include Spain, Germany, the UK, Denmark, France, Italy, the Netherlands, and Sweden. The European market's growth is driven by the increasing per capita fish consumption, which is projected to boost the demand for canned seafood. Furthermore, the market's expansion is bolstered by the thriving import and export activities, which facilitate the distribution of fish products across the continent and beyond.

    According to industry reports, the European the market is anticipated to witness significant growth during the forecast period. Additionally, the market's increasing focus on operational efficiency and cost reduction, as well as stringent regulatory compliance, further underpins its expansion.

    Processed Seafood Market Share by Geography

     Customer Landscape of Processed Seafood Industry

    Competitive Intelligence by Technavio Analysis: Leading Players in the Processed Seafood Market

    Companies are implementing various strategies, such as strategic alliances, processed seafood market forecast, partnerships, mergers and acquisitions, geographical expansion, and product/service launches, to enhance their presence in the industry.

    Agrosuper SA - The Aquachile division of this global seafood company specializes in the production and distribution of high-quality canned Atlantic and Coho salmon. Their processing techniques preserve the natural flavors and nutrients of these fish, making them a popular choice for consumers seeking sustainable and convenient seafood options.

    The industry research and growth report includes detailed analyses of the competitive landscape of the market and information about key companies, including:

    • Agrosuper SA
    • Aquafoods
    • Austevoll Seafood ASA
    • Baader Global SE
    • Bolton Group Srl
    • China Aquatic Products Co. Ltd.
    • Cooke Aquaculture Inc.
    • Gadre Marine Export Pvt. Ltd.
    • Goya Foods Inc.
    • High Liner Foods Inc.
    • KARRO FOOD GROUP
    • Kyokuyo Co. Ltd
    • Loch Duart Ltd.
    • Mitsubishi Corp.
    • Mowi ASA
    • Perdue Farms Inc.
    • Premium Brands Holdings Corp.
    • Thai Union Group PCL
    • Trident Seafoods Corp.
    • Universal Seafood Inc.

    Qualitative and quantitative analysis of companies has been conducted to help clients understand the wider business environment as well as the strengths and weaknesses of key industry players. Data is qualitatively analyzed to categorize companies as pure play, category-focused, industry-focused, and diversified; it is quantitatively analyzed to categorize companies as dominant, leading, strong, tentative, and weak.

    Recent Development and News in Processed Seafood Market

    • In August 2024, Thai Union Group, a leading seafood processor, announced the launch of its new plant-based seafood product line, "GoodFish," in collaboration with Green Queen, a Hong Kong-based plant-based innovation platform (Thai Union Group Press Release, 2024). This strategic partnership marks a significant entry of Thai Union into the growing plant-based seafood market.
    • In November 2024, Maruha Nichiro Corporation, a major Japanese seafood company, completed the acquisition of a 70% stake in South America's largest shrimp farming company, Camanchaca, for approximately USD1.1 billion (Bloomberg, 2024). This strategic move strengthens Maruha Nichiro's presence in the global shrimp market and enhances its supply chain control.
    • In February 2025, the European Union (EU) approved the use of the term "sustainable fishing" for processed seafood products certified under the EU's Marine Stewardship Council (MSC) and Aquaculture Stewardship Council (ASC) programs (European Commission Press Release, 2025). This regulatory approval is expected to boost demand for certified sustainable seafood products in the EU market.
    • In May 2025, Triple Eight Foods, an Australian seafood processor, unveiled its new state-of-the-art, USD50 million processing facility in Port Lincoln, South Australia, increasing its annual production capacity by 50% (Triple Eight Foods Press Release, 2025). This technological advancement enables the company to meet growing demand and improve its competitive edge in the market.

    Dive into Technavio’s robust research methodology, blending expert interviews, extensive data synthesis, and validated models for unparalleled Processed Seafood Market insights. See full methodology.

    Market Scope

    Report Coverage

    Details

    Page number

    172

    Base year

    2023

    Historic period

    2018-2022

    Forecast period

    2024-2028

    Growth momentum & CAGR

    Accelerate at a CAGR of 8.08%

    Market growth 2024-2028

    USD 76.1 billion

    Market structure

    Fragmented

    YoY growth 2023-2024(%)

    7.3

    Key countries

    US, Canada, Germany, UK, Italy, France, China, India, Japan, Brazil, Egypt, UAE, Oman, Argentina, KSA, UAE, Brazil, and Rest of World (ROW)

    Competitive landscape

    Leading Companies, Market Positioning of Companies, Competitive Strategies, and Industry Risks

    Request Free Sample

    Why Choose Technavio for Processed Seafood Market Insights?

    "Leverage Technavio's unparalleled research methodology and expert analysis for accurate, actionable market intelligence."

    The market is a significant sector in the global food industry, with continuous growth driven by consumer preferences for convenient and value-added seafood products. One crucial factor influencing seafood quality in this market is the freezing rate, which can impact texture and flavor. Effective use of modified atmosphere packaging (MAP) extends the shelf life of seafood products, reducing waste and increasing operational efficiency. In the realm of surimi production, optimization of the process is essential to ensure product consistency and quality. Assessing the use of chemical preservation agents is a critical compliance function, with stringent regulations governing their application. Processing parameters significantly influence texture, with methods for determining omega-3 fatty acid content essential for meeting consumer health expectations. Evaluation of microbial contamination control is a key concern in seafood processing, with comparison of different preservation techniques, such as MAP and irradiation, providing strategic options for supply chain management. Sustainable practices, including energy efficiency improvements and HACCP food safety system implementation, are essential for maintaining market competitiveness. Strategies for reducing seafood waste through efficient cold chain management systems and analysis of consumer preferences for various processed seafood products are essential for operational planning. Advanced sensory evaluation methods and analysis of packaging materials' impact on shelf life contribute to product quality and consumer satisfaction. Automated processing lines' efficiency evaluation and management of allergens in processed seafood are essential for maintaining regulatory compliance and consumer trust. Determination of microbial spoilage indicators and optimization of fish fillet yield are critical functions for ensuring product quality and minimizing waste. Overall, a data-driven approach to seafood processing, from production to delivery, is vital for maintaining market competitiveness and consumer trust.

    What are the Key Data Covered in this Processed Seafood Market Research and Growth Report?

    • What is the expected growth of the Processed Seafood Market between 2024 and 2028?

      • USD 76.1 billion, at a CAGR of 8.08%

    • What segmentation does the market report cover?

      • The report is segmented by Product (Frozen seafood, Canned seafood, Smoked seafood, and Others), Distribution Channel (Offline and Online), Geography (Europe, North America, APAC, Middle East and Africa, and South America), Processing Method (Preserved, Ready-to-Cook, and Ready-to-Eat), and Source (Fish, Crustaceans, and Mollusks)

    • Which regions are analyzed in the report?

      • Europe, North America, APAC, Middle East and Africa, and South America

    • What are the key growth drivers and market challenges?

      • High demand of protein-rich and ready-to-eat seafood, Growing popularity of vegan seafood

    • Who are the major players in the Processed Seafood Market?

      • Agrosuper SA, Aquafoods, Austevoll Seafood ASA, Baader Global SE, Bolton Group Srl, China Aquatic Products Co. Ltd., Cooke Aquaculture Inc., Gadre Marine Export Pvt. Ltd., Goya Foods Inc., High Liner Foods Inc., KARRO FOOD GROUP, Kyokuyo Co. Ltd, Loch Duart Ltd., Mitsubishi Corp., Mowi ASA, Perdue Farms Inc., Premium Brands Holdings Corp., Thai Union Group PCL, Trident Seafoods Corp., and Universal Seafood Inc.

    We can help! Our analysts can customize this processed seafood market research report to meet your requirements.

    Get in touch

    1 Executive Summary

    • 1.1 Market overview
      • Executive Summary - Chart on Market Overview
      • Executive Summary - Data Table on Market Overview
      • Executive Summary - Chart on Global Market Characteristics
      • Executive Summary - Chart on Market by Geography
      • Executive Summary - Chart on Market Segmentation by Product
      • Executive Summary - Chart on Market Segmentation by Distribution Channel
      • Executive Summary - Chart on Incremental Growth
      • Executive Summary - Data Table on Incremental Growth
      • Executive Summary - Chart on Company Market Positioning

    2 Market Landscape

    • 2.1 Market ecosystem
      • Parent Market
      • Data Table on - Parent Market
    • 2.2 Market characteristics
      • Market characteristics analysis
    • 2.3 Value chain analysis
      • Value Chain Analysis

    3 Market Sizing

    • 3.1 Market definition
      • Offerings of companies included in the market definition
    • 3.2 Market segment analysis
      • Market segments
    • 3.3 Market size 2023
      • 3.4 Market outlook: Forecast for 2023-2028
        • Chart on Global - Market size and forecast 2023-2028 ($ billion)
        • Data Table on Global - Market size and forecast 2023-2028 ($ billion)
        • Chart on Global Market: Year-over-year growth 2023-2028 (%)
        • Data Table on Global Market: Year-over-year growth 2023-2028 (%)

      4 Historic Market Size

      • 4.1 Global Processed Seafood Market 2018 - 2022
        • Historic Market Size - Data Table on Global Processed Seafood Market 2018 - 2022 ($ billion)
      • 4.2 Product segment analysis 2018 - 2022
        • Historic Market Size - Product Segment 2018 - 2022 ($ billion)
      • 4.3 Distribution Channel segment analysis 2018 - 2022
        • Historic Market Size - Distribution Channel Segment 2018 - 2022 ($ billion)
      • 4.4 Geography segment analysis 2018 - 2022
        • Historic Market Size - Geography Segment 2018 - 2022 ($ billion)
      • 4.5 Country segment analysis 2018 - 2022
        • Historic Market Size - Country Segment 2018 - 2022 ($ billion)

      5 Five Forces Analysis

      • 5.1 Five forces summary
        • Five forces analysis - Comparison between 2023 and 2028
      • 5.2 Bargaining power of buyers
        • Bargaining power of buyers - Impact of key factors 2023 and 2028
      • 5.3 Bargaining power of suppliers
        • Bargaining power of suppliers - Impact of key factors in 2023 and 2028
      • 5.4 Threat of new entrants
        • Threat of new entrants - Impact of key factors in 2023 and 2028
      • 5.5 Threat of substitutes
        • Threat of substitutes - Impact of key factors in 2023 and 2028
      • 5.6 Threat of rivalry
        • Threat of rivalry - Impact of key factors in 2023 and 2028
      • 5.7 Market condition
        • Chart on Market condition - Five forces 2023 and 2028

      6 Market Segmentation by Product

      • 6.1 Market segments
        • Chart on Product - Market share (2023-2028) (%)
        • Data Table on Product - Market share (2023-2028) (%)
      • 6.2 Comparison by Product
        • Chart on Comparison by Product
        • Data Table on Comparison by Product
      • 6.3 Frozen seafood - Market size and forecast (2023-2028)
        • Chart on Frozen seafood - Market size and forecast (2023-2028) ($ billion)
        • Data Table on Frozen seafood - Market size and forecast (2023-2028) ($ billion)
        • Chart on Frozen seafood - Year-over-year growth (2023-2028) (%)
        • Data Table on Frozen seafood - Year-over-year growth (2023-2028) (%)
      • 6.4 Canned seafood - Market size and forecast (2023-2028)
        • Chart on Canned seafood - Market size and forecast (2023-2028) ($ billion)
        • Data Table on Canned seafood - Market size and forecast (2023-2028) ($ billion)
        • Chart on Canned seafood - Year-over-year growth (2023-2028) (%)
        • Data Table on Canned seafood - Year-over-year growth (2023-2028) (%)
      • 6.5 Smoked seafood - Market size and forecast (2023-2028)
        • Chart on Smoked seafood - Market size and forecast (2023-2028) ($ billion)
        • Data Table on Smoked seafood - Market size and forecast (2023-2028) ($ billion)
        • Chart on Smoked seafood - Year-over-year growth (2023-2028) (%)
        • Data Table on Smoked seafood - Year-over-year growth (2023-2028) (%)
      • 6.6 Others - Market size and forecast (2023-2028)
        • Chart on Others - Market size and forecast (2023-2028) ($ billion)
        • Data Table on Others - Market size and forecast (2023-2028) ($ billion)
        • Chart on Others - Year-over-year growth (2023-2028) (%)
        • Data Table on Others - Year-over-year growth (2023-2028) (%)
      • 6.7 Market opportunity by Product
        • Market opportunity by Product ($ billion)
        • Data Table on Market opportunity by Product ($ billion)

      7 Market Segmentation by Distribution Channel

      • 7.1 Market segments
        • Chart on Distribution Channel - Market share (2023-2028) (%)
        • Data Table on Distribution Channel - Market share (2023-2028) (%)
      • 7.2 Comparison by Distribution Channel
        • Chart on Comparison by Distribution Channel
        • Data Table on Comparison by Distribution Channel
      • 7.3 Offline - Market size and forecast (2023-2028)
        • Chart on Offline - Market size and forecast (2023-2028) ($ billion)
        • Data Table on Offline - Market size and forecast (2023-2028) ($ billion)
        • Chart on Offline - Year-over-year growth (2023-2028) (%)
        • Data Table on Offline - Year-over-year growth (2023-2028) (%)
      • 7.4 Online - Market size and forecast (2023-2028)
        • Chart on Online - Market size and forecast (2023-2028) ($ billion)
        • Data Table on Online - Market size and forecast (2023-2028) ($ billion)
        • Chart on Online - Year-over-year growth (2023-2028) (%)
        • Data Table on Online - Year-over-year growth (2023-2028) (%)
      • 7.5 Market opportunity by Distribution Channel
        • Market opportunity by Distribution Channel ($ billion)
        • Data Table on Market opportunity by Distribution Channel ($ billion)

      8 Market Segmentation by Processing Method

      • 8.1 Market segments
        • Chart on Processing Method - Market share (2023-2028) (%)
        • Data Table on Processing Method - Market share (2023-2028) (%)
      • 8.2 Comparison by Processing Method
        • Chart on Comparison by Processing Method
        • Data Table on Comparison by Processing Method
      • 8.3 Preserved - Market size and forecast (2023-2028)
        • Chart on Preserved - Market size and forecast (2023-2028) ($ billion)
        • Data Table on Preserved - Market size and forecast (2023-2028) ($ billion)
        • Chart on Preserved - Year-over-year growth (2023-2028) (%)
        • Data Table on Preserved - Year-over-year growth (2023-2028) (%)
      • 8.4 Ready-to-Cook - Market size and forecast (2023-2028)
        • Chart on Ready-to-Cook - Market size and forecast (2023-2028) ($ billion)
        • Data Table on Ready-to-Cook - Market size and forecast (2023-2028) ($ billion)
        • Chart on Ready-to-Cook - Year-over-year growth (2023-2028) (%)
        • Data Table on Ready-to-Cook - Year-over-year growth (2023-2028) (%)
      • 8.5 Ready-to-Eat - Market size and forecast (2023-2028)
        • Chart on Ready-to-Eat - Market size and forecast (2023-2028) ($ billion)
        • Data Table on Ready-to-Eat - Market size and forecast (2023-2028) ($ billion)
        • Chart on Ready-to-Eat - Year-over-year growth (2023-2028) (%)
        • Data Table on Ready-to-Eat - Year-over-year growth (2023-2028) (%)
      • 8.6 Market opportunity by Processing Method
        • Market opportunity by Processing Method ($ billion)
        • Data Table on Market opportunity by Processing Method ($ billion)

      9 Market Segmentation by Source

      • 9.1 Market segments
        • Chart on Source - Market share (2023-2028) (%)
        • Data Table on Source - Market share (2023-2028) (%)
      • 9.2 Comparison by Source
        • Chart on Comparison by Source
        • Data Table on Comparison by Source
      • 9.3 Fish - Market size and forecast (2023-2028)
        • Chart on Fish - Market size and forecast (2023-2028) ($ billion)
        • Data Table on Fish - Market size and forecast (2023-2028) ($ billion)
        • Chart on Fish - Year-over-year growth (2023-2028) (%)
        • Data Table on Fish - Year-over-year growth (2023-2028) (%)
      • 9.4 Crustaceans - Market size and forecast (2023-2028)
        • Chart on Crustaceans - Market size and forecast (2023-2028) ($ billion)
        • Data Table on Crustaceans - Market size and forecast (2023-2028) ($ billion)
        • Chart on Crustaceans - Year-over-year growth (2023-2028) (%)
        • Data Table on Crustaceans - Year-over-year growth (2023-2028) (%)
      • 9.5 Mollusks - Market size and forecast (2023-2028)
        • Chart on Mollusks - Market size and forecast (2023-2028) ($ billion)
        • Data Table on Mollusks - Market size and forecast (2023-2028) ($ billion)
        • Chart on Mollusks - Year-over-year growth (2023-2028) (%)
        • Data Table on Mollusks - Year-over-year growth (2023-2028) (%)
      • 9.6 Market opportunity by Source
        • Market opportunity by Source ($ billion)
        • Data Table on Market opportunity by Source ($ billion)

      10 Customer Landscape

      • 10.1 Customer landscape overview
        • Analysis of price sensitivity, lifecycle, customer purchase basket, adoption rates, and purchase criteria

      11 Geographic Landscape

      • 11.1 Geographic segmentation
        • Chart on Market share by geography 2023-2028 (%)
        • Data Table on Market share by geography 2023-2028 (%)
      • 11.2 Geographic comparison
        • Chart on Geographic comparison
        • Data Table on Geographic comparison
      • 11.3 Europe - Market size and forecast 2023-2028
        • Chart on Europe - Market size and forecast 2023-2028 ($ billion)
        • Data Table on Europe - Market size and forecast 2023-2028 ($ billion)
        • Chart on Europe - Year-over-year growth 2023-2028 (%)
        • Data Table on Europe - Year-over-year growth 2023-2028 (%)
      • 11.4 North America - Market size and forecast 2023-2028
        • Chart on North America - Market size and forecast 2023-2028 ($ billion)
        • Data Table on North America - Market size and forecast 2023-2028 ($ billion)
        • Chart on North America - Year-over-year growth 2023-2028 (%)
        • Data Table on North America - Year-over-year growth 2023-2028 (%)
      • 11.5 APAC - Market size and forecast 2023-2028
        • Chart on APAC - Market size and forecast 2023-2028 ($ billion)
        • Data Table on APAC - Market size and forecast 2023-2028 ($ billion)
        • Chart on APAC - Year-over-year growth 2023-2028 (%)
        • Data Table on APAC - Year-over-year growth 2023-2028 (%)
      • 11.6 Middle East and Africa - Market size and forecast 2023-2028
        • Chart on Middle East and Africa - Market size and forecast 2023-2028 ($ billion)
        • Data Table on Middle East and Africa - Market size and forecast 2023-2028 ($ billion)
        • Chart on Middle East and Africa - Year-over-year growth 2023-2028 (%)
        • Data Table on Middle East and Africa - Year-over-year growth 2023-2028 (%)
      • 11.7 South America - Market size and forecast 2023-2028
        • Chart on South America - Market size and forecast 2023-2028 ($ billion)
        • Data Table on South America - Market size and forecast 2023-2028 ($ billion)
        • Chart on South America - Year-over-year growth 2023-2028 (%)
        • Data Table on South America - Year-over-year growth 2023-2028 (%)
      • 11.8 US - Market size and forecast 2023-2028
        • Chart on US - Market size and forecast 2023-2028 ($ billion)
        • Data Table on US - Market size and forecast 2023-2028 ($ billion)
        • Chart on US - Year-over-year growth 2023-2028 (%)
        • Data Table on US - Year-over-year growth 2023-2028 (%)
      • 11.9 France - Market size and forecast 2023-2028
        • Chart on France - Market size and forecast 2023-2028 ($ billion)
        • Data Table on France - Market size and forecast 2023-2028 ($ billion)
        • Chart on France - Year-over-year growth 2023-2028 (%)
        • Data Table on France - Year-over-year growth 2023-2028 (%)
      • 11.10 Germany - Market size and forecast 2023-2028
        • Chart on Germany - Market size and forecast 2023-2028 ($ billion)
        • Data Table on Germany - Market size and forecast 2023-2028 ($ billion)
        • Chart on Germany - Year-over-year growth 2023-2028 (%)
        • Data Table on Germany - Year-over-year growth 2023-2028 (%)
      • 11.11 China - Market size and forecast 2023-2028
        • Chart on China - Market size and forecast 2023-2028 ($ billion)
        • Data Table on China - Market size and forecast 2023-2028 ($ billion)
        • Chart on China - Year-over-year growth 2023-2028 (%)
        • Data Table on China - Year-over-year growth 2023-2028 (%)
      • 11.12 UK - Market size and forecast 2023-2028
        • Chart on UK - Market size and forecast 2023-2028 ($ billion)
        • Data Table on UK - Market size and forecast 2023-2028 ($ billion)
        • Chart on UK - Year-over-year growth 2023-2028 (%)
        • Data Table on UK - Year-over-year growth 2023-2028 (%)
      • 11.13 Market opportunity by geography
        • Market opportunity by geography ($ billion)
        • Data Tables on Market opportunity by geography ($ billion)
      • 11.14 Canada - Market size and forecast (2023-2028)
        • Chart on Canada - Market size and forecast (2023-2028) ($ billion)
        • Data Table on Canada - Market size and forecast (2023-2028) ($ billion)
        • Chart on Canada - Year-over-year growth (2023-2028) (%)
        • Data Table on Canada - Year-over-year growth (2023-2028) (%)
      • 11.15 Italy - Market size and forecast (2023-2028)
        • Chart on Italy - Market size and forecast (2023-2028) ($ billion)
        • Data Table on Italy - Market size and forecast (2023-2028) ($ billion)
        • Chart on Italy - Year-over-year growth (2023-2028) (%)
        • Data Table on Italy - Year-over-year growth (2023-2028) (%)
      • 11.16 India - Market size and forecast (2023-2028)
        • Chart on India - Market size and forecast (2023-2028) ($ billion)
        • Data Table on India - Market size and forecast (2023-2028) ($ billion)
        • Chart on India - Year-over-year growth (2023-2028) (%)
        • Data Table on India - Year-over-year growth (2023-2028) (%)
      • 11.17 Japan - Market size and forecast (2023-2028)
        • Chart on Japan - Market size and forecast (2023-2028) ($ billion)
        • Data Table on Japan - Market size and forecast (2023-2028) ($ billion)
        • Chart on Japan - Year-over-year growth (2023-2028) (%)
        • Data Table on Japan - Year-over-year growth (2023-2028) (%)
      • 11.18 Brazil - Market size and forecast (2023-2028)
        • Chart on Brazil - Market size and forecast (2023-2028) ($ billion)
        • Data Table on Brazil - Market size and forecast (2023-2028) ($ billion)
        • Chart on Brazil - Year-over-year growth (2023-2028) (%)
        • Data Table on Brazil - Year-over-year growth (2023-2028) (%)
      • 11.19 Egypt - Market size and forecast (2023-2028)
        • Chart on Egypt - Market size and forecast (2023-2028) ($ billion)
        • Data Table on Egypt - Market size and forecast (2023-2028) ($ billion)
        • Chart on Egypt - Year-over-year growth (2023-2028) (%)
        • Data Table on Egypt - Year-over-year growth (2023-2028) (%)
      • 11.20 UAE - Market size and forecast (2023-2028)
        • Chart on UAE - Market size and forecast (2023-2028) ($ billion)
        • Data Table on UAE - Market size and forecast (2023-2028) ($ billion)
        • Chart on UAE - Year-over-year growth (2023-2028) (%)
        • Data Table on UAE - Year-over-year growth (2023-2028) (%)
      • 11.21 Oman - Market size and forecast (2023-2028)
        • Chart on Oman - Market size and forecast (2023-2028) ($ billion)
        • Data Table on Oman - Market size and forecast (2023-2028) ($ billion)
        • Chart on Oman - Year-over-year growth (2023-2028) (%)
        • Data Table on Oman - Year-over-year growth (2023-2028) (%)
      • 11.22 Argentina - Market size and forecast (2023-2028)
        • Chart on Argentina - Market size and forecast (2023-2028) ($ billion)
        • Data Table on Argentina - Market size and forecast (2023-2028) ($ billion)
        • Chart on Argentina - Year-over-year growth (2023-2028) (%)
        • Data Table on Argentina - Year-over-year growth (2023-2028) (%)
      • 11.23 KSA - Market size and forecast (2023-2028)
        • Chart on KSA - Market size and forecast (2023-2028) ($ billion)
        • Data Table on KSA - Market size and forecast (2023-2028) ($ billion)
        • Chart on KSA - Year-over-year growth (2023-2028) (%)
        • Data Table on KSA - Year-over-year growth (2023-2028) (%)
      • 11.24 Rest of World (ROW) - Market size and forecast (2023-2028)
        • Chart on Rest of World (ROW) - Market size and forecast (2023-2028) ($ billion)
        • Data Table on Rest of World (ROW) - Market size and forecast (2023-2028) ($ billion)
        • Chart on Rest of World (ROW) - Year-over-year growth (2023-2028) (%)
        • Data Table on Rest of World (ROW) - Year-over-year growth (2023-2028) (%)

      12 Drivers, Challenges, and Opportunity/Restraints

      • 12.1 Market drivers
        • 12.2 Market challenges
          • 12.3 Impact of drivers and challenges
            • Impact of drivers and challenges in 2023 and 2028
          • 12.4 Market opportunities/restraints

            13 Competitive Landscape

            • 13.1 Overview
              • 13.2 Competitive Landscape
                • Overview on criticality of inputs and factors of differentiation
              • 13.3 Landscape disruption
                • Overview on factors of disruption
              • 13.4 Industry risks
                • Impact of key risks on business

              14 Competitive Analysis

              • 14.1 Companies profiled
                • Companies covered
              • 14.2 Market positioning of companies
                • Matrix on companies position and classification
              • 14.3 Agrosuper SA
                • Agrosuper SA - Overview
                • Agrosuper SA - Business segments
                • Agrosuper SA - Key offerings
                • Agrosuper SA - Segment focus
              • 14.4 Aquafoods
                • Aquafoods - Overview
                • Aquafoods - Product / Service
                • Aquafoods - Key offerings
              • 14.5 Baader Global SE
                • Baader Global SE - Overview
                • Baader Global SE - Product / Service
                • Baader Global SE - Key offerings
              • 14.6 Bolton Group Srl
                • Bolton Group Srl - Overview
                • Bolton Group Srl - Product / Service
                • Bolton Group Srl - Key offerings
              • 14.7 China Aquatic Products Co. Ltd.
                • China Aquatic Products Co. Ltd. - Overview
                • China Aquatic Products Co. Ltd. - Product / Service
                • China Aquatic Products Co. Ltd. - Key offerings
              • 14.8 Cooke Aquaculture Inc.
                • Cooke Aquaculture Inc. - Overview
                • Cooke Aquaculture Inc. - Product / Service
                • Cooke Aquaculture Inc. - Key offerings
              • 14.9 Goya Foods Inc.
                • Goya Foods Inc. - Overview
                • Goya Foods Inc. - Product / Service
                • Goya Foods Inc. - Key offerings
              • 14.10 High Liner Foods Inc.
                • High Liner Foods Inc. - Overview
                • High Liner Foods Inc. - Product / Service
                • High Liner Foods Inc. - Key news
                • High Liner Foods Inc. - Key offerings
              • 14.11 Kyokuyo Co. Ltd
                • Kyokuyo Co. Ltd - Overview
                • Kyokuyo Co. Ltd - Business segments
                • Kyokuyo Co. Ltd - Key offerings
                • Kyokuyo Co. Ltd - Segment focus
              • 14.12 Loch Duart Ltd.
                • Loch Duart Ltd. - Overview
                • Loch Duart Ltd. - Product / Service
                • Loch Duart Ltd. - Key offerings
              • 14.13 Mitsubishi Corp.
                • Mitsubishi Corp. - Overview
                • Mitsubishi Corp. - Business segments
                • Mitsubishi Corp. - Key news
                • Mitsubishi Corp. - Key offerings
                • Mitsubishi Corp. - Segment focus
              • 14.14 Mowi ASA
                • Mowi ASA - Overview
                • Mowi ASA - Business segments
                • Mowi ASA - Key offerings
                • Mowi ASA - Segment focus
              • 14.15 Premium Brands Holdings Corp.
                • Premium Brands Holdings Corp. - Overview
                • Premium Brands Holdings Corp. - Business segments
                • Premium Brands Holdings Corp. - Key news
                • Premium Brands Holdings Corp. - Key offerings
                • Premium Brands Holdings Corp. - Segment focus
              • 14.16 Thai Union Group PCL
                • Thai Union Group PCL - Overview
                • Thai Union Group PCL - Business segments
                • Thai Union Group PCL - Key offerings
                • Thai Union Group PCL - Segment focus
              • 14.17 Universal Seafood Inc.
                • Universal Seafood Inc. - Overview
                • Universal Seafood Inc. - Product / Service
                • Universal Seafood Inc. - Key offerings

              15 Appendix

              • 15.1 Scope of the report
                • 15.2 Inclusions and exclusions checklist
                  • Inclusions checklist
                  • Exclusions checklist
                • 15.3 Currency conversion rates for US$
                  • Currency conversion rates for US$
                • 15.4 Research methodology
                  • Research methodology
                • 15.5 Data procurement
                  • Information sources
                • 15.6 Data validation
                  • Data validation
                • 15.7 Validation techniques employed for market sizing
                  • Validation techniques employed for market sizing
                • 15.8 Data synthesis
                  • Data synthesis
                • 15.9 360 degree market analysis
                  • 360 degree market analysis
                • 15.10 List of abbreviations
                  • List of abbreviations

                Research Methodology

                Technavio presents a detailed picture of the market by way of study, synthesis, and summation of data from multiple sources. The analysts have presented the various facets of the market with a particular focus on identifying the key industry influencers. The data thus presented is comprehensive, reliable, and the result of extensive research, both primary and secondary.

                INFORMATION SOURCES

                Primary sources

                • Manufacturers and suppliers
                • Channel partners
                • Industry experts
                • Strategic decision makers

                Secondary sources

                • Industry journals and periodicals
                • Government data
                • Financial reports of key industry players
                • Historical data
                • Press releases

                DATA ANALYSIS

                Data Synthesis

                • Collation of data
                • Estimation of key figures
                • Analysis of derived insights

                Data Validation

                • Triangulation with data models
                • Reference against proprietary databases
                • Corroboration with industry experts

                REPORT WRITING

                Qualitative

                • Market drivers
                • Market challenges
                • Market trends
                • Five forces analysis

                Quantitative

                • Market size and forecast
                • Market segmentation
                • Geographical insights
                • Competitive landscape

                Interested in this report?

                Get your sample now to see our research methodology and insights!

                Download Now

                Frequently Asked Questions

                Processed Seafood market growth will increase by $ 76.1 bn during 2024-2028 .

                The Processed Seafood market is expected to grow at a CAGR of 8.08% during 2024-2028 .

                Processed Seafood market is segmented by Product( Frozen seafood, Canned seafood, Smoked seafood, Others) Distribution Channel( Offline, Online, APAC, MEA, South America)

                Agrosuper SA, Aquafoods, Austevoll Seafood ASA, Baader Global SE, Bolton Group Srl, China Aquatic Products Co. Ltd., Cooke Aquaculture Inc., Gadre Marine Export Pvt. Ltd., Goya Foods Inc., High Liner Foods Inc., KARRO FOOD GROUP, Kyokuyo Co. Ltd, Loch Duart Ltd., Mitsubishi Corp., Mowi ASA, Perdue Farms Inc., Premium Brands Holdings Corp., Thai Union Group PCL, Trident Seafoods Corp., Universal Seafood Inc. are a few of the key vendors in the Processed Seafood market.

                Europe will register the highest growth rate of 49% among the other regions. Therefore, the Processed Seafood market in Europe is expected to garner significant business opportunities for the vendors during the forecast period.

                US, Canada, Germany, UK, Italy, France, China, India, Japan, Brazil, Egypt, UAE, Oman, Argentina, KSA, UAE, Brazil, Rest of World (ROW)

                • High demand of protein-rich and ready-to-eat seafoodProcessed seafood is gaining popularity among consumers as it offers convenient cooking and is rich in protein. With the economic conditions improving globally is the driving factor this market.
                • the demand for processed seafood is expected to increase during the forecast period. Consumers are increasingly purchasing protein-rich foods is the driving factor this market.
                • for example is the driving factor this market.
                • seafood products. Processed seafood is ready to cook and saves time. Hence is the driving factor this market.
                • consumers can eat food as per their preferences. Seafood is rich in essential nutrients is the driving factor this market.
                • especially in proteins is the driving factor this market.
                • vitamins is the driving factor this market.
                • and minerals. It has been a part of a staple diet in many geographies and cultures. Cooking fresh seafood is often cumbersome. Processed seafood combines health and convenience to the benefit of the consumer. The wide variety of processed seafood in ready-to-cook packaging saves time and effort. Time-strapped consumers prefer these is the driving factor this market.
                • as it cuts down on cooking time without compromising health and nutrition aspects which are expected to boost the growth of the global market in focus during the forecast period. is the driving factor this market.

                The Processed Seafood market vendors should focus on grabbing business opportunities from the Frozen seafood segment as it accounted for the largest market share in the base year.