
Sawn Wood Market Analysis, Size, and Forecast 2026-2030: APAC (China, India, and Japan), North America (US, Canada, and Mexico), Europe (Germany, France, and UK), Middle East and Africa (Turkey, Saudi Arabia, and UAE), South America (Brazil, Argentina, and Colombia), and Rest of World (ROW)

Sawn Wood Market Analysis, Size, and Forecast 2026-2030:
APAC (China, India, and Japan), North America (US, Canada, and Mexico), Europe (Germany, France, and UK), Middle East and Africa (Turkey, Saudi Arabia, and UAE), South America (Brazil, Argentina, and Colombia), and Rest of World (ROW)

Published: Oct 2026 301 Pages SKU: IRTNTR81804

Market Overview at a Glance

$26.45 B
Market Opportunity
3.5%
CAGR 2025 - 2030
42.4%
APAC Growth
$76.98 B
Softwood segment 2024

Sawn Wood Market Size 2026-2030

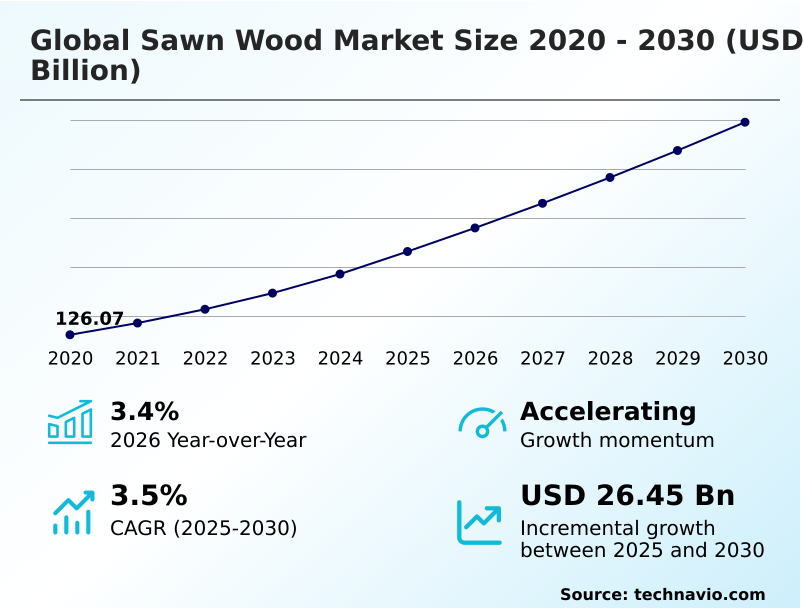
The sawn wood market size is valued to increase by USD 26.45 billion, at a CAGR of 3.5% from 2025 to 2030. Surge in sustainable construction and mass timber adoption will drive the sawn wood market.

Major Market Trends & Insights

  • APAC dominated the market and accounted for a 42.4% growth during the forecast period.
  • By Type - Softwood segment was valued at USD 76.98 billion in 2024
  • By Application - Construction segment accounted for the largest market revenue share in 2024

Market Size & Forecast

  • Market Opportunities: USD 43.48 billion
  • Market Future Opportunities: USD 26.45 billion
  • CAGR from 2025 to 2030 : 3.5%

Market Summary

  • The Sawn Wood Market demonstrates robust momentum driven by the international transition toward sustainable infrastructure and advanced bio-based construction materials. A critical operational scenario involves primary sawmilling facilities implementing automated log scanning alongside roundwood evaluation systems to maximize raw material yield, which effectively minimizes volumetric waste and enhances profit margins.
  • Facilities utilizing these advanced processing technologies, combined with robotic material handling, report a 15% improvement in high-grade timber recovery compared to conventional milling operations. This expansion is strongly propelled by the rising adoption of glue laminated beams; as building codes evolve to permit taller wooden structures, the demand for dimensionally stable structural timber surges.
  • Conversely, the market faces significant constraints due to climate induced forest disruptions. Catastrophic weather events frequently degrade harvestable timber inventories, forcing processors to handle salvage wood and elevating raw material costs, thereby compressing operational margins for secondary wood manufacturers.

What will be the Size of the Sawn Wood Market during the forecast period?
Get Key Insights on Market Forecast (PDF) Get Free Sample

How is the Sawn Wood Market Segmented?

The sawn wood industry research report provides comprehensive data (region-wise segment analysis), with forecasts and estimates in "USD million" for the period 2026-2030, as well as historical data from 2020-2024 for the following segments.

  • Type
    • Softwood
    • Hardwood
  • Application
    • Construction
    • Furniture and joinery
    • Packaging and pallets
    • Flooring and interior
    • Others
  • End-user
    • Residential
    • Industrial
    • Commercial
  • Geography
    • APAC
      • China
      • India
      • Japan
      • Indonesia
      • South Korea
      • Australia
    • North America
      • US
      • Canada
      • Mexico
    • Europe
      • Germany
      • France
      • UK
      • Italy
      • Spain
      • The Netherlands
    • Middle East and Africa
      • Turkey
      • Saudi Arabia
      • UAE
      • South Africa
      • Israel
    • South America
      • Brazil
      • Argentina
      • Colombia

By Type Insights

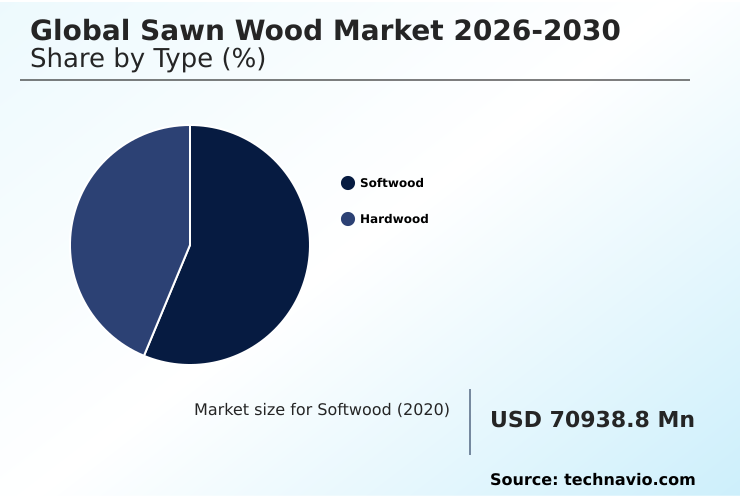
The softwood segment is estimated to witness significant growth during the forecast period.

The softwood segment holds a substantial volume share within the Sawn Wood Market, driven by its versatile applications in residential repair remodeling and structural engineering.

Coniferous species such as pine and spruce provide an optimal balance of tensile strength and uniform density, making them essential for sustainable architectural materials.

Adoption of advanced engineered wood systems has expanded the utility of kiln dried lumber in commercial infrastructure, achieving a 25% increase in structural load capacity for mid-rise developments.

Builders increasingly rely on cross laminated timber to meet stringent green building codes while reducing project completion times by nearly 15%.

This structural shift toward bio-based construction materials fundamentally alters procurement strategies, compelling forest product manufacturers to align with high-yield plantation cycles to sustain consistent volume outputs.
Get Free Sample

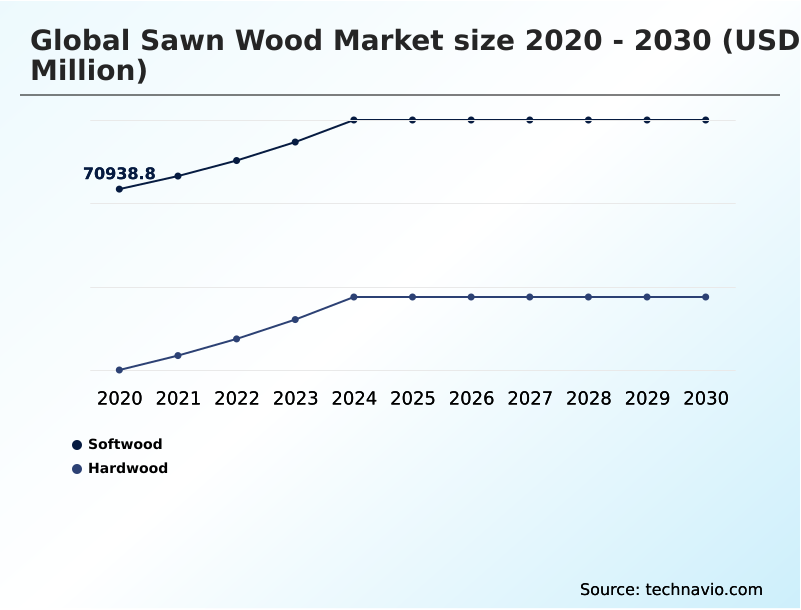
The Softwood segment was valued at USD 76.98 billion in 2024 and showed a gradual increase during the forecast period.
Get Free Sample

Regional Analysis

APAC is estimated to contribute 42.4% to the growth of the global market during the forecast period.Technavio’s analysts have elaborately explained the regional trends and drivers that shape the market during the forecast period.
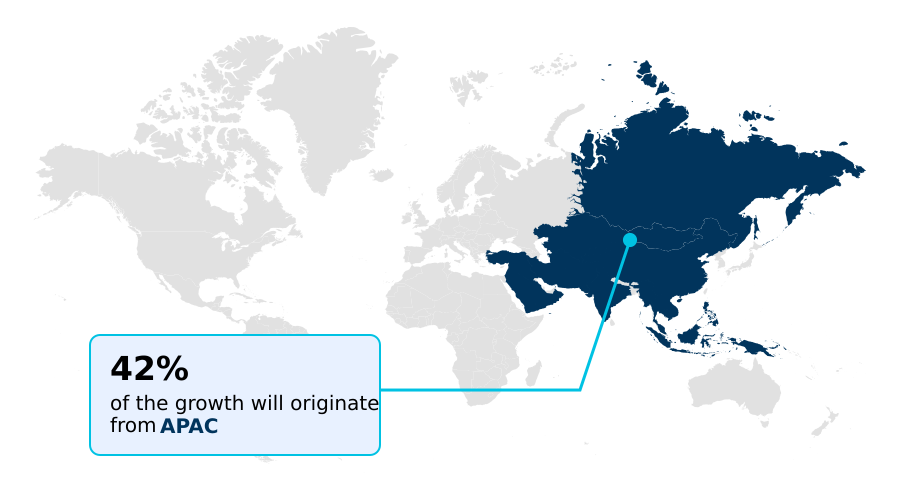
See How Sawn Wood Market Demand is Rising in APAC Get Free Sample

Regional consumption within the Sawn Wood Market highlights distinct operational shifts between APAC and North America.

North American processing operations maintain a dominant position through extensive wood fiber processing networks, achieving a 20% higher output efficiency compared to emerging Asian hubs due to the widespread implementation of automated sawmill log scanning systems.

This technological edge enables precise structural timber grading that aligns perfectly with strict green building certification standards. In contrast, APAC demonstrates rapid infrastructure expansion, importing massive volumes of raw logs to supply domestic manufacturing sectors.

However, North American mills utilizing modern continuous dry kilns report a 15% reduction in thermal energy costs, a metric currently unmatched by decentralized sawmills in Southeast Asia.

These technological and regulatory disparities force multinational timber corporations to localize their processing strategies, optimizing supply chains to match distinct regional compliance frameworks and construction demands.

Market Dynamics

Our researchers analyzed the data with 2025 as the base year, along with the key drivers, trends, and challenges. A holistic analysis of drivers will help companies refine their marketing strategies to gain a competitive advantage.

  • The evolving landscape of the Sawn Wood Market underscores a fundamental shift toward highly engineered and ecologically responsible materials across diverse industrial segments. Commercial construction firms increasingly specify kiln dried softwood dimensional lumber to ensure superior load-bearing capacity and dimensional stability in advanced building projects.
  • This preference directly supports the rapid expansion of cross laminated timber structural framing, which offers architects a low-carbon alternative to conventional steel and concrete, while indirectly reducing building foundation costs by nearly 20% due to the lighter structural weight of mass timber.
  • Concurrently, primary wood processors are optimizing their raw material recovery by integrating automated sawmill log scanning systems to evaluate internal log characteristics prior to cutting, maximizing high-value yield and minimizing process residual waste. Beyond primary structural applications, the outdoor decking and infrastructure sectors are witnessing increased adoption of thermally modified architectural wood components.
  • By altering the cellular structure of fast-growing softwoods without toxic chemicals, these modified timbers deliver exceptional weather resistance and longevity. Furthermore, global logistics operators continue to rely heavily on sustainable sawn timber packaging solutions alongside industrial freight protection to safeguard high-value merchandise during intermodal transit.
  • This multifaceted demand profile across residential building, architectural joinery, and international freight protection ensures that sawmills retain versatile distribution channels, reinforcing operational resilience against periodic macroeconomic fluctuations.
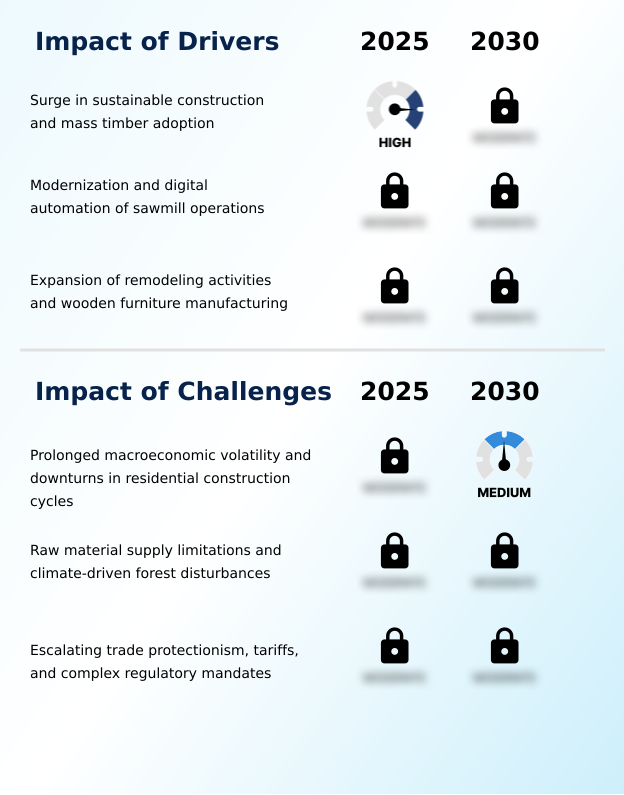
What are the key market drivers leading to the rise in the adoption of Sawn Wood Industry?

  • The surge in sustainable construction practices and the rising adoption of mass timber serve as primary drivers propelling the market.

  • The primary catalyst accelerating the Sawn Wood Market is the rapid transition toward low-carbon architectural frameworks. Stringent urban decarbonization mandates require developers to minimize embodied emissions, directly driving a surge in mass timber developments.
  • By substituting structural steel with engineered dimensional sawn timber, commercial construction firms have achieved a 25% reduction in overall project carbon footprints.
  • Furthermore, sawmills are implementing rigorous wood waste optimization protocols, decreasing raw material discard rates by up to 18% during the fabrication of architectural millwork components. This enhanced operational efficiency lowers unit production costs, ensuring that sustainable timber remains economically competitive.
  • Consequently, these environmental directives and manufacturing improvements compel construction consortia to establish long-term supply agreements for precision-milled structural lumber.

What are the market trends shaping the Sawn Wood Industry?

  • Regulatory due diligence and stringent traceability requirements across timber trade flows have emerged as an upcoming market trend.

  • A defining trend within the Sawn Wood Market is the accelerated adoption of advanced chemical and thermal engineering to enhance softwood durability. Manufacturers deploying thermal modification technology have effectively increased the biological resistance of dimension lumber, resulting in a 30% extension in the operational lifespan of exterior decking treatments using thermally modified hardwoods.
  • This innovation allows fast-growing softwoods to competitively substitute scarce tropical hardwoods in premium landscaping applications. Concurrently, international freight networks are enforcing strict phytosanitary standard compliance, compelling the wooden pallet manufacturing sector to upgrade heat-treatment protocols. Operations utilizing digitized timber chain of custody systems experience a 15% reduction in cross-border customs delays, ensuring seamless logistics.
  • This systemic shift toward verifiable, high-performance wood products transforms procurement dynamics, allowing industrial buyers to meet rigorous environmental standards without sacrificing mechanical reliability.

What challenges does the Sawn Wood Industry face during its growth?

  • Prolonged macroeconomic volatility and cyclical downturns in residential construction remain significant challenges limiting industry growth.

  • The Sawn Wood Market faces substantial operational friction stemming from ecological volatility and stringent supply chain regulations. Severe climate induced forest disruptions, including wildfires and pest infestations, severely compromise harvestable timber reserves, driving a 20% spike in raw sawlog procurement costs across mature forestry regions.
  • This material scarcity forces secondary processors to absorb compressed profit margins when producing structural wood sheathing and standard sawn pine boards. Additionally, the complex administrative burden of adhering to disparate international timber legality frameworks increases compliance overhead. Small-to-medium sawmills attempting to navigate these mandatory digital tracing requirements often report a 12% increase in logistical lead times.
  • These cascading environmental and regulatory constraints threaten the consistent availability of economically viable timber, complicating long-term inventory planning for global building material distributors.

Exclusive Technavio Analysis on Customer Landscape

The sawn wood market forecasting report includes the adoption lifecycle of the market, covering from the innovator’s stage to the laggard’s stage. It focuses on adoption rates in different regions based on penetration. Furthermore, the sawn wood market report also includes key purchase criteria and drivers of price sensitivity to help companies evaluate and develop their market growth analysis strategies.
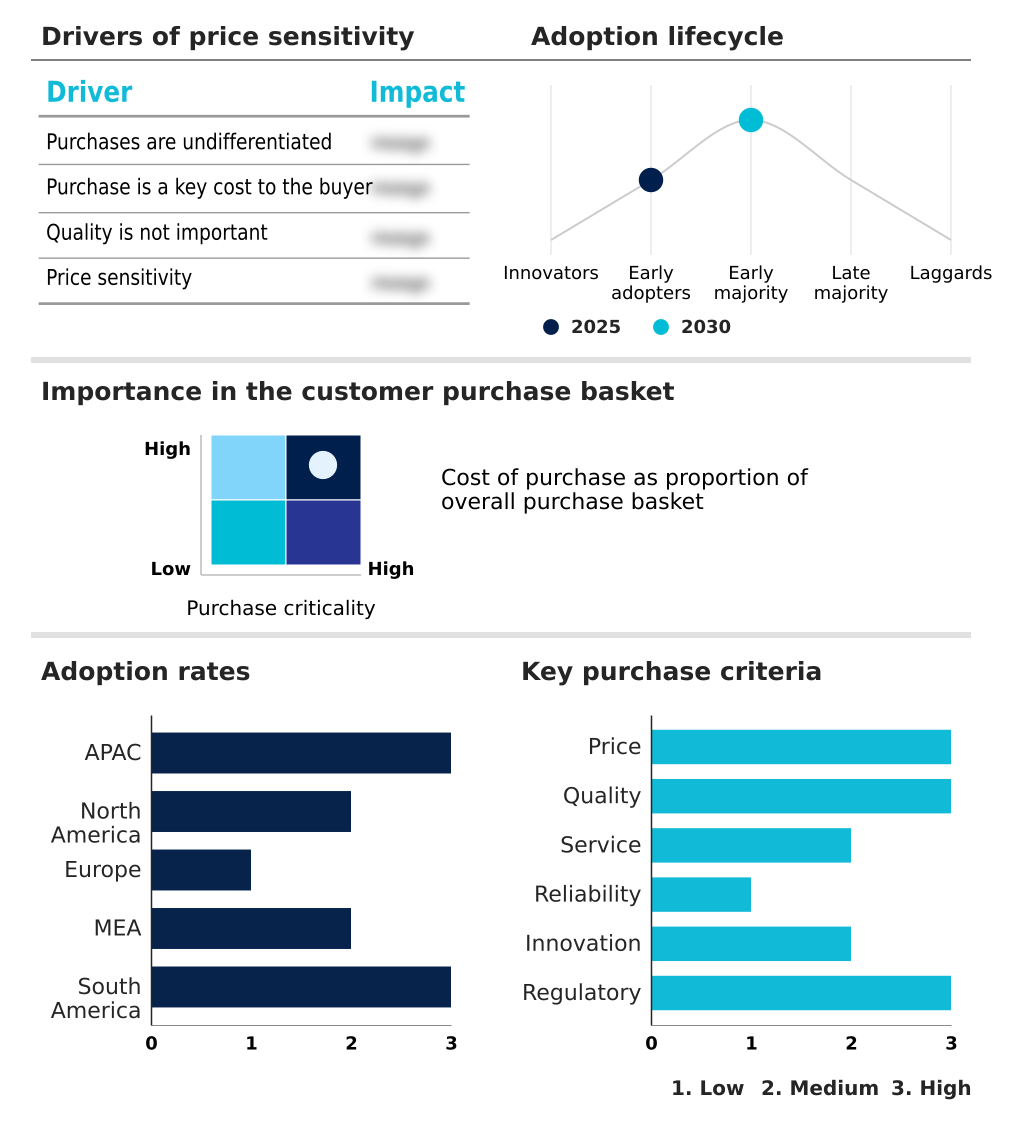
Customer Landscape of Sawn Wood Industry

Competitive Landscape

Companies are implementing various strategies, such as strategic alliances, sawn wood market forecast, partnerships, mergers and acquisitions, geographical expansion, and product/service launches, to enhance their presence in the industry.

Binderholz GmbH - Key offerings include high-grade dimensional spruce, pine, and fir lumber, engineered structural timber, and customized kiln-dried softwood solutions designed for construction, joinery, and industrial packaging applications.

The industry research and growth report includes detailed analyses of the competitive landscape of the market and information about key companies, including:

  • Binderholz GmbH
  • Boise Cascade Co.
  • Canfor Corp.
  • Domtar Corp.
  • Georgia Pacific LLC
  • Hampton Lumber
  • HS Timber Group
  • Idaho Forest Group LLC.
  • Interfor Corp.
  • Mayr Melnhof Holz Holding AG
  • Metsa Group
  • Pfeifer Holding GmbH
  • Sierra Pacific Industries
  • Sodra
  • Stora Enso Oyj
  • The SCA Group LLC
  • Tolko Industries Ltd.
  • UPM Timber
  • West Fraser Timber Co. Ltd.
  • Weyerhaeuser Co.

Qualitative and quantitative analysis of companies has been conducted to help clients understand the wider business environment as well as the strengths and weaknesses of key industry players. Data is qualitatively analyzed to categorize companies as pure play, category-focused, industry-focused, and diversified; it is quantitatively analyzed to categorize companies as dominant, leading, strong, tentative, and weak.

Recent Development and News in Sawn wood market

  • In the Forest Products industry, the widespread integration of computerized tomography evaluation and acoustic wave velocity testing across primary sawmills has increased log recovery optimization, directly impacting Sawn Wood demand by lowering unit conversion expenses.
  • Stringent regulatory enforcement of timber legality frameworks has mandated comprehensive digital timber tracking, restricting uncertified supply flows and elevating the commercial valuation of verified sustainable architectural materials within the Sawn Wood market.
  • The architectural shift toward multi story mass timber and carbon sequestration capability in commercial real estate has triggered a 20% expansion in regional engineered wood manufacturing capacity, fundamentally altering Sawn Wood procurement for structural framing components.
  • Advancements in preservative chemical treatment have substantially improved the biological resistance of fast-growing softwoods, directly impacting the Sawn Wood market by enabling these species to displace traditional tropical hardwoods in exterior applications.

Dive into Technavio’s robust research methodology, blending expert interviews, extensive data synthesis, and validated models for unparalleled Sawn Wood Market insights. See full methodology.

Market Scope
Page number 301
Base year 2025
Historic period 2020-2024
Forecast period 2026-2030
Growth momentum & CAGR Accelerate at a CAGR of 3.5%
Market growth 2026-2030 USD 26449.1 million
Market structure Fragmented
YoY growth 2025-2026(%) 3.4%
Key countries China, India, Japan, Indonesia, South Korea, Australia, US, Canada, Mexico, Germany, France, UK, Italy, Spain, The Netherlands, Turkey, Saudi Arabia, UAE, South Africa, Israel, Brazil, Argentina and Colombia
Competitive landscape Leading Companies, Market Positioning of Companies, Competitive Strategies, and Industry Risks

Request Free Sample

Research Analyst Overview

  • The Sawn Wood Market exhibits continuous evolution driven by sophisticated mechanical processing and stringent material compliance. Modern primary conversion facilities have successfully integrated computerized tomography evaluation and thin kerf bandmill technology, a strategic move that has generated a 12% improvement in volumetric log yield.
  • This precise initial breakdown is critical for producing boards that meet rigorous engineered lamstock specifications required by advanced architectural projects. Furthermore, operators are deploying radio frequency vacuum drying techniques to achieve rapid moisture content stabilization without inducing cellular stress or mechanical warping.
  • Sourcing practices have also shifted dramatically, as corporate procurement teams now mandate certified roundwood feedstock to align with international decarbonization regulations. This focus on verifiable supply chains perfectly complements the rising commercial trend of biophilic interior architecture, where exposed natural wood elements enhance occupant well-being in premium corporate environments.
  • Ultimately, these technological and operational enhancements fortify the competitive standing of bio-based materials against synthetic alternatives, ensuring robust material pipelines for structurally demanding applications.

What are the Key Data Covered in this Sawn Wood Market Research and Growth Report?

  • What is the expected growth of the Sawn Wood Market between 2026 and 2030?

    • USD 26.45 billion, at a CAGR of 3.5%

  • What segmentation does the market report cover?

    • The report is segmented by Type (Softwood, and Hardwood), Application (Construction, Furniture and joinery, Packaging and pallets, Flooring and interior, and Others), End-user (Residential, Industrial, and Commercial) and Geography (APAC, North America, Europe, Middle East and Africa, South America)

  • Which regions are analyzed in the report?

    • APAC, North America, Europe, Middle East and Africa and South America

  • What are the key growth drivers and market challenges?

    • Surge in sustainable construction and mass timber adoption, Prolonged macroeconomic volatility and downturns in residential construction cycles

  • Who are the major players in the Sawn Wood Market?

    • Binderholz GmbH, Boise Cascade Co., Canfor Corp., Domtar Corp., Georgia Pacific LLC, Hampton Lumber, HS Timber Group, Idaho Forest Group LLC., Interfor Corp., Mayr Melnhof Holz Holding AG, Metsa Group, Pfeifer Holding GmbH, Sierra Pacific Industries, Sodra, Stora Enso Oyj, The SCA Group LLC, Tolko Industries Ltd., UPM Timber, West Fraser Timber Co. Ltd. and Weyerhaeuser Co.

Market Research Insights

  • The Sawn Wood Market undergoes rapid transformation as developers prioritize renewable structural materials over traditional concrete and steel. Within wood product manufacturing, companies leveraging advanced prefabrication timber capabilities have improved onsite assembly speed by 25%, drastically lowering labor dependency.
  • Furthermore, the integration of durable hardwood joinery components in commercial real estate has seen a 15% higher retention of property value over a ten-year lifecycle. Concurrently, the logistics sector continues to demand resilient industrial packaging solutions, resulting in a 12% cost reduction in intermodal transit damage when utilizing standardized wooden shipping crates.
  • These measurable efficiency gains underscore the strategic importance of dimension lumber across diverse industrial applications.

We can help! Our analysts can customize this sawn wood market research report to meet your requirements.

Get in touch

1. Executive Summary

1.1 Market overview

Executive Summary - Chart on Market Overview
Executive Summary - Data Table on Market Overview
Executive Summary - Chart on Global Market Characteristics
Executive Summary - Chart on Market by Geography
Executive Summary - Chart on Market Segmentation by Type
Executive Summary - Chart on Market Segmentation by Application
Executive Summary - Chart on Market Segmentation by End-user
Executive Summary - Chart on Incremental Growth
Executive Summary - Data Table on Incremental Growth
Executive Summary - Chart on Company Market Positioning

2. Technavio Analysis

2.1 Analysis of price sensitivity, lifecycle, customer purchase basket, adoption rates, and purchase criteria

2.2 Criticality of inputs and Factors of differentiation

Chart on Overview on criticality of inputs and factors of differentiation

2.3 Factors of disruption

Chart on Overview on factors of disruption

2.4 Impact of drivers and challenges

Chart on Impact of drivers and challenges in 2025 and 2030

3. Market Landscape

3.1 Market ecosystem

Chart on Parent Market
Data Table on - Parent Market

3.2 Market characteristics

Chart on Market characteristics analysis

3.3 Value chain analysis

Chart on Value chain analysis

4. Market Sizing

4.1 Market definition

Data Table on Offerings of companies included in the market definition

4.2 Market segment analysis

Market segments

4.3 Market size 2025

4.4 Market outlook: Forecast for 2025-2030

Chart on Global - Market size and forecast 2025-2030 ($ million)
Data Table on Global - Market size and forecast 2025-2030 ($ million)
Chart on Global Market: Year-over-year growth 2025-2030 (%)
Data Table on Global Market: Year-over-year growth 2025-2030 (%)

5. Historic Market Size

5.1 Global Sawn Wood Market 2020 - 2024

Historic Market Size - Data Table on Global Sawn Wood Market 2020 - 2024 ($ million)

5.2 Type segment analysis 2020 - 2024

Historic Market Size - Type Segment 2020 - 2024 ($ million)

5.3 Application segment analysis 2020 - 2024

Historic Market Size - Application Segment 2020 - 2024 ($ million)

5.4 End-user segment analysis 2020 - 2024

Historic Market Size - End-user Segment 2020 - 2024 ($ million)

5.5 Geography segment analysis 2020 - 2024

Historic Market Size - Geography Segment 2020 - 2024 ($ million)

5.6 Country segment analysis 2020 - 2024

Historic Market Size - Country Segment 2020 - 2024 ($ million)

6. Qualitative Analysis

6.1 Impact of AI on Global Sawn Wood Market

6.2 Impact of Geopolitical Conflicts Market on Global Sawn Wood Market

7. Five Forces Analysis

7.1 Five forces summary

Five forces analysis - Comparison between 2025 and 2030

7.2 Bargaining power of buyers

Bargaining power of buyers - Impact of key factors 2025 and 2030

7.3 Bargaining power of suppliers

Bargaining power of suppliers - Impact of key factors in 2025 and 2030

7.4 Threat of new entrants

Threat of new entrants - Impact of key factors in 2025 and 2030

7.5 Threat of substitutes

Threat of substitutes - Impact of key factors in 2025 and 2030

7.6 Threat of rivalry

Threat of rivalry - Impact of key factors in 2025 and 2030

7.7 Market condition

Chart on Market condition - Five forces 2025 and 2030

8. Market Segmentation by Type

8.1 Market segments

Chart on Type - Market share 2025-2030 (%)
Data Table on Type - Market share 2025-2030 (%)

8.2 Comparison by Type

Chart on Comparison by Type
Data Table on Comparison by Type

8.3 Softwood - Market size and forecast 2025-2030

Chart on Softwood - Market size and forecast 2025-2030 ($ million)
Data Table on Softwood - Market size and forecast 2025-2030 ($ million)
Chart on Softwood - Year-over-year growth 2025-2030 (%)
Data Table on Softwood - Year-over-year growth 2025-2030 (%)

8.4 Hardwood - Market size and forecast 2025-2030

Chart on Hardwood - Market size and forecast 2025-2030 ($ million)
Data Table on Hardwood - Market size and forecast 2025-2030 ($ million)
Chart on Hardwood - Year-over-year growth 2025-2030 (%)
Data Table on Hardwood - Year-over-year growth 2025-2030 (%)

8.5 Market opportunity by Type

Market opportunity by Type ($ million)
Data Table on Market opportunity by Type ($ million)

9. Market Segmentation by Application

9.1 Market segments

Chart on Application - Market share 2025-2030 (%)
Data Table on Application - Market share 2025-2030 (%)

9.2 Comparison by Application

Chart on Comparison by Application
Data Table on Comparison by Application

9.3 Construction - Market size and forecast 2025-2030

Chart on Construction - Market size and forecast 2025-2030 ($ million)
Data Table on Construction - Market size and forecast 2025-2030 ($ million)
Chart on Construction - Year-over-year growth 2025-2030 (%)
Data Table on Construction - Year-over-year growth 2025-2030 (%)

9.4 Furniture and joinery - Market size and forecast 2025-2030

Chart on Furniture and joinery - Market size and forecast 2025-2030 ($ million)
Data Table on Furniture and joinery - Market size and forecast 2025-2030 ($ million)
Chart on Furniture and joinery - Year-over-year growth 2025-2030 (%)
Data Table on Furniture and joinery - Year-over-year growth 2025-2030 (%)

9.5 Packaging and pallets - Market size and forecast 2025-2030

Chart on Packaging and pallets - Market size and forecast 2025-2030 ($ million)
Data Table on Packaging and pallets - Market size and forecast 2025-2030 ($ million)
Chart on Packaging and pallets - Year-over-year growth 2025-2030 (%)
Data Table on Packaging and pallets - Year-over-year growth 2025-2030 (%)

9.6 Flooring and interior - Market size and forecast 2025-2030

Chart on Flooring and interior - Market size and forecast 2025-2030 ($ million)
Data Table on Flooring and interior - Market size and forecast 2025-2030 ($ million)
Chart on Flooring and interior - Year-over-year growth 2025-2030 (%)
Data Table on Flooring and interior - Year-over-year growth 2025-2030 (%)

9.7 Others - Market size and forecast 2025-2030

Chart on Others - Market size and forecast 2025-2030 ($ million)
Data Table on Others - Market size and forecast 2025-2030 ($ million)
Chart on Others - Year-over-year growth 2025-2030 (%)
Data Table on Others - Year-over-year growth 2025-2030 (%)

9.8 Market opportunity by Application

Market opportunity by Application ($ million)
Data Table on Market opportunity by Application ($ million)

10. Market Segmentation by End-user

10.1 Market segments

Chart on End-user - Market share 2025-2030 (%)
Data Table on End-user - Market share 2025-2030 (%)

10.2 Comparison by End-user

Chart on Comparison by End-user
Data Table on Comparison by End-user

10.3 Residential - Market size and forecast 2025-2030

Chart on Residential - Market size and forecast 2025-2030 ($ million)
Data Table on Residential - Market size and forecast 2025-2030 ($ million)
Chart on Residential - Year-over-year growth 2025-2030 (%)
Data Table on Residential - Year-over-year growth 2025-2030 (%)

10.4 Industrial - Market size and forecast 2025-2030

Chart on Industrial - Market size and forecast 2025-2030 ($ million)
Data Table on Industrial - Market size and forecast 2025-2030 ($ million)
Chart on Industrial - Year-over-year growth 2025-2030 (%)
Data Table on Industrial - Year-over-year growth 2025-2030 (%)

10.5 Commercial - Market size and forecast 2025-2030

Chart on Commercial - Market size and forecast 2025-2030 ($ million)
Data Table on Commercial - Market size and forecast 2025-2030 ($ million)
Chart on Commercial - Year-over-year growth 2025-2030 (%)
Data Table on Commercial - Year-over-year growth 2025-2030 (%)

10.6 Market opportunity by End-user

Market opportunity by End-user ($ million)
Data Table on Market opportunity by End-user ($ million)

11. Customer Landscape

11.1 Customer landscape overview

Analysis of price sensitivity, lifecycle, customer purchase basket, adoption rates, and purchase criteria

12. Geographic Landscape

12.1 Geographic segmentation

Chart on Market share by geography 2025-2030 (%)
Data Table on Market share by geography 2025-2030 (%)

12.2 Geographic comparison

Chart on Geographic comparison
Data Table on Geographic comparison

12.3 APAC - Market size and forecast 2025-2030

Chart on APAC - Market size and forecast 2025-2030 ($ million)
Data Table on APAC - Market size and forecast 2025-2030 ($ million)
Chart on APAC - Year-over-year growth 2025-2030 (%)
Data Table on APAC - Year-over-year growth 2025-2030 (%)
Chart on Regional Comparison - APAC
Data Table on Regional Comparison - APAC

12.3.1 China - Market size and forecast 2025-2030

Chart on China - Market size and forecast 2025-2030 ($ million)
Data Table on China - Market size and forecast 2025-2030 ($ million)
Chart on China - Year-over-year growth 2025-2030 (%)
Data Table on China - Year-over-year growth 2025-2030 (%)

12.3.2 India - Market size and forecast 2025-2030

Chart on India - Market size and forecast 2025-2030 ($ million)
Data Table on India - Market size and forecast 2025-2030 ($ million)
Chart on India - Year-over-year growth 2025-2030 (%)
Data Table on India - Year-over-year growth 2025-2030 (%)

12.3.3 Japan - Market size and forecast 2025-2030

Chart on Japan - Market size and forecast 2025-2030 ($ million)
Data Table on Japan - Market size and forecast 2025-2030 ($ million)
Chart on Japan - Year-over-year growth 2025-2030 (%)
Data Table on Japan - Year-over-year growth 2025-2030 (%)

12.3.4 Indonesia - Market size and forecast 2025-2030

Chart on Indonesia - Market size and forecast 2025-2030 ($ million)
Data Table on Indonesia - Market size and forecast 2025-2030 ($ million)
Chart on Indonesia - Year-over-year growth 2025-2030 (%)
Data Table on Indonesia - Year-over-year growth 2025-2030 (%)

12.3.5 South Korea - Market size and forecast 2025-2030

Chart on South Korea - Market size and forecast 2025-2030 ($ million)
Data Table on South Korea - Market size and forecast 2025-2030 ($ million)
Chart on South Korea - Year-over-year growth 2025-2030 (%)
Data Table on South Korea - Year-over-year growth 2025-2030 (%)

12.3.6 Australia - Market size and forecast 2025-2030

Chart on Australia - Market size and forecast 2025-2030 ($ million)
Data Table on Australia - Market size and forecast 2025-2030 ($ million)
Chart on Australia - Year-over-year growth 2025-2030 (%)
Data Table on Australia - Year-over-year growth 2025-2030 (%)

12.4 North America - Market size and forecast 2025-2030

Chart on North America - Market size and forecast 2025-2030 ($ million)
Data Table on North America - Market size and forecast 2025-2030 ($ million)
Chart on North America - Year-over-year growth 2025-2030 (%)
Data Table on North America - Year-over-year growth 2025-2030 (%)
Chart on Regional Comparison - North America
Data Table on Regional Comparison - North America

12.4.1 US - Market size and forecast 2025-2030

Chart on US - Market size and forecast 2025-2030 ($ million)
Data Table on US - Market size and forecast 2025-2030 ($ million)
Chart on US - Year-over-year growth 2025-2030 (%)
Data Table on US - Year-over-year growth 2025-2030 (%)

12.4.2 Canada - Market size and forecast 2025-2030

Chart on Canada - Market size and forecast 2025-2030 ($ million)
Data Table on Canada - Market size and forecast 2025-2030 ($ million)
Chart on Canada - Year-over-year growth 2025-2030 (%)
Data Table on Canada - Year-over-year growth 2025-2030 (%)

12.4.3 Mexico - Market size and forecast 2025-2030

Chart on Mexico - Market size and forecast 2025-2030 ($ million)
Data Table on Mexico - Market size and forecast 2025-2030 ($ million)
Chart on Mexico - Year-over-year growth 2025-2030 (%)
Data Table on Mexico - Year-over-year growth 2025-2030 (%)

12.5 Europe - Market size and forecast 2025-2030

Chart on Europe - Market size and forecast 2025-2030 ($ million)
Data Table on Europe - Market size and forecast 2025-2030 ($ million)
Chart on Europe - Year-over-year growth 2025-2030 (%)
Data Table on Europe - Year-over-year growth 2025-2030 (%)
Chart on Regional Comparison - Europe
Data Table on Regional Comparison - Europe

12.5.1 Germany - Market size and forecast 2025-2030

Chart on Germany - Market size and forecast 2025-2030 ($ million)
Data Table on Germany - Market size and forecast 2025-2030 ($ million)
Chart on Germany - Year-over-year growth 2025-2030 (%)
Data Table on Germany - Year-over-year growth 2025-2030 (%)

12.5.2 France - Market size and forecast 2025-2030

Chart on France - Market size and forecast 2025-2030 ($ million)
Data Table on France - Market size and forecast 2025-2030 ($ million)
Chart on France - Year-over-year growth 2025-2030 (%)
Data Table on France - Year-over-year growth 2025-2030 (%)

12.5.3 UK - Market size and forecast 2025-2030

Chart on UK - Market size and forecast 2025-2030 ($ million)
Data Table on UK - Market size and forecast 2025-2030 ($ million)
Chart on UK - Year-over-year growth 2025-2030 (%)
Data Table on UK - Year-over-year growth 2025-2030 (%)

12.5.4 Italy - Market size and forecast 2025-2030

Chart on Italy - Market size and forecast 2025-2030 ($ million)
Data Table on Italy - Market size and forecast 2025-2030 ($ million)
Chart on Italy - Year-over-year growth 2025-2030 (%)
Data Table on Italy - Year-over-year growth 2025-2030 (%)

12.5.5 Spain - Market size and forecast 2025-2030

Chart on Spain - Market size and forecast 2025-2030 ($ million)
Data Table on Spain - Market size and forecast 2025-2030 ($ million)
Chart on Spain - Year-over-year growth 2025-2030 (%)
Data Table on Spain - Year-over-year growth 2025-2030 (%)

12.5.6 The Netherlands - Market size and forecast 2025-2030

Chart on The Netherlands - Market size and forecast 2025-2030 ($ million)
Data Table on The Netherlands - Market size and forecast 2025-2030 ($ million)
Chart on The Netherlands - Year-over-year growth 2025-2030 (%)
Data Table on The Netherlands - Year-over-year growth 2025-2030 (%)

12.6 Middle East and Africa - Market size and forecast 2025-2030

Chart on Middle East and Africa - Market size and forecast 2025-2030 ($ million)
Data Table on Middle East and Africa - Market size and forecast 2025-2030 ($ million)
Chart on Middle East and Africa - Year-over-year growth 2025-2030 (%)
Data Table on Middle East and Africa - Year-over-year growth 2025-2030 (%)
Chart on Regional Comparison - Middle East and Africa
Data Table on Regional Comparison - Middle East and Africa

12.6.1 Turkey - Market size and forecast 2025-2030

Chart on Turkey - Market size and forecast 2025-2030 ($ million)
Data Table on Turkey - Market size and forecast 2025-2030 ($ million)
Chart on Turkey - Year-over-year growth 2025-2030 (%)
Data Table on Turkey - Year-over-year growth 2025-2030 (%)

12.6.2 Saudi Arabia - Market size and forecast 2025-2030

Chart on Saudi Arabia - Market size and forecast 2025-2030 ($ million)
Data Table on Saudi Arabia - Market size and forecast 2025-2030 ($ million)
Chart on Saudi Arabia - Year-over-year growth 2025-2030 (%)
Data Table on Saudi Arabia - Year-over-year growth 2025-2030 (%)

12.6.3 UAE - Market size and forecast 2025-2030

Chart on UAE - Market size and forecast 2025-2030 ($ million)
Data Table on UAE - Market size and forecast 2025-2030 ($ million)
Chart on UAE - Year-over-year growth 2025-2030 (%)
Data Table on UAE - Year-over-year growth 2025-2030 (%)

12.6.4 South Africa - Market size and forecast 2025-2030

Chart on South Africa - Market size and forecast 2025-2030 ($ million)
Data Table on South Africa - Market size and forecast 2025-2030 ($ million)
Chart on South Africa - Year-over-year growth 2025-2030 (%)
Data Table on South Africa - Year-over-year growth 2025-2030 (%)

12.6.5 Israel - Market size and forecast 2025-2030

Chart on Israel - Market size and forecast 2025-2030 ($ million)
Data Table on Israel - Market size and forecast 2025-2030 ($ million)
Chart on Israel - Year-over-year growth 2025-2030 (%)
Data Table on Israel - Year-over-year growth 2025-2030 (%)

12.7 South America - Market size and forecast 2025-2030

Chart on South America - Market size and forecast 2025-2030 ($ million)
Data Table on South America - Market size and forecast 2025-2030 ($ million)
Chart on South America - Year-over-year growth 2025-2030 (%)
Data Table on South America - Year-over-year growth 2025-2030 (%)
Chart on Regional Comparison - South America
Data Table on Regional Comparison - South America

12.7.1 Brazil - Market size and forecast 2025-2030

Chart on Brazil - Market size and forecast 2025-2030 ($ million)
Data Table on Brazil - Market size and forecast 2025-2030 ($ million)
Chart on Brazil - Year-over-year growth 2025-2030 (%)
Data Table on Brazil - Year-over-year growth 2025-2030 (%)

12.7.2 Argentina - Market size and forecast 2025-2030

Chart on Argentina - Market size and forecast 2025-2030 ($ million)
Data Table on Argentina - Market size and forecast 2025-2030 ($ million)
Chart on Argentina - Year-over-year growth 2025-2030 (%)
Data Table on Argentina - Year-over-year growth 2025-2030 (%)

12.7.3 Colombia - Market size and forecast 2025-2030

Chart on Colombia - Market size and forecast 2025-2030 ($ million)
Data Table on Colombia - Market size and forecast 2025-2030 ($ million)
Chart on Colombia - Year-over-year growth 2025-2030 (%)
Data Table on Colombia - Year-over-year growth 2025-2030 (%)

12.8 Market opportunity by geography

Market opportunity by geography ($ million)
Data Tables on Market opportunity by geography ($ million)

13. Drivers, Challenges, and Opportunity

13.1 Market drivers

Surge in sustainable construction and mass timber adoption
Modernization and digital automation of sawmill operations
Expansion of remodeling activities and wooden furniture manufacturing

13.2 Market challenges

Prolonged macroeconomic volatility and downturns in residential construction cycles
Raw material supply limitations and climate-driven forest disturbances
Escalating trade protectionism, tariffs, and complex regulatory mandates

13.3 Impact of drivers and challenges

Impact of drivers and challenges in 2025 and 2030

13.4 Market opportunities

Regulatory due diligence and traceability across timber trade flows
Surge in industrial packaging and logistics dunnage consumption
Expanding utilization of thermally modified and preserved sawn lumber

14. Competitive Landscape

14.1 Overview

14.2

Overview on criticality of inputs and factors of differentiation

14.3 Landscape disruption

Overview on factors of disruption

14.4 Industry risks

Impact of key risks on business

15. Competitive Analysis

15.1 Companies profiled

Companies covered

15.2 Company ranking index

15.3 Market positioning of companies

Matrix on companies position and classification

15.4 Binderholz GmbH

Binderholz GmbH - Overview
Binderholz GmbH - Product / Service
Binderholz GmbH - Key offerings
SWOT

15.5 Canfor Corp.

Canfor Corp. - Overview
Canfor Corp. - Business segments
Canfor Corp. - Key offerings
Canfor Corp. - Segment focus
SWOT

15.6 Hampton Lumber

Hampton Lumber - Overview
Hampton Lumber - Product / Service
Hampton Lumber - Key offerings
SWOT

15.7 HS Timber Group

HS Timber Group - Overview
HS Timber Group - Product / Service
HS Timber Group - Key offerings
SWOT

15.8 Interfor Corp.

Interfor Corp. - Overview
Interfor Corp. - Product / Service
Interfor Corp. - Key offerings
SWOT

15.9 Metsa Group

Metsa Group - Overview
Metsa Group - Product / Service
Metsa Group - Key offerings
SWOT

15.10 Pfeifer Holding GmbH

Pfeifer Holding GmbH - Overview
Pfeifer Holding GmbH - Product / Service
Pfeifer Holding GmbH - Key offerings
SWOT

15.11 Sierra Pacific Industries

Sierra Pacific Industries - Overview
Sierra Pacific Industries - Product / Service
Sierra Pacific Industries - Key offerings
SWOT

15.12 Sodra

Sodra - Overview
Sodra - Product / Service
Sodra - Key offerings
SWOT

15.13 Stora Enso Oyj

Stora Enso Oyj - Overview
Stora Enso Oyj - Business segments
Stora Enso Oyj - Key news
Stora Enso Oyj - Key offerings
Stora Enso Oyj - Segment focus
SWOT

15.14 The SCA Group LLC

The SCA Group LLC - Overview
The SCA Group LLC - Business segments
The SCA Group LLC - Key offerings
The SCA Group LLC - Segment focus
SWOT

15.15 Tolko Industries Ltd.

Tolko Industries Ltd. - Overview
Tolko Industries Ltd. - Product / Service
Tolko Industries Ltd. - Key offerings
SWOT

15.16 UPM Timber

UPM Timber - Overview
UPM Timber - Product / Service
UPM Timber - Key offerings
SWOT

15.17 West Fraser Timber Co. Ltd.

West Fraser Timber Co. Ltd. - Overview
West Fraser Timber Co. Ltd. - Business segments
West Fraser Timber Co. Ltd. - Key offerings
West Fraser Timber Co. Ltd. - Segment focus
SWOT

15.18 Weyerhaeuser Co.

Weyerhaeuser Co. - Overview
Weyerhaeuser Co. - Business segments
Weyerhaeuser Co. - Key news
Weyerhaeuser Co. - Key offerings
Weyerhaeuser Co. - Segment focus
SWOT

16. Appendix

16.1 Scope of the report

Market definition
Objectives
Notes and caveats

16.2 Inclusions and exclusions checklist

Inclusions checklist
Exclusions checklist

16.3 Currency conversion rates for US$

16.4 Research methodology

16.5 Data procurement

Information sources

16.6 Data validation

16.7 Validation techniques employed for market sizing

16.8 Data synthesis

16.9 360 degree market analysis

16.10 List of abbreviations

Research Methodology

Technavio presents a detailed picture of the market by way of study, synthesis, and summation of data from multiple sources. The analysts have presented the various facets of the market with a particular focus on identifying the key industry influencers. The data thus presented is comprehensive, reliable, and the result of extensive research, both primary and secondary.

INFORMATION SOURCES

Primary sources

  • Manufacturers and suppliers
  • Channel partners
  • Industry experts
  • Strategic decision makers

Secondary sources

  • Industry journals and periodicals
  • Government data
  • Financial reports of key industry players
  • Historical data
  • Press releases

DATA ANALYSIS

Data Synthesis

  • Collation of data
  • Estimation of key figures
  • Analysis of derived insights

Data Validation

  • Triangulation with data models
  • Reference against proprietary databases
  • Corroboration with industry experts

REPORT WRITING

Qualitative

  • Market drivers
  • Market challenges
  • Market trends
  • Five forces analysis

Quantitative

  • Market size and forecast
  • Market segmentation
  • Geographical insights
  • Competitive landscape

Interested in this report?

Get your sample now to see our research methodology and insights!

Download Now

Frequently Asked Questions

Sawn Wood market growth will increase by USD 26449.1 million during 2026-2030.

The Sawn Wood market is expected to grow at a CAGR of 3.5% during 2026-2030.

Sawn Wood market is segmented by Type (Softwood, Hardwood) Application (Construction, Furniture and joinery, Packaging and pallets, Flooring and interior, Others) End-user (Residential, Industrial, Commercial)

Binderholz GmbH, Boise Cascade Co., Canfor Corp., Domtar Corp., Georgia Pacific LLC, Hampton Lumber, HS Timber Group, Idaho Forest Group LLC., Interfor Corp., Mayr Melnhof Holz Holding AG, Metsa Group, Pfeifer Holding GmbH, Sierra Pacific Industries, Sodra, Stora Enso Oyj, The SCA Group LLC, Tolko Industries Ltd., UPM Timber, West Fraser Timber Co. Ltd., Weyerhaeuser Co. are a few of the key vendors in the Sawn Wood market.

APAC will register the highest growth rate of 42.4% among the other regions. Therefore, the Sawn Wood market in APAC is expected to garner significant business opportunities for the vendors during the forecast period.

China, India, Japan, Indonesia, South Korea, Australia, US, Canada, Mexico, Germany, France, UK, Italy, Spain, The Netherlands, Turkey, Saudi Arabia, UAE, South Africa, Israel, Brazil, Argentina, Colombia

  • Surge in sustainable construction and mass timber adoption is the driving factor this market.

The Sawn Wood market vendors should focus on grabbing business opportunities from the Type segment as it accounted for the largest market share in the base year.
RIA - Research AI Assistant
Ask RIA
