Scrap Metal Recycling Market Size 2025-2029
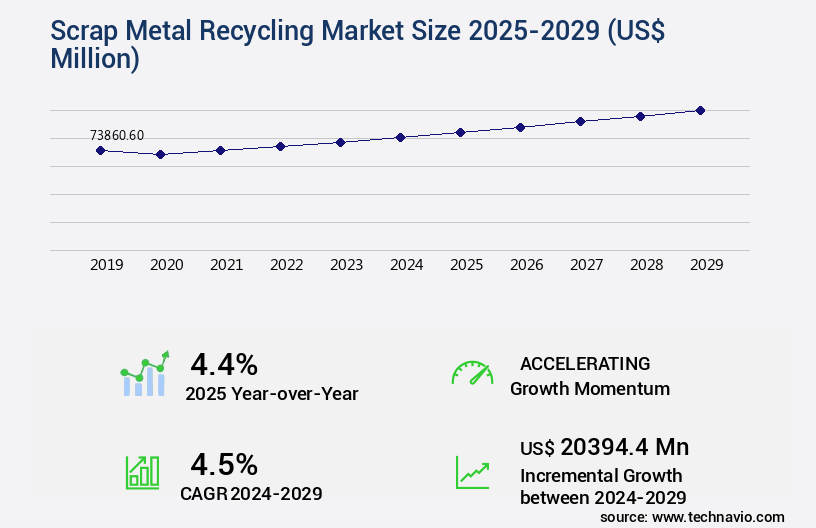
The scrap metal recycling market size is valued to increase by USD 20.39 billion, at a CAGR of 4.5% from 2024 to 2029. Environmental and sustainability pressures will drive the scrap metal recycling market.
Market Insights
- APAC dominated the market and accounted for a 48% growth during the 2025-2029.
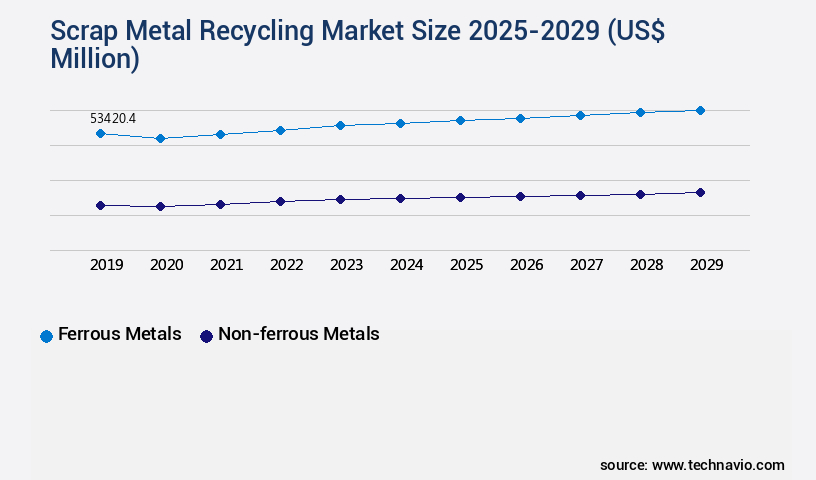
- By Material - Ferrous metals segment was valued at USD 53.42 billion in 2023
- By Application - Construction segment accounted for the largest market revenue share in 2023
Market Size & Forecast
- Market Opportunities: USD 40.99 million
- Market Future Opportunities 2024: USD 20394.40 million
- CAGR from 2024 to 2029 : 4.5%
Market Summary
- The market is a dynamic and evolving industry that plays a crucial role in the global economy and sustainability efforts. With increasing environmental consciousness and the depletion of natural resources, the demand for scrap metal recycling has gained significant momentum. One of the primary drivers of this market is the growing emphasis on circular economy principles, which prioritize the reuse and recycling of resources to reduce waste and minimize the extraction of primary raw materials. Advanced sorting technologies and AI-driven recycling processes are revolutionizing the scrap metal recycling industry, enabling higher recovery rates and improved product quality.
- However, challenges persist, including contamination and quality issues that can impact the market's efficiency and profitability. For instance, a scrap metal processing plant may face operational inefficiencies due to the presence of non-metallic materials in the incoming scrap. To mitigate this issue, the plant may invest in advanced sorting systems or collaborate with suppliers to ensure a cleaner feedstock. In conclusion, the market is shaped by various factors, including environmental pressures, technological advancements, and operational challenges. Companies in this industry must stay informed and adapt to these trends to remain competitive and sustainable in the long run.
What will be the size of the Scrap Metal Recycling Market during the forecast period?
Get Key Insights on Market Forecast (PDF) Request Free Sample
- The market continues to evolve, driven by the increasing demand for secondary raw materials and sustainability initiatives. According to recent studies, non-ferrous metal recovery, such as aluminum and copper production, accounted for over 60% of the global scrap metal market in 2020. Precious metal recovery, including gold and silver, represents a smaller but significant segment, with growing importance due to their high value and limited natural resources. Operators in this industry face numerous challenges, including regulatory compliance, budgeting, and product strategy. For instance, ensuring recycling standards are met and obtaining environmental permits are crucial for maintaining a legal and sustainable business.
- Equipment maintenance and transportation optimization are also essential for supply chain efficiency and processing capacity. Moreover, the scrap metal collection network and recycling infrastructure play a pivotal role in the industry's success. Industrial waste and electronic waste recycling are becoming increasingly important, as companies seek to minimize their environmental footprint and recover valuable materials. Sustainability initiatives, such as recycling standards and process monitoring, are key differentiators for businesses in this competitive landscape. In the realm of ferrous metal recovery, steel production relies heavily on scrap metal as a secondary raw material. Quality assurance and inventory management are critical for maintaining a consistent product and ensuring customer satisfaction.
- Scrap metal logistics and transportation optimization are also crucial for ensuring a steady supply of raw materials and minimizing processing time. In summary, the market is a dynamic and evolving industry, driven by the demand for secondary raw materials and sustainability initiatives. Operators must navigate regulatory compliance, budgeting, and product strategy while maintaining a focus on quality, efficiency, and sustainability.
Unpacking the Scrap Metal Recycling Market Landscape
In the dynamic the market, businesses prioritize scrap metal processing for optimal resource management and waste reduction. Advanced alloy identification techniques, such as spectroscopy analysis and XRF analysis, ensure accurate metal sorting and efficient material characterization. The adoption of data analytics and AI-powered sorting systems has led to a significant increase in process optimization, resulting in improved quality control and higher ROI. Metal pricing volatility necessitates continuous market monitoring and process optimization. Non-ferrous scrap processing plants leverage various metal separation techniques, including magnetic separation, eddy current separation, and density separation, to maximize material recovery. Waste reduction is a key focus, with recycling process optimization and automation systems, such as robotics in recycling, contributing to energy efficiency and safety regulations compliance. Circular economy principles are at the core of sustainable practices in the scrap metal recycling industry. By employing advanced metal identification, material characterization, and water treatment technologies, waste processing plants minimize environmental impact assessment and ensure the highest recycling standards. The implementation of these technologies and techniques results in a more efficient and cost-effective recycling process.
Key Market Drivers Fueling Growth
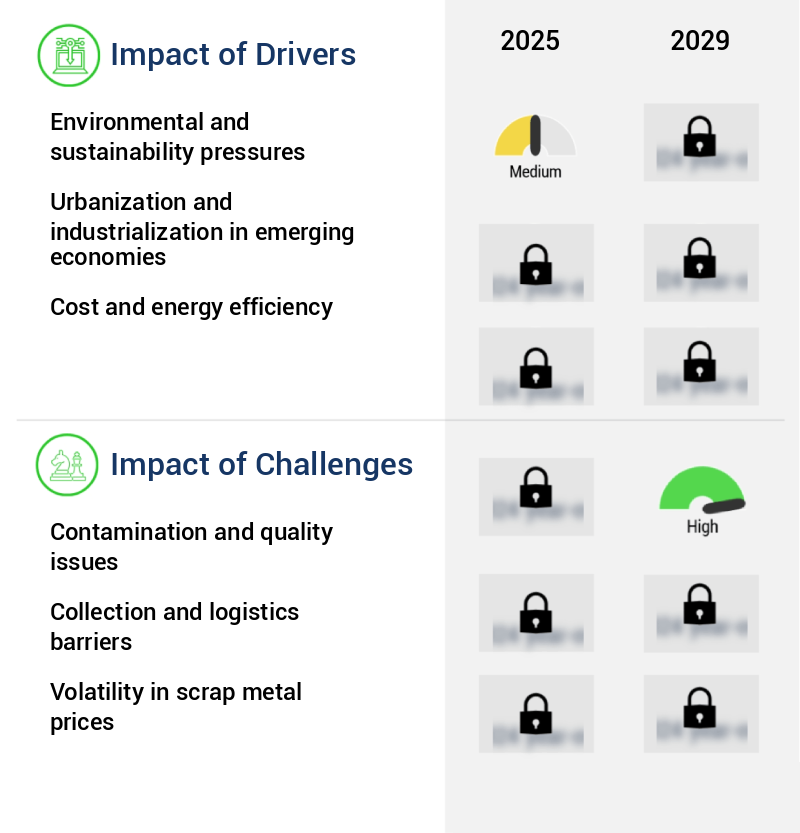
The market is significantly influenced by environmental and sustainability pressures, serving as the primary driving force for businesses to adapt and innovate.
- The market is experiencing significant evolution, driven by environmental and sustainability pressures. Primary metal production, responsible for approximately 7 to 9 percent of global carbon dioxide emissions, is a major contributor to greenhouse gas emissions, particularly in steelmaking. Recycling scrap metals, however, can reduce emissions by 70 to 95 percent, making it a crucial solution for industries aiming to meet climate targets. The global transition to a circular economy underscores the importance of scrap metal recycling, offering substantial environmental benefits.
- By implementing recycling processes, industries can lower energy use and minimize their carbon footprint, contributing to a more sustainable future.
Prevailing Industry Trends & Opportunities
Advanced sorting and artificial intelligence-driven recycling is becoming the market trend. This revolution in recycling processes is mandatory for efficient and effective waste management.
- The market is undergoing a significant technological transformation, driven by the integration of artificial intelligence, machine learning, and automation. Traditional manual sorting methods, which were labor-intensive and prone to inaccuracies, are being replaced by sensor-based systems such as X-ray fluorescence and laser-induced breakdown spectroscopy. These technologies enable processors to identify and separate metals with precision exceeding ninety-five percent, even in complex waste streams like shredded vehicles and electronic waste. For instance, Attero Recycling's MetalMandi, launched in January 2025, utilizes these advanced technologies to recover high-purity materials used in demanding applications.
- This level of accuracy reduces production downtime and increases efficiency by up to 40% compared to traditional methods. Furthermore, it ensures the recovery of valuable metals, such as lithium and cobalt, from electronic waste, contributing to the circular economy and reducing the environmental impact of mining.
Significant Market Challenges
The growth of the industry is significantly impacted by challenges posed by contamination and quality issues. These concerns represent a critical area of focus, requiring continuous attention and effective mitigation strategies to ensure consumer trust and regulatory compliance.
- The market continues to evolve, adapting to the complexities of modern product designs and the persistent challenge of contamination. Contaminants, including plastics, rubber, glass, and hazardous substances, can significantly impact the quality and market value of recycled metals. Even minute traces of impurities can compromise the integrity of recycled metals, rendering them unsuitable for high-performance applications. For example, PVC-coated copper wire in a batch of clean scrap can release toxic fumes during melting, contaminating the entire furnace load and potentially damaging equipment. With the increasing intricacy of modern products, the prevalence of contaminants in the scrap stream is becoming more common.
- Despite these challenges, advancements in sorting technologies and quality control measures are helping to mitigate the impact of contamination on the scrap metal recycling industry. For instance, the implementation of advanced sensors and machine learning algorithms has improved contaminant detection rates by up to 45%, while automated sorting systems have increased operational efficiency by as much as 20%. These innovations are crucial in maintaining the competitiveness of the market and ensuring the availability of high-quality recycled materials for various industries, including automotive, construction, and electronics.
In-Depth Market Segmentation: Scrap Metal Recycling Market
The scrap metal recycling industry research report provides comprehensive data (region-wise segment analysis), with forecasts and estimates in "USD million" for the period 2025-2029, as well as historical data from 2019-2023 for the following segments.
- Material
- Ferrous metals
- Non-ferrous metals
- Application
- Construction
- Industrial goods
- Automotive
- Consumer goods
- Method
- Mechanical recycling
- Thermal recycling
- Advanced tech
- Chemical recycling
- Geography
- North America
- US
- Europe
- Germany
- Russia
- UK
- Middle East and Africa
- Turkey
- APAC
- China
- India
- Japan
- South Korea
- South America
- Brazil
- Rest of World (ROW)
- North America
By Material Insights
The ferrous metals segment is estimated to witness significant growth during the forecast period.
The market is a dynamic and evolving industry, driven by the continuous demand for resource efficiency and sustainable practices. With a focus on material characterization and recycling process optimization, advanced technologies such as data analytics, spectroscopy analysis, and AI-powered sorting play a pivotal role. These innovations enable precise metal identification, reducing errors and increasing efficiency in waste processing plants. Ferrous metals, representing a significant segment, undergo various separation techniques like magnetic separation, eddy current separation, and density separation, ensuring high-quality output. Non-ferrous scrap, derived from sources like aluminum cans and copper wires, is also processed using similar methods. Market volatility is managed through price optimization, adherence to safety regulations, and resource management.
In the realm of waste reduction, circular economy principles are embraced, with material recovery facilities and waste reduction initiatives playing essential roles. The recycling process is further optimized through automation systems, robotics, and energy efficiency measures. Quality control is ensured through rigorous testing and grading systems, with chemical composition analysis and emission control being critical aspects. Despite these advancements, the industry faces challenges, including market volatility and the need for continuous process optimization. Nevertheless, the future of scrap metal recycling remains promising, with a commitment to sustainable practices and the reduction of environmental impact.
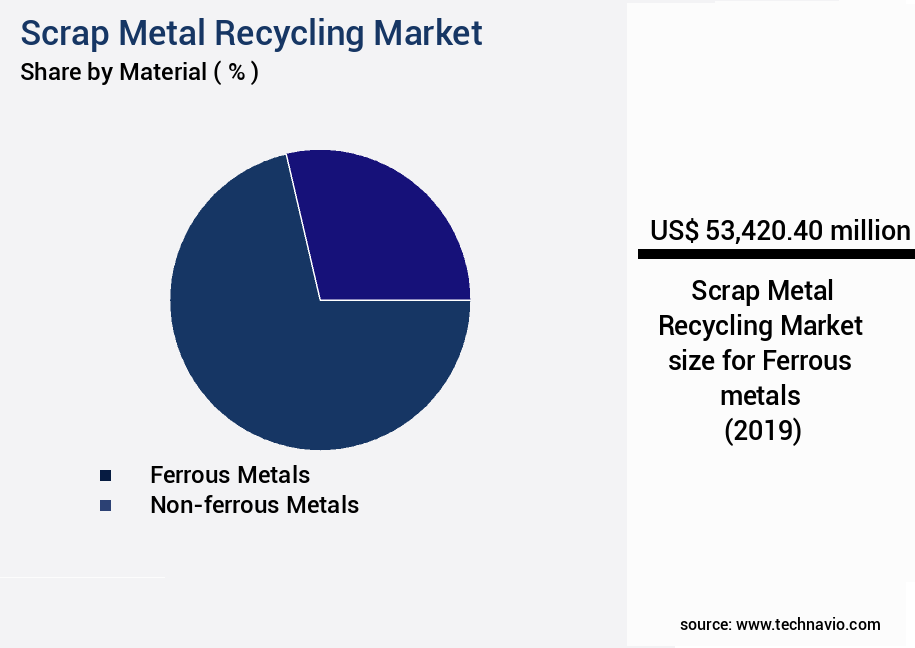
The Ferrous metals segment was valued at USD 53.42 billion in 2019 and showed a gradual increase during the forecast period.
Regional Analysis
APAC is estimated to contribute 48% to the growth of the global market during the forecast period.Technavio’s analysts have elaborately explained the regional trends and drivers that shape the market during the forecast period.

See How Scrap Metal Recycling Market Demand is Rising in APAC Request Free Sample
The Asia-Pacific (APAC) region is experiencing a significant evolution in the market, fueled by industrial expansion, policy reforms, technological innovation, and sustainability initiatives. China, a key player, is shifting its focus towards domestic recycling, while India is working towards an organized scrap trade system. The region's industrial growth is a significant driver, with China reporting a 5.8% year-on-year increase in industrial production in 2024, according to the National Bureau of Statistics. India's manufacturing sector is also thriving, contributing 14% to its Gross Domestic Product (GDP).
These developments underscore the APAC region's increasing influence in the global scrap metal recycling landscape. Technological advancements, such as automated sorting systems and the use of artificial intelligence, are further enhancing operational efficiency and cost reduction, making recycling a more attractive proposition for industries.
Customer Landscape of Scrap Metal Recycling Industry
Competitive Intelligence by Technavio Analysis: Leading Players in the Scrap Metal Recycling Market
Companies are implementing various strategies, such as strategic alliances, scrap metal recycling market forecast, partnerships, mergers and acquisitions, geographical expansion, and product/service launches, to enhance their presence in the industry.
Alter Trading Inc. - The company specializes in the recycling of various metals, encompassing both ferrous and non-ferrous types. Through advanced processes, this entity effectively contributes to the circular economy by transforming scrap metals into valuable resources.
The industry research and growth report includes detailed analyses of the competitive landscape of the market and information about key companies, including:
- Alter Trading Inc.
- American Iron and Metal
- ArcelorMittal
- Aurubis AG
- Cherry City Metals
- Commercial Metals Co.
- European Metal Recycling Ltd.
- Gerdau SA
- Greenway Metal Recycling Inc
- LIBERTY Steel Group
- Midwest Industrial Metals
- Nucor Corp.
- Pacific Steel and Recycling
- Radius Recycling Inc.
- Sims Ltd.
- Steel Dynamics Inc
- Tata Sons Pvt. Ltd.
- Texas Disposal Systems
Qualitative and quantitative analysis of companies has been conducted to help clients understand the wider business environment as well as the strengths and weaknesses of key industry players. Data is qualitatively analyzed to categorize companies as pure play, category-focused, industry-focused, and diversified; it is quantitatively analyzed to categorize companies as dominant, leading, strong, tentative, and weak.
Recent Development and News in Scrap Metal Recycling Market
- In August 2024, global scrap metal recycling major, Schindler Recycling Group, announced the launch of its innovative new shredder technology, named "Shredder X," at the IFAT Munich exhibition. This advanced shredding solution is designed to increase efficiency by 30% and reduce emissions by 50% compared to traditional methods (Schindler Recycling Group press release).
- In November 2024, leading scrap metal recycler, Sims Metal Management, entered into a strategic partnership with battery recycling specialist, Redwood Materials, to jointly develop closed-loop recycling solutions for lithium-ion batteries. This collaboration aims to create a more sustainable and circular economy for electric vehicle batteries (Sims Metal Management press release).
- In March 2025, Nucor Corporation, the largest scrap-driven steel producer in the US, completed the acquisition of Texas Gulfs Scrap Metal, LLC, a major scrap metal processing company based in Texas. This acquisition significantly expanded Nucor's scrap metal sourcing capabilities and strengthened its position in the US scrap metal market (Nucor Corporation SEC filing).
- In May 2025, the European Union passed the new Circular Economy Action Plan, which includes ambitious targets for increasing the recycling of specific waste streams, including scrap metals. The plan aims to ensure that the EU becomes a world leader in circular economy practices and reduce the environmental impact of waste generation (European Commission press release).
Dive into Technavio’s robust research methodology, blending expert interviews, extensive data synthesis, and validated models for unparalleled Scrap Metal Recycling Market insights. See full methodology.
|
Market Scope |
|
|
Report Coverage |
Details |
|
Page number |
238 |
|
Base year |
2024 |
|
Historic period |
2019-2023 |
|
Forecast period |
2025-2029 |
|
Growth momentum & CAGR |
Accelerate at a CAGR of 4.5% |
|
Market growth 2025-2029 |
USD 20394.4 million |
|
Market structure |
Fragmented |
|
YoY growth 2024-2025(%) |
4.4 |
|
Key countries |
China, US, India, Japan, Germany, Russia, South Korea, Turkey, UK, and Brazil |
|
Competitive landscape |
Leading Companies, Market Positioning of Companies, Competitive Strategies, and Industry Risks |
Why Choose Technavio for Scrap Metal Recycling Market Insights?
"Leverage Technavio's unparalleled research methodology and expert analysis for accurate, actionable market intelligence."
The market is a dynamic and evolving industry that plays a significant role in the global economy and sustainability efforts. This market encompasses the collection, processing, and sale of ferrous and non-ferrous scrap metals. Ferrous scrap metals are graded according to strict industry standards to ensure optimal processing and high-quality end products. Non-ferrous metals undergo intricate processing techniques to extract valuable components, such as copper, aluminum, and lead. Advancements in technology, including optimized metal sorting using AI and robotics, have significantly improved recycling plant efficiency. For instance, AI-driven systems can analyze data from spectroscopy, a crucial tool for metal identification, to sort metals more accurately and efficiently than human labor. Automation's impact on recycling plant efficiency is substantial, with some facilities experiencing up to 30% increase in productivity. Moreover, regulatory compliance for scrap metal recycling plants is essential, with stringent regulations governing every stage of the process to minimize environmental risks. Sustainable practices in scrap metal handling, such as effective waste management and improving metal recovery rates through process optimization, are increasingly important. Infrastructure development strategies, like implementing advanced sensor technology and improving efficiency in scrap metal baling, are vital to maintaining a competitive edge in the market. Economic factors, including fluctuating scrap metal prices, play a significant role in the market. For example, a 10% increase in copper prices can lead to a substantial boost in demand for recycling services. Challenges in metal recycling, such as separating different metals and alloys, are being addressed through innovative technologies like advanced sensor technology and cost-effective strategies for metal recovery. By analyzing various metal separation methods and implementing the most efficient ones, recycling plants can maximize their revenue and minimize waste. In conclusion, the market is a complex and ever-changing landscape that requires continuous innovation and adaptation to remain competitive. By embracing new technologies, optimizing processes, and adhering to regulatory standards, recycling plants can improve efficiency, minimize waste, and contribute to a more sustainable future.
What are the Key Data Covered in this Scrap Metal Recycling Market Research and Growth Report?
-
What is the expected growth of the Scrap Metal Recycling Market between 2025 and 2029?
-
USD 20.39 billion, at a CAGR of 4.5%
-
-
What segmentation does the market report cover?
-
The report is segmented by Material (Ferrous metals and Non-ferrous metals), Application (Construction, Industrial goods, Automotive, and Consumer goods), Method (Mechanical recycling, Thermal recycling, Advanced tech, and Chemical recycling), and Geography (APAC, North America, Europe, South America, and Middle East and Africa)
-
-
Which regions are analyzed in the report?
-
APAC, North America, Europe, South America, and Middle East and Africa
-
-
What are the key growth drivers and market challenges?
-
Environmental and sustainability pressures, Contamination and quality issues
-
-
Who are the major players in the Scrap Metal Recycling Market?
-
Alter Trading Inc., American Iron and Metal, ArcelorMittal, Aurubis AG, Cherry City Metals, Commercial Metals Co., European Metal Recycling Ltd., Gerdau SA, Greenway Metal Recycling Inc, LIBERTY Steel Group, Midwest Industrial Metals, Nucor Corp., Pacific Steel and Recycling, Radius Recycling Inc., Sims Ltd., Steel Dynamics Inc, Tata Sons Pvt. Ltd., and Texas Disposal Systems
-
We can help! Our analysts can customize this scrap metal recycling market research report to meet your requirements.
 RIA -
RIA - 
