
Security Brokerage And Stock Exchange Services Market Size 2025-2029
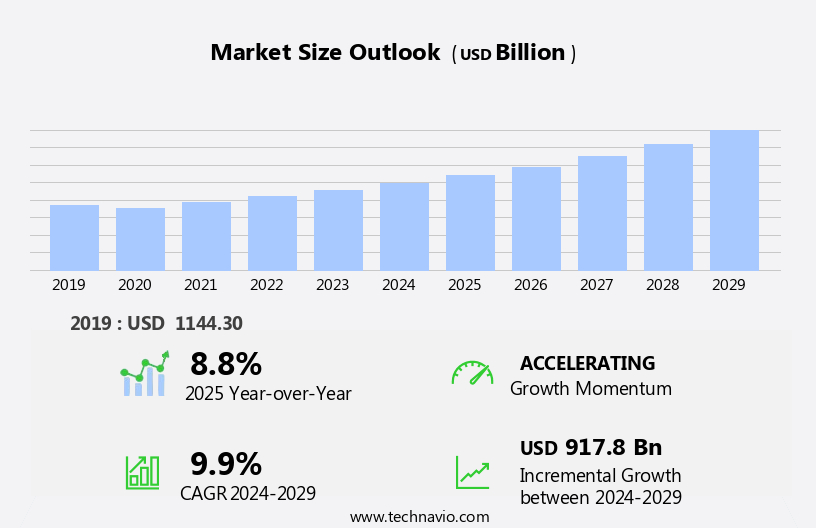
The security brokerage and stock exchange services market size is forecast to increase by USD 917.8 billion at a CAGR of 9.9% between 2024 and 2029.
- The market is experiencing significant growth, driven by the increasing demand for exchange-traded funds (ETFs) and the popularity of online trading platforms. These trends reflect the evolving preferences of investors, who seek convenience, cost-effectiveness, and diversification in their investment portfolios. Simultaneously, regulatory compliance with trading activities is on the rise, necessitating brokerage firms and stock exchanges to invest in advanced technologies and processes to ensure adherence. Data analytics and big data are also crucial tools for e-brokerage firms to gain insights and make informed decisions. These trends and challenges are shaping the future of the market. These factors present both opportunities and challenges for market participants. Companies that can effectively leverage technology to streamline operations, enhance customer experience, and comply with regulations will gain a competitive edge. Additionally, users of online trading platforms can easily monitor the performance of their assets thanks to real-time stock data.
- Conversely, those that fail to adapt may face operational inefficiencies and regulatory penalties, potentially impacting their market position and reputation. To capitalize on these opportunities and navigate challenges, market players must remain agile, innovative, and committed to delivering value to their customers.
What will be the Size of the Security Brokerage And Stock Exchange Services Market during the forecast period?
- The market encompasses a dynamic and intricate ecosystem of financial intermediaries facilitating the buying and selling of various securities, including equities, fixed income instruments, alternative investments, and digital assets. Market participants seek services such as commission rates and trading fees, account minimums, customer service, investment strategies, market insights, and personalized recommendations to optimize their portfolios. The market is witnessing significant growth due to the widespread use of smartphones and led technology, enabling investors to access real-time market data and trade securities such as ETFs and mutual funds from anywhere. Key trends include tax-efficient investing, estate planning, and the integration of advanced technologies like securities lending, prime brokerage, clearing and settlement, market making, order routing, and execution algorithms. Furthermore, the market is witnessing the emergence of innovative financial services, such as decentralized finance (DeFi), non-fungible tokens (NFTs), and digital assets, which are transforming traditional investment paradigms.
- Risk appetite, trading psychology, and behavioral finance play crucial roles in market sentiment, as investors navigate economic indicators, geopolitical risks, global markets, and emerging markets. Additionally, investment banking services, including debt financing, equity financing, corporate finance, financial reporting, corporate governance, and Environmental, Social, and Governance (ESG) investing, continue to be essential components of the market.
How is this Security Brokerage And Stock Exchange Services Industry segmented?
The security brokerage and stock exchange services industry research report provides comprehensive data (region-wise segment analysis), with forecasts and estimates in "USD billion" for the period 2025-2029, as well as historical data from 2019-2023 for the following segments.
- Channel
- Offline
- Online
- Type
- Derivatives and commodities brokerage
- Equities brokerage
- Bonds brokerage
- Stock exchanges
- Others
- Source
- Banks
- Investment firms
- Exclusive brokers
- Geography
- North America
- US
- Canada
- APAC
- China
- India
- Japan
- Singapore
- Europe
- France
- Germany
- Italy
- UK
- Middle East and Africa
- South America
- North America
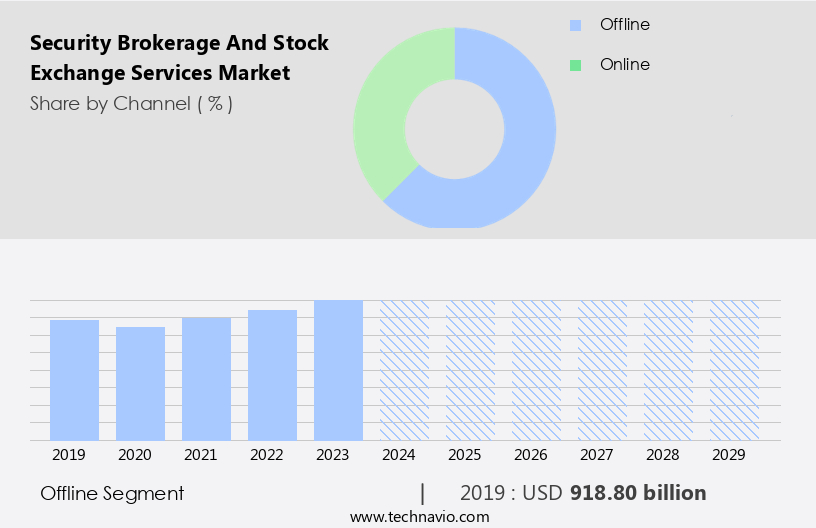
By Channel Insights
The offline segment is estimated to witness significant growth during the forecast period. Offline security brokerage and stock exchange services enable investors to collaborate with seasoned professionals, receiving customized advice based on their investment strategies and objectives. In this mode, investors can trade various securities, such as stocks, bonds, mutual funds, and more. One significant advantage of offline trading is the negotiation of security prices, which is not always feasible in online trading. This price negotiation can result in improved returns for investors, particularly those who benefit from the expertise of skilled brokers.
Get a glance at the market report of share of various segments Request Free Sample
The Offline segment was valued at USD 918.80 billion in 2019 and showed a gradual increase during the forecast period.
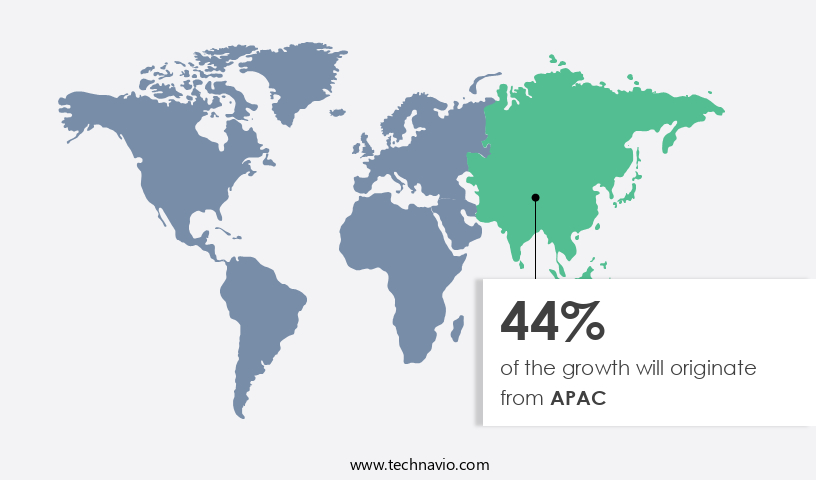
Regional Analysis
APAC is estimated to contribute 44% to the growth of the global market during the forecast period. Technavio's analysts have elaborately explained the regional trends and drivers that shape the market during the forecast period.
For more insights on the market size of various regions, Request Free Sample
The North American market is poised for substantial expansion due to the region's strong financial sector, advanced infrastructure, and skilled workforce. Notable stock exchanges, such as the New York Stock Exchange (NYSE) and NASDAQ, based in the US, are globally recognized for their significance in capital-raising activities for both domestic and international companies. Investors and businesses are drawn to the US due to its extensive securities trading offerings, including order execution, margin trading, short selling, options trading, futures trading, mutual funds, exchange-traded funds (ETFs), algorithmic trading, high-frequency trading, day trading, swing trading, value investing, and growth investing. These services cater to various investor profiles, from institutional investors and retail investors to high-net-worth individuals (HNWIs), family offices, pension funds, hedge funds, and endowment funds.
Market Dynamics
Our researchers analyzed the data with 2024 as the base year, along with the key drivers, trends, and challenges. A holistic analysis of drivers will help companies refine their marketing strategies to gain a competitive advantage.
What are the key market drivers leading to the rise in the adoption of Security Brokerage And Stock Exchange Services Industry?
- Increasing demand for ETFs is the key driver of the market. The market for Security Brokerage and Stock Exchange Services has experienced significant growth due to the increasing popularity of Exchange-Traded Funds (ETFs). ETFs offer numerous advantages to investors, including low fees, diversification, and flexibility. These benefits have made ETFs an attractive investment vehicle for both retail and institutional investors. One of the primary reasons for the growth of ETFs is their liquidity. Unlike mutual funds, which are priced at the end of the day, ETFs can be traded throughout the trading day. This feature provides investors with real-time access to the markets, enabling them to make quick trades or rebalance their portfolios promptly. The ease of buying and selling ETFs has contributed to their rising demand, making them an essential component of the market.
- The market's dynamics are influenced by factors such as market liquidity, market volatility, trading volume, and market capitalization. Financial technology (FinTech), blockchain technology, artificial intelligence (AI), and machine learning (ML) are driving innovation in the sector, with regulatory changes and compliance regulations shaping the market landscape. Cybersecurity threats and data privacy concerns are also critical issues that require attention. Investor education and financial literacy are essential for market participants, with research reports, market data, real-time quotes, charting tools, trading signals, and customer support playing crucial roles in informed decision-making. Account security and regulatory compliance are paramount for maintaining trust and confidence in the market.
What are the market trends shaping the Security Brokerage And Stock Exchange Services Industry?
- Increasing popularity of online trading platforms is the upcoming market trend. The market has witnessed significant growth due to the increasing popularity of online trading platforms. With the widespread availability of the internet and the increasing use of mobile devices, investors and traders now have the convenience and accessibility to buy and sell securities through digital channels. These platforms offer personalized and transparent trading experiences, enabling users to trade on their own terms. The ease of use, real-time data, and accessibility of online trading platforms have attracted a younger demographic of investors, contributing to the market's expansion.
- The market dynamics are driven by the growing demand for efficient and convenient trading solutions, increasing digitalization, and the need for real-time market data. Online trading platforms provide investors with the flexibility to manage their portfolios from anywhere, making them an essential tool for modern investors. Additionally, brokerages provide comprehensive research and analysis tools to aid investors in making informed investment decisions. These resources may include technical analysis, financial modeling, and access to company reports. Offline trading also offers a personal touch, allowing investors to build long-term relationships with their brokers and receive tailored recommendations.
What challenges does the Security Brokerage And Stock Exchange Services Industry face during its growth?
- Increase in regularity compliances with trading is a key challenge affecting the industry growth. The market is experiencing challenges due to the heightened regulatory compliance requirements. These regulations aim to maintain market integrity, transparency, and fairness, but they also impose significant costs on brokerage firms and stock exchanges. Electronic platforms and smartphones have transformed the way investors access and manage their portfolios, enabling real-time trading and monitoring of financial instruments. Compliance necessitates hiring additional staff, investing in new systems and technology, and ongoing training to keep employees updated on the latest regulations and procedures. The financial burden of these requirements can impact market growth. Despite these challenges, the market continues to evolve, driven by the need for secure and efficient trading platforms. Firms are adopting advanced technologies, such as artificial intelligence and machine learning, to streamline processes and reduce costs.
- The market's future outlook remains promising, with a focus on innovation and regulatory compliance. Financial technology (fintech) and emerging technologies, such as blockchain technology, artificial intelligence (AI), machine learning (ML), and big data analytics, are transforming the securities trading industry. Regulatory changes and compliance regulations are shaping the market landscape, with a growing emphasis on cybersecurity threats and data privacy. Advanced charting tools, artificial intelligence, machine learning, and big data analytics are increasingly integrated into these platforms to enhance the trading experience. Financial inclusion, investor education, and financial literacy are essential aspects of the securities trading industry. As the market continues to evolve, firms must adapt to meet the changing needs of their clients while navigating the complex regulatory environment. The securities trading industry's future success depends on its ability to balance innovation, risk management, and regulatory compliance.
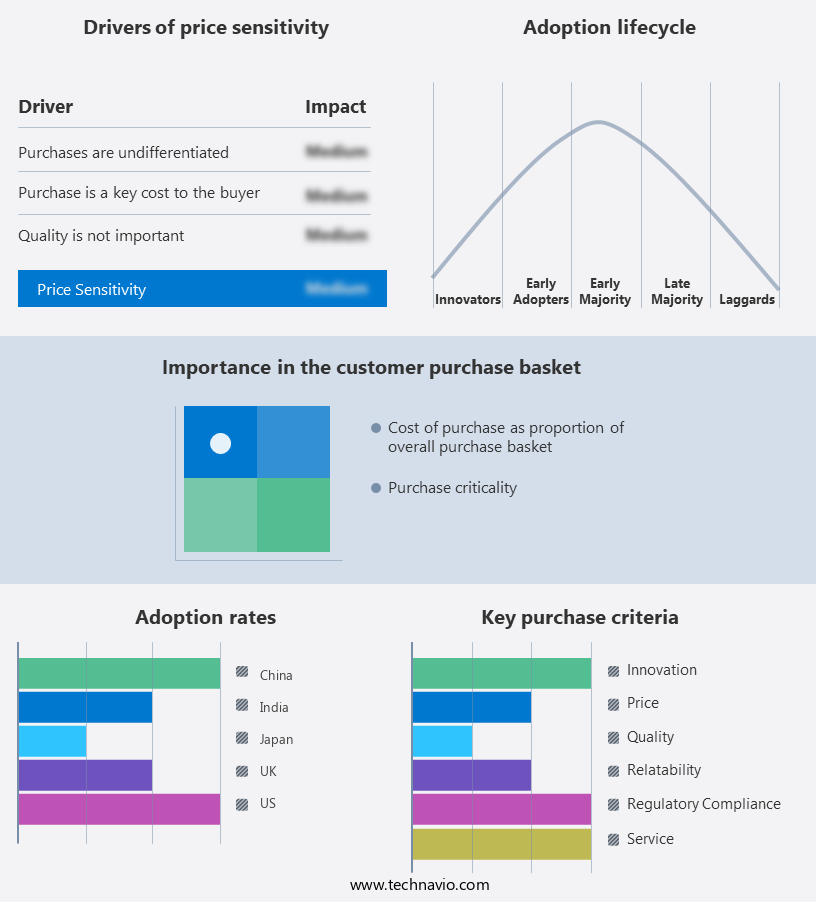
Exclusive Customer Landscape
The security brokerage and stock exchange services market forecasting report includes the adoption lifecycle of the market, covering from the innovator's stage to the laggard's stage. It focuses on adoption rates in different regions based on penetration. Furthermore, the security brokerage and stock exchange services market report also includes key purchase criteria and drivers of price sensitivity to help companies evaluate and develop their market growth analysis strategies.
Customer Landscape
Key Companies & Market Insights
Companies are implementing various strategies, such as strategic alliances, security brokerage and stock exchange services market forecast, partnerships, mergers and acquisitions, geographical expansion, and product/service launches, to enhance their presence in the industry.
Ameriprise Financial Inc. - The company specializes in securities brokerage and stock exchange services, facilitating transactions for various investment instruments including stocks, bonds, mutual funds, and exchange-traded funds.
The industry research and growth report includes detailed analyses of the competitive landscape of the market and information about key companies, including:
- Ameriprise Financial Inc.
- Bank of America Corp.
- Euronext N.V.
- Hong Kong Exchanges and Clearing Ltd.
- ICBC Co. Ltd.
- Intercontinental Exchange Inc.
- Japan Exchange Group Inc.
- JPMorgan Chase and Co.
- Kt Corp.
- Morgan Stanley
- National Stock Exchange of India Ltd.
- Raymond James Financial Inc.
- State Street Corp.
- StoneX Group Inc.
- Tadawul Group
- The Charles Schwab Corp.
- The Goldman Sachs Group Inc.
- The NorthWestern Mutual Life Insurance Co.
- The Vanguard Group Inc.
- TMX Group Ltd.
- Wells Fargo and Co.
Qualitative and quantitative analysis of companies has been conducted to help clients understand the wider business environment as well as the strengths and weaknesses of key industry players. Data is qualitatively analyzed to categorize companies as pure play, category-focused, industry-focused, and diversified; it is quantitatively analyzed to categorize companies as dominant, leading, strong, tentative, and weak.
Research Analyst Overview
The securities trading industry encompasses a vast landscape of financial services, with stock brokerage being a pivotal component. This sector facilitates the buying and selling of securities between buyers and sellers, acting as intermediaries in the process. The services offered within this realm include, but are not limited to, investment banking, order execution, margin trading, short selling, options trading, futures trading, mutual funds, exchange-traded funds (ETFs), algorithmic trading, high-frequency trading, day trading, swing trading, value investing, growth investing, technical analysis, fundamental analysis, portfolio management, asset allocation, risk management, financial planning, retirement planning, and wealth management. These firms utilize advanced technologies, including mobile apps, algorithmic trading, and real-time data, to deliver innovative and user-friendly trading experiences. Brokerage firms provide various types of accounts to cater to diverse investor needs.
These accounts include brokerage accounts, trading platforms, mobile trading, and online trading. Research reports, market data, real-time quotes, charting tools, trading signals, customer support, account security, and regulatory compliance are essential services offered by these firms to ensure a seamless trading experience. Institutional investors, retail investors, high-net-worth individuals (HNWIs), family offices, pension funds, hedge funds, and endowment funds are significant players in the securities trading market. Their investment strategies vary, with some focusing on equity markets, bond markets, and derivative markets. Securities exchanges and electronic trading platforms serve as crucial infrastructure for these investors, enabling market liquidity, market volatility, trading volume, and market capitalization.
|
Market Scope |
|
|
Report Coverage |
Details |
|
Page number |
228 |
|
Base year |
2024 |
|
Historic period |
2019-2023 |
|
Forecast period |
2025-2029 |
|
Growth momentum & CAGR |
Accelerate at a CAGR of 9.9% |
|
Market growth 2025-2029 |
USD 917.8 billion |
|
Market structure |
Fragmented |
|
YoY growth 2024-2025(%) |
8.8 |
|
Key countries |
US, China, Canada, UK, Japan, Germany, India, Singapore, France, and Italy |
|
Competitive landscape |
Leading Companies, Market Positioning of Companies, Competitive Strategies, and Industry Risks |
What are the Key Data Covered in this Security Brokerage And Stock Exchange Services Market Research and Growth Report?
- CAGR of the Security Brokerage And Stock Exchange Services industry during the forecast period
- Detailed information on factors that will drive the growth and forecasting between 2025 and 2029
- Precise estimation of the size of the market and its contribution of the industry in focus to the parent market
- Accurate predictions about upcoming growth and trends and changes in consumer behaviour
- Growth of the market across North America, APAC, Europe, Middle East and Africa, and South America
- Thorough analysis of the market's competitive landscape and detailed information about companies
- Comprehensive analysis of factors that will challenge the security brokerage and stock exchange services market growth of industry companies
We can help! Our analysts can customize this security brokerage and stock exchange services market research report to meet your requirements.
 RIA -
RIA - 
