Japan Semiconductor Device Market Size 2025-2029
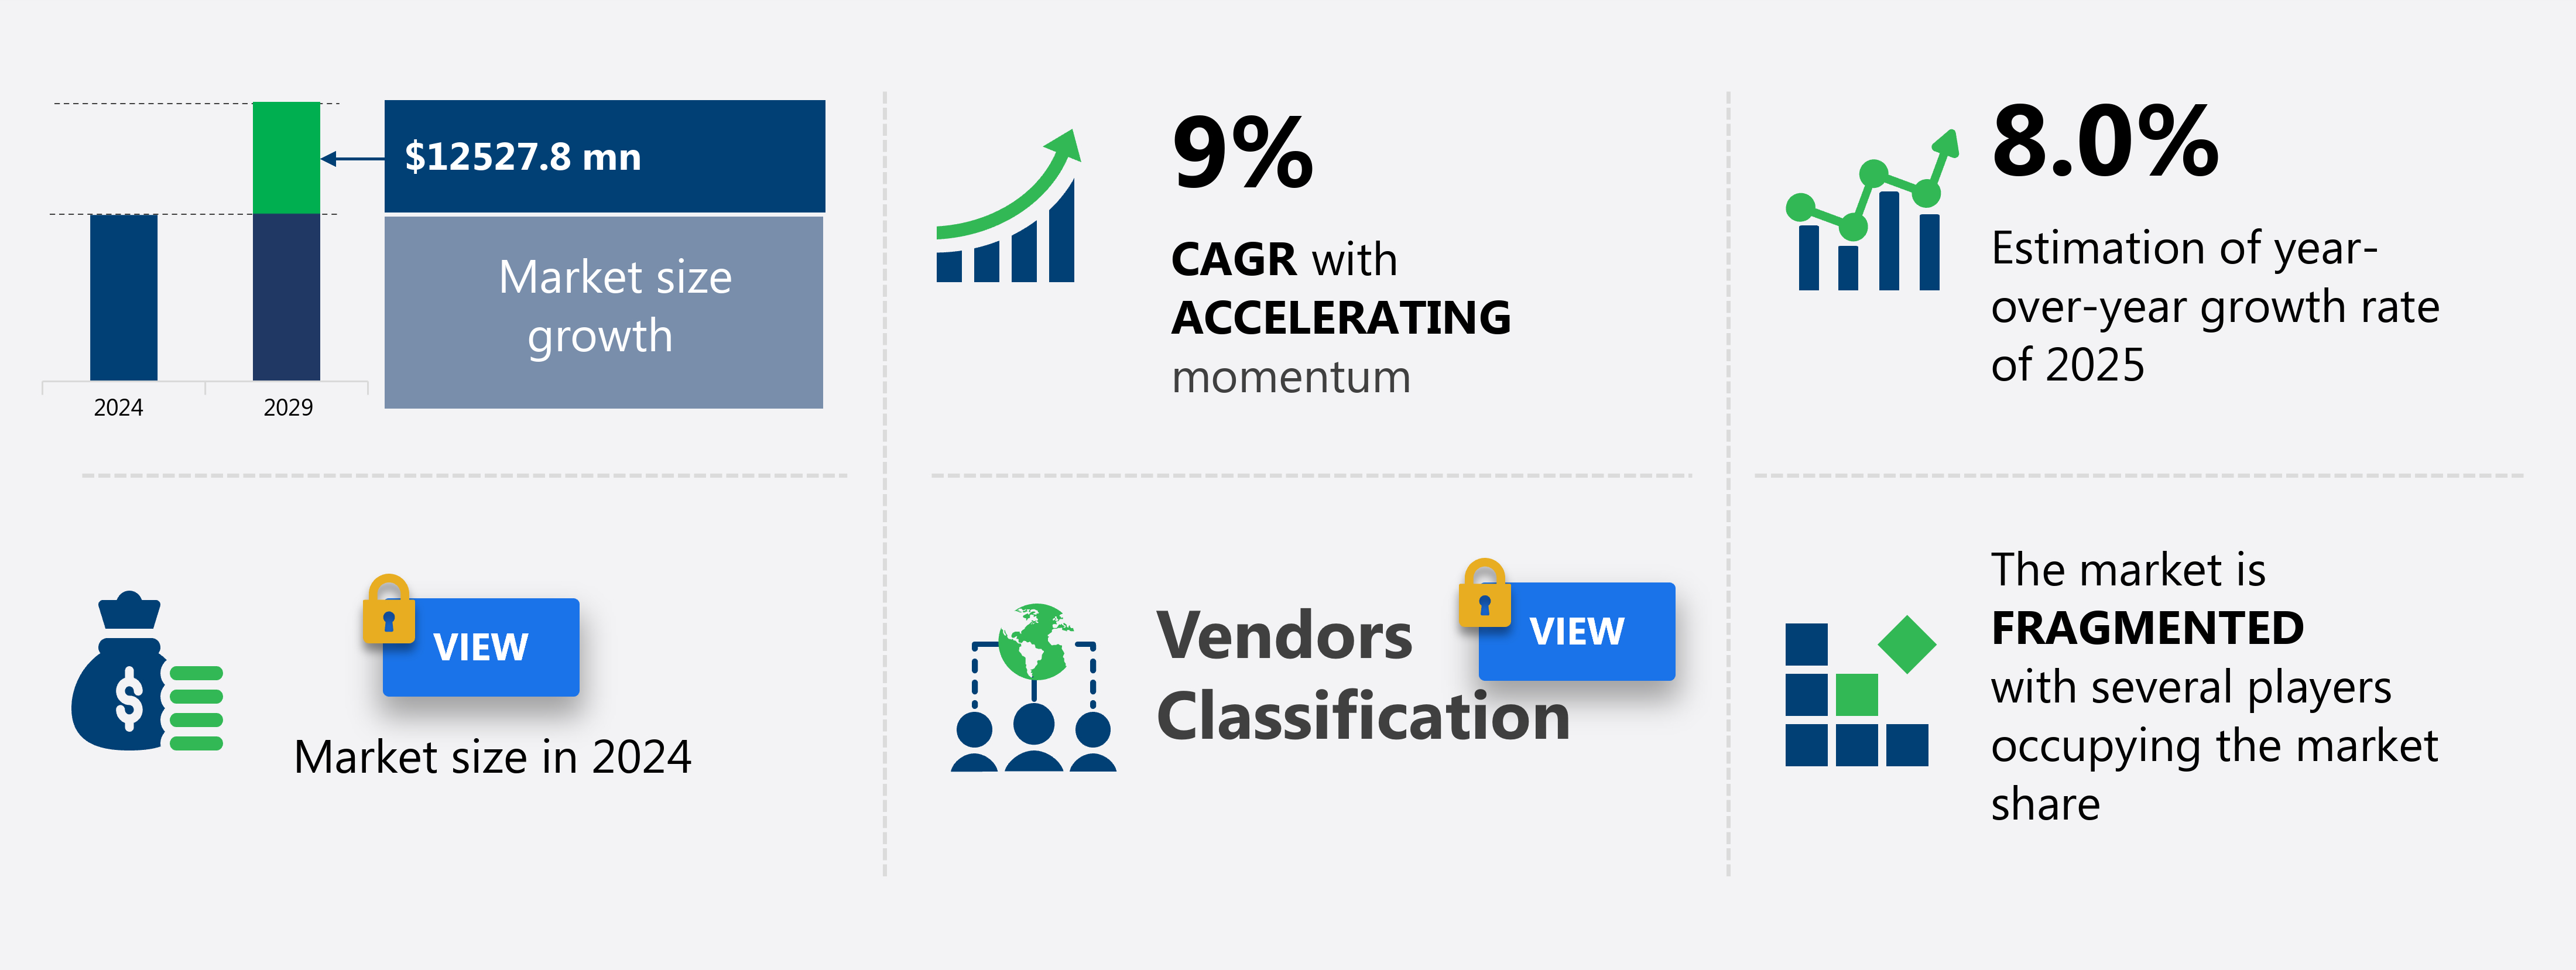
The semiconductor device market size in Japan is forecast to increase by USD 12.53 billion at a CAGR of 9% between 2024 and 2029.
-
The Japan semiconductor device market is experiencing significant growth, driven by the increasing demand for high-power density devices in various industries, including automotive, consumer electronics, and industrial automation. This trend is particularly evident in Japan, where substantial investments are being made in 5G technology, fueling the need for advanced semiconductor solutions. However, the high cost of semiconductor devices remains a challenge, as manufacturers strive to balance performance, power consumption, and affordability.
-
Navigating this complex market landscape requires a deep understanding of the underlying trends and dynamics. Our market trends and analysis report delves into these factors and more, providing valuable insights to help businesses make informed decisions and capitalize on the opportunities presented by the evolving semiconductor device market.
What will be the Size of the market During the Forecast Period?
-
The Japan semiconductor device market is experiencing dynamic shifts, driven by technological advancements and emerging applications. Carbon nanotubes and quantum dots are revolutionizing material science, enhancing the performance of advanced materials in semiconductor research. Cloud computing and high-performance computing are fueling the demand for chiplet technology and heterogeneous integration. Neuromorphic computing and quantum computing are transforming the landscape of artificial intelligence and data processing. Biomedical devices and wearable electronics are integrating semiconductor technology, driving growth in the healthcare sector. Intellectual property and patent litigation are becoming increasingly significant, shaping industry consortia and semiconductor standards. Edge computing and system integrators are enabling the deployment of smart homes and cities.
Autonomous vehicles and advanced packaging are pushing the boundaries of semiconductor innovation, while energy harvesting and solar cells are addressing sustainability concerns. Fabless semiconductor companies are thriving in the competitive landscape, focusing on niche markets and collaborating with OEMs. 3D integration and LED lighting are expanding the scope of semiconductor applications, while smart cities and smart homes are creating new opportunities for semiconductor technology. The semiconductor industry is continuously evolving, with innovation at its core.
How is this market segmented and which is the largest segment?
The market research report provides comprehensive data (region-wise segment analysis), with forecasts and estimates in "USD million" for the period 2025-2029, as well as historical data from 2019-2023 for the following segments.
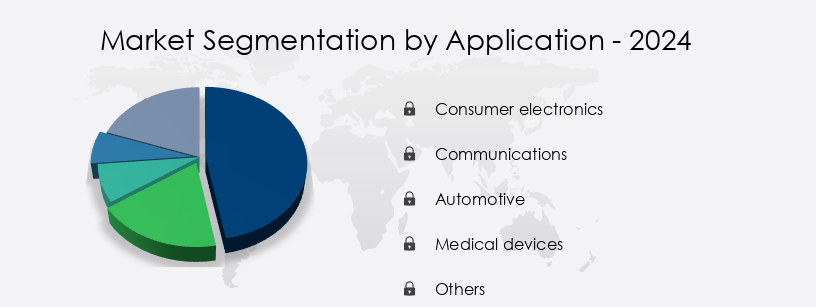
- Application
- Consumer electronics
- Communications
- Automotive
- Medical devices
- Others
- Device
- PMIC
- Microchips
- RFID
- Material
- Silicon
- Germanium
- Gallium arsenide
- Others
- Geography
- APAC
- Japan
- APAC
By Application Insights
- The consumer electronics segment is estimated to witness significant growth during the forecast period.
The market is driven by the consumer electronics sector's growing demand for energy-efficient devices. With the increasing adoption of smartphones, tablets, laptops, smart televisions, and gaming consoles, the need for semiconductor devices, particularly memory chips and power management ICs, is surging. GaAs components, essential for power amplifiers and switches in handsets, will experience heightened demand due to the global rise in smartphone shipments. The semiconductor industry is also focused on yield enhancement, design automation, and chip architecture innovation to meet the demands of data centers and industrial automation. Moore's law continues to push transistor density and process optimization, while machine learning and artificial intelligence applications fuel the need for digital signal processors, analog devices, and application-specific integrated circuits.
The semiconductor roadmap includes the development of advanced materials like gallium nitride and silicon carbide for power electronics and the integration of cleanroom technology and semiconductor manufacturing equipment into electronic design automation. The semiconductor industry's evolution is further shaped by the performance per watt and power consumption requirements of the Internet of Things and industrial automation. Wafer fabrication, foundry services, and field-programmable gate arrays are critical components of this dynamic market.
Get a glance at the market report of share of various segments Request Free Sample
Market Dynamics
Our Japan Semiconductor Device Market researchers analyzed the data with 2024 as the base year, along with the key drivers, trends, and challenges. A holistic analysis of drivers will help companies refine their marketing strategies to gain a competitive advantage.
What are the key market drivers leading to the rise in adoption of Japan Semiconductor Device Market?
- Increasing demand for high-power density devices is the key driver of the market. The semiconductor market is driven by the increasing demand for energy efficiency in various applications, particularly in high-power density devices. SiC and GaN power semiconductors, as wide-bandgap (WBG) solutions, are increasingly adopted due to their ability to operate at much higher temperatures, up to 500°C, compared to conventional Si semiconductors. This enhances the performance of high-power density devices, including electric and hybrid vehicles, international material data systems (IMDS), photovoltaic inverters, uninterruptible power supply (UPS) systems, and power supply systems. The performance of these devices is critical and is measured by factors such as low switching and conduction losses, high blocking voltage, high operating temperature, high switching frequency, and stable electrical characteristics over a wide temperature range.
-
Semiconductor shortages and supply chain disruptions have been a challenge for the consumer electronics industry, emphasizing the need for yield enhancement and design automation in the semiconductor industry. Memory chips and wafer fabrication continue to play a crucial role in the semiconductor market.
What are the market trends shaping the Japan Semiconductor Device Market?
- Growing investments in 5G technology in Japan is the upcoming trend in the market. The semiconductor market is experiencing significant growth due to the increasing demand for advanced technologies such as artificial intelligence (AI) and 5G networks. Silicon carbide, a high-performance semiconductor material, is gaining popularity for its ability to enhance power efficiency and reliability in various applications, including industrial automation and renewable energy. Integrated circuits, the backbone of modern electronics, continue to evolve with transistor density and process optimization being key areas of focus. Logic gates, the fundamental building blocks of digital circuits, are essential in the development of complex systems. The semiconductor roadmap is pushing the boundaries of cleanroom technology to achieve smaller feature sizes and higher performance.
-
Industrial automation, a critical sector, is set to benefit significantly from the integration of semiconductor technologies, enabling improved efficiency, accuracy, and safety. 5G networks, an upgrade from 4G, are revolutionizing the telecommunications industry. Japan, a global leader in technology, is investing heavily in this technology to drive Industry 4.0, a cyber-physical system that integrates the physical and digital worlds. The adoption of 5G technology will provide superior services and contribute to broader macroeconomic benefits. Telecommunication companies and businesses are investing in this technology to meet the growing consumer demand for faster download speeds and reduced response times. The market is undergoing a transformative period, driven by the adoption of advanced technologies such as AI, 5G networks, and silicon carbide. The focus on transistor density, process optimization, and cleanroom technology continues to push the boundaries of semiconductor innovation. The integration of these technologies in various sectors, including industrial automation, will lead to improved efficiency, accuracy, and safety. The future of the semiconductor market looks promising, with significant growth opportunities in the coming years.
What challenges doesJapan Semiconductor Device Market face during the growth?
- High cost of semiconductor devices is a key challenge affecting the market growth. Semiconductor devices, particularly power management ICs, field-programmable gate arrays, analog devices, digital signal processors, and chip design, are essential components in various industries. However, the high manufacturing cost of these devices, primarily due to the expensive substrate materials used, poses a significant challenge to their widespread adoption. SiC and GaN power semiconductor devices, for instance, can cost up to five times more than Si devices due to the high material and substrate costs. The cost of a 125 mm Si wafer is as low as USD 19.02, whereas the cost of a 100 mm SiC wafer can exceed USD 2,000, and a 100 mm GaN wafer costs approximately USD 1,800.
-
The substrate material used in SiC power semiconductor devices accounts for more than 30% of the total cost, compared to only 7% in Si semiconductor devices. The high cost of semiconductor devices can be mitigated by advancements in chip architecture, machine learning, and the use of alternative materials like gallium nitride. These innovations can lead to more efficient and cost-effective semiconductor devices.
Exclusive Customer Landscape
The market forecasting report includes the adoption lifecycle of the market, covering from the innovator's stage to the laggard's stage. It focuses on adoption rates in different regions based on penetration. Furthermore, the market report also includes key purchase criteria and drivers of price sensitivity to help companies evaluate and develop their market growth analysis strategies.

Customer Landscape
Key Companies & Market Insights
Companies are implementing various strategies, such as strategic alliances, market forecast , partnerships, mergers and acquisitions, geographical expansion, and product/service launches, to enhance their presence in the market.
Advanced Micro Devices Inc. - The company offers semiconductor devices such as a comprehensive multi-node lineup of FPGAs providing advanced features, namely, low-power, high-performance, and high-value chips for industrial and military purposes.
The market research and growth report includes detailed analyses of the competitive landscape of the market and information about key companies, including:
- Advanced Micro Devices Inc.
- AOI ELECTRONICS CO.LTD.
- Infineon Technologies AG
- Intel Corp.
- Kyocera Corp.
- Micron Technology Inc.
- Mitsubishi Electric Corp.
- NVIDIA Corp.
- NXP Semiconductors NV
- Qualcomm Inc.
- Renesas Electronics Corp.
- ROHM Co. Ltd.
- Samsung Electronics Co. Ltd.
- Screen Holdings Co. Ltd
- Shindengen Electric Manufacturing Co. Ltd.
- STMicroelectronics NV
- Sumitomo Corp.
- Toshiba Corp.
Qualitative and quantitative analysis of companies has been conducted to help clients understand the wider business environment as well as the strengths and weaknesses of key market players. Data is qualitatively analyzed to categorize companies as pure play, category-focused, industry-focused, and diversified; it is quantitatively analyzed to categorize companies as dominant, leading, strong, tentative, and weak.
Research Analyst Overview
The Japan semiconductor device market continues to evolve, driven by the relentless pursuit of energy efficiency and the increasing demand for advanced technologies in various sectors. Supply chain disruptions and semiconductor shortages persist, fueling competition among players in the industry. Data centers are at the forefront of this evolution, requiring high-performance chips and power management ICs to meet growing demand. In the consumer electronics sector, yield enhancement and design automation are crucial for maintaining competitiveness. Memory chips, including field-programmable gate arrays and application-specific integrated circuits, are essential components in these devices. Wafer fabrication and foundry services are integral to the production of these chips, with process optimization and transistor density playing key roles in advancing Moore's Law.
Power consumption remains a significant challenge, leading to the development of new materials such as gallium nitride and silicon carbide for power electronics. Machine learning and artificial intelligence are also driving innovation in chip architecture and digital signal processors. Integrated circuits and logic gates continue to be the building blocks of these advanced technologies, with cleanroom technology and semiconductor manufacturing equipment enabling their production. The semiconductor roadmap is continually evolving, with performance per watt and process node advancements shaping the industry's future. Industrial automation and the Internet of Things are also expanding the market's reach, creating new opportunities for players in this dynamic and innovative sector.
|
Market Scope |
|
|
Report Coverage |
Details |
|
Page number |
176 |
|
Base year |
2024 |
|
Historic period |
2019-2023 |
|
Forecast period |
2025-2029 |
|
Growth momentum & CAGR |
Accelerate at a CAGR of 9% |
|
Market growth 2025-2029 |
USD 12.52 Billion |
|
Market structure |
Fragmented |
|
YoY growth 2024-2025(%) |
8.0 |
|
Key countries |
Japan |
|
Competitive landscape |
Leading Companies, Market Positioning of Companies, Competitive Strategies, and Industry Risks |
What are the Key Data Covered in this Market Research and Growth Report?
- CAGR of the market during the forecast period
- Detailed information on factors that will drive the market growth and forecasting between 2025 and 2029
- Precise estimation of the size of the market and its contribution of the market in focus to the parent market
- Accurate predictions about upcoming market growth and trends and changes in consumer behaviour
- Growth of the market across Japan
- Thorough analysis of the market's competitive landscape and detailed information about companies
- Comprehensive analysis of factors that will challenge the growth of market companies
We can help! Our analysts can customize this market research report to meet your requirements. Get in touch
 RIA -
RIA - 
