Sensors In Oil And Gas Market Analysis APAC, North America, Europe, Middle East and Africa, South America - US, China, Japan, Germany, UK, India, Canada, France, Brazil, Spain - Size and Forecast 2025-2029

Sensors In Oil And Gas Market Analysis APAC, North America, Europe, Middle East and Africa, South America - US, China, Japan, Germany, UK, India, Canada, France, Brazil, Spain - Size and Forecast 2025-2029

Published: Dec 2024 166 Pages SKU: IRTNTR72275

Market Overview at a Glance

$1.59 B
Market Opportunity
3.6%
CAGR
3.4
YoY growth 2024-2025(%)

Sensors In Oil And Gas Market Size 2025-2029

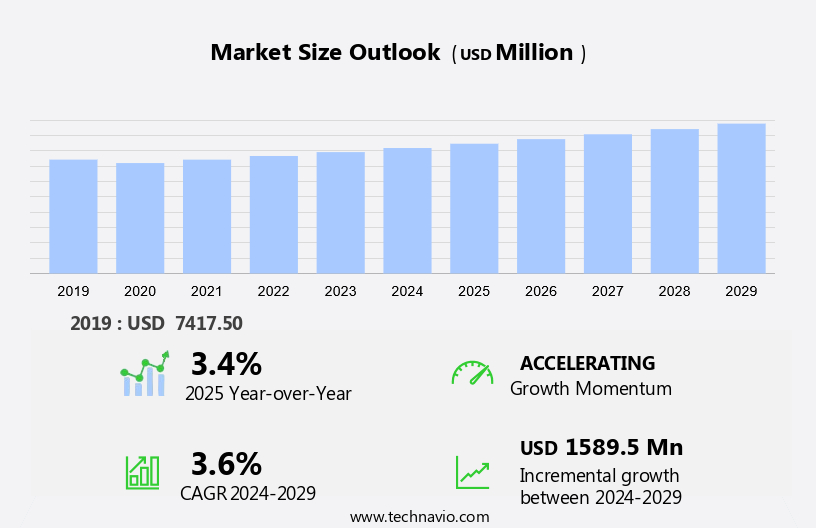
The sensors in oil and gas market size is forecast to increase by USD 1.59 billion, at a CAGR of 3.6% between 2024 and 2029.

  • The market is experiencing significant growth, driven by the increasing adoption of Internet of Things (IoT) products in the industry. The integration of IoT sensors enables real-time monitoring and predictive maintenance, enhancing operational efficiency and safety. However, this market faces challenges, primarily price volatility in the oil and gas industry. This instability impacts the investment decisions of companies, making it essential to maintain a flexible business strategy. Another challenge is the increasing adoption of sensors in LNG trade, intensifying competition and necessitating continuous innovation to stay competitive.
  • Companies in this market must navigate these challenges by focusing on cost optimization, technological innovation, and strategic partnerships to capitalize on the growth opportunities presented by the increasing use of IoT in the oil and gas sector.

What will be the Size of the Sensors In Oil And Gas Market during the forecast period?

Sensors In Oil And Gas Market Size

Explore in-depth regional segment analysis with market size data - historical 2019-2023 and forecasts 2025-2029 - in the full report.  
Request Free Sample

In the dynamic and evolving oil and gas market, sensors play a crucial role in production optimization and asset management. Data acquisition systems integrate various sensors, including pressure sensors, flow meters, temperature sensors, and gas detection sensors, to collect valuable data in real-time. This data is then subjected to rigorous sensor calibration, testing, and validation to ensure accuracy and reliability. Sensor interoperability and standardization are essential for seamless integration into SCADA systems and other data analytics platforms. Machine learning and deep learning algorithms enable advanced data analysis, providing insights for process control and safety and security measures. Cloud computing facilitates remote monitoring and real-time data access, enabling efficient asset management and predictive maintenance.

Vibration sensors, acoustic emission sensors, and wireless sensor networks contribute to corrosion monitoring, leak detection, and well integrity assessments. The oil and gas industry's ongoing commitment to safety and environmental stewardship drives the adoption of advanced sensor technologies for pipeline monitoring, reservoir management, and downhole sensors. Sensor certification and standardization ensure compliance with industry regulations and best practices. Sensor lifespan, sensor installation, and maintenance are critical factors in optimizing the overall performance and cost-effectiveness of these systems. Continuous innovation in sensor technology and applications across drilling operations, completion operations, and production operations ensures the industry remains at the forefront of technological advancements.

How is this Sensors In Oil And Gas Industry segmented?

The sensors in oil and gas industry research report provides comprehensive data (region-wise segment analysis), with forecasts and estimates in "USD million" for the period 2025-2029, as well as historical data from 2019-2023 for the following segments.

  • Type
    • Wired
    • Wireless
  • Geography
    • North America
      • US
      • Canada
    • Europe
      • France
      • Germany
      • Spain
      • UK
    • APAC
      • China
      • India
      • Japan
    • South America
      • Brazil
    • Rest of World (ROW)

    By Type Insights

    The wired segment is estimated to witness significant growth during the forecast period.

    The sensors market in the oil and gas industry is witnessing significant growth due to the increasing focus on production optimization and asset management. Data acquisition systems are integral to this market, with sensors playing a crucial role in collecting accurate data for analysis. Leak detection and corrosion monitoring are key applications, ensuring safety and security, while process control relies on sensor reliability and interoperability. Pressure sensors and flow meters are essential for monitoring and controlling fluid flow, with sensor accuracy a critical factor. Gas detection sensors are vital for detecting leaks and maintaining wellhead pressure.

    Real-time monitoring and sensor integration are important for drilling operations, sensor validation, and completion operations. Big data and machine learning are transforming the industry, with cloud computing enabling remote monitoring and data analytics. Sensor maintenance and calibration are essential for ensuring sensor lifespan and performance. Wireless sensor networks offer flexibility, but wired sensors remain preferred in certain applications due to their high reliability and accuracy. Sensor standardization and certification are essential for ensuring compatibility and interoperability. Downhole sensors provide valuable insights into reservoir management and well integrity. Temperature sensors and vibration sensors are crucial for monitoring equipment performance and detecting anomalies.

    Corrosion monitoring is essential for maintaining pipeline integrity and preventing costly downtime. Safety and security are paramount, with sensors playing a vital role in detecting potential hazards and ensuring compliance. SCADA systems and production operations rely on sensors for real-time data, enabling proactive maintenance and optimization. In conclusion, the sensors market in the oil and gas industry is evolving, driven by the need for accurate data and efficient operations. From drilling to refining, sensors are essential for monitoring and controlling various processes, ensuring safety, efficiency, and profitability.

    Sensors In Oil And Gas Market Size

    Request Free Sample

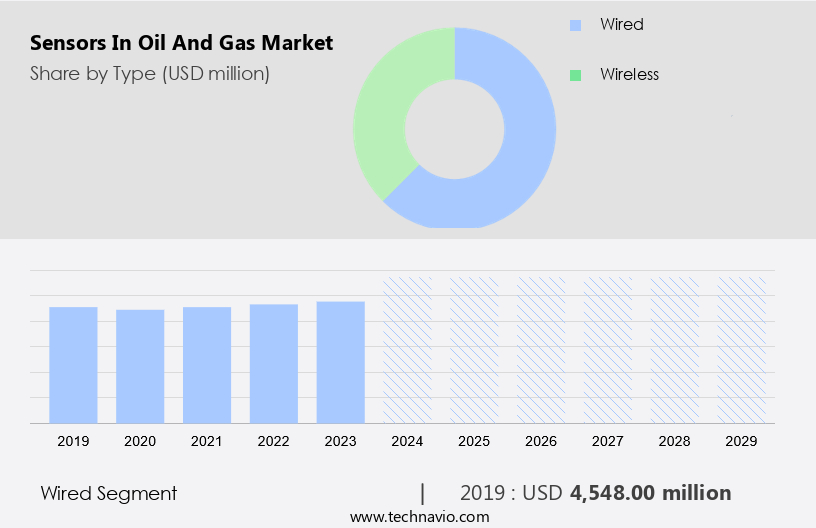
    The Wired segment was valued at USD 4.55 billion in 2019 and showed a gradual increase during the forecast period.

    Regional Analysis

    APAC is estimated to contribute 38% to the growth of the global market during the forecast period.Technavio’s analysts have elaborately explained the regional trends and drivers that shape the market during the forecast period.

    Sensors In Oil And Gas Market Share by Geography

     Request Free Sample

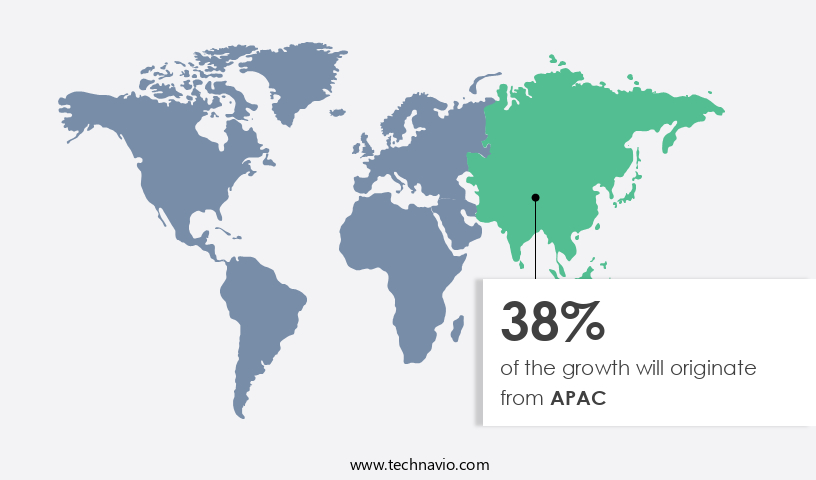
    In the oil and gas industry, sensors play a crucial role in optimizing production and managing assets. The market for sensors in this sector is witnessing significant growth, particularly in the Asia-Pacific (APAC) region. Driven by the increasing adoption of industrial automation in countries like India and China, APAC is leading the global market. The demand for consumer goods and transportation fuel in the region has resulted in increased investments in refineries. Countries such as China, India, Vietnam, Indonesia, and Malaysia are planning or constructing refinery projects. Data acquisition systems, including pressure sensors, flow meters, temperature sensors, and gas detection sensors, are integral to production optimization and process control.

    Leak detection and corrosion monitoring sensors ensure safety and security. Sensor calibration, testing, and integration are essential for maintaining accuracy and reliability. Real-time monitoring, machine learning, and artificial intelligence are revolutionizing data analytics. Sensor interoperability, standardization, and certification are critical for seamless integration into SCADA systems and wireless sensor networks. Downhole sensors and wellhead sensors provide valuable data for reservoir management and completion operations. Vibration sensors and acoustic emission sensors are essential for monitoring pipeline integrity and drilling operations. Cloud computing and big data are transforming the industry by enabling remote monitoring, environmental monitoring, and sensor maintenance. Data security is a growing concern, with machine learning and deep learning algorithms used for sensor validation and anomaly detection.

    Sensor lifespan and sensor installation are essential considerations for cost-effective and efficient operations.

    Market Dynamics

    Our researchers analyzed the data with 2024 as the base year, along with the key drivers, trends, and challenges. A holistic analysis of drivers will help companies refine their marketing strategies to gain a competitive advantage.

    What are the key market drivers leading to the rise in the adoption of Sensors In Oil And Gas Industry?

    • The LNG (Liquified Natural Gas) trade sector is experiencing significant growth and serves as the primary catalyst for market expansion. 

    • The Sensors market in the Oil and Gas industry is witnessing significant growth due to the increasing demand for real-time monitoring during completion operations and production processes. The integration of advanced technologies like Artificial Intelligence (AI) and SCADA systems is driving the market's growth. Temperature sensors and acoustic emission sensors are widely used for monitoring the operational parameters of oil and gas wells. Sensor certification is crucial to ensure accuracy and reliability, especially in harsh environmental conditions. Moreover, remote monitoring and environmental monitoring are essential for reservoir management and efficient production. The market's dynamics are influenced by several factors, including the need for sensor maintenance and the increasing focus on automation.
    • The Oil and Gas industry's shift towards digitalization and the integration of advanced technologies are expected to create new opportunities for sensor manufacturers. In conclusion, the Oil and Gas Sensors market's growth is driven by the need for real-time monitoring, increasing demand for clean energy, and the integration of advanced technologies. The market's dynamics are influenced by factors like sensor maintenance, environmental monitoring, and automation. Proper certification and calibration of sensors are crucial to ensure their accuracy and reliability. The market's future looks promising, with several opportunities for growth in the coming years.

    What are the market trends shaping the Sensors In Oil And Gas Industry?

    • The IoT market is experiencing significant growth as more businesses and consumers adopt Internet of Things products. This trend is expected to continue, making the IoT sector an increasingly important and dynamic industry.

    • In the oil and gas sector, IoT-enabled sensors play a crucial role in ensuring operational efficiency and safety. These sensors, which primarily measure pressure, level, flow, and temperature, are essential for applications such as remote monitoring, condition monitoring, and analysis and simulation. With the growing adoption of unconventional drilling techniques, the demand for liquid-level sensors is particularly high in the upstream industry. According to the US Bureau of Labor Statistics, accidents during drilling and exploration activities accounted for approximately 40% of all work-related fatalities in the country. Consequently, the demand for reliable and accurate sensors to prevent such incidents is increasing.
    • Furthermore, advancements in technologies such as cloud computing, machine learning (ML), and deep learning enable real-time data analysis and predictive maintenance, enhancing the overall performance of the sensors. Corrosion sensors and wellhead sensors are other types of sensors gaining popularity due to their ability to monitor pipeline conditions and prevent leaks. Data security is a significant concern in the oil and gas industry, and the integration of sensors with ML and deep learning algorithms can help ensure data privacy and integrity.

    What challenges does the Sensors In Oil And Gas Industry face during its growth?

    • The oil and gas industry faces significant growth challenges due to the volatile pricing trend, which is a prominent issue in this sector. 

    • The oil and gas industry's price volatility poses a significant challenge to the global sensors market. Fluctuating oil prices can disrupt investment plans, leading to delays or cancellations of sensor deployment projects. For instance, when oil prices decrease, oil companies may reduce exploration and production activities, subsequently decreasing the demand for sensors used in these operations. Conversely, when prices surge, there is a rush to ramp up production, which can strain the sensor supply chain and technology availability. This volatility also impacts the financial stability of oil and gas companies, making it challenging for them to commit to long-term investments in advanced sensor technologies.
    • Production optimization and asset management are crucial applications of sensors in the oil and gas industry. Data acquisition systems, including pressure sensors, flow meters, and gas detection sensors, play a vital role in these applications. Sensor calibration, testing, and integration are essential to ensure sensor accuracy and reliability. Data analytics enables oil and gas companies to make informed decisions based on real-time data from these sensors. Despite the challenges, the market for sensors in the oil and gas industry is expected to grow due to the increasing demand for improved operational efficiency and safety.

    Exclusive Customer Landscape

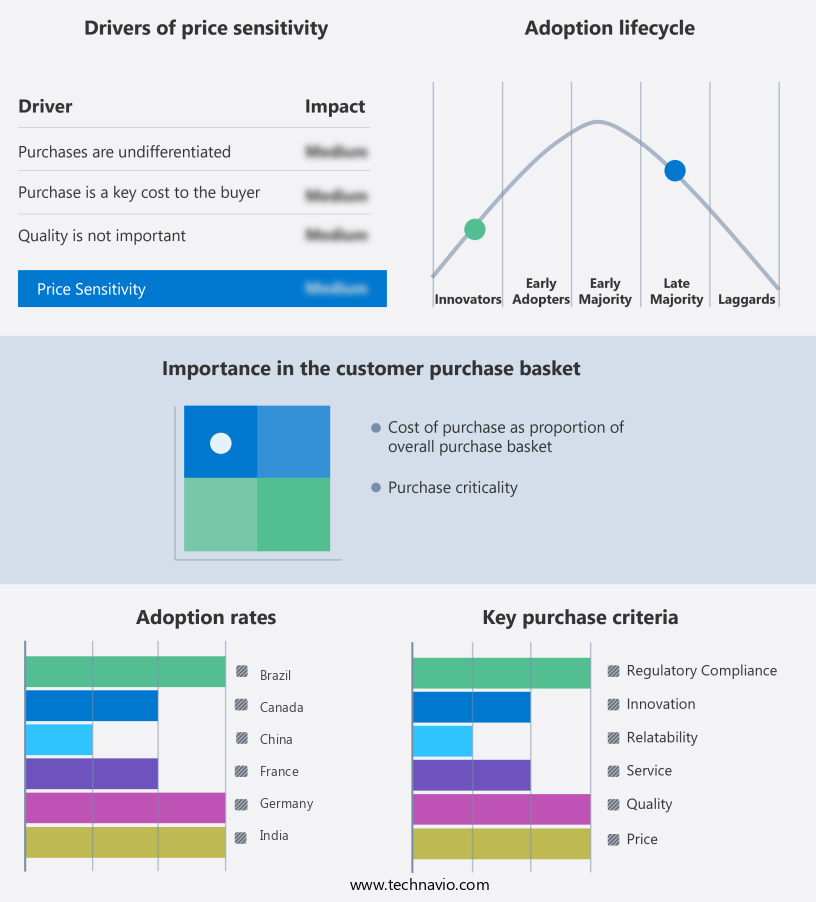
    The sensors in oil and gas market forecasting report includes the adoption lifecycle of the market, covering from the innovator’s stage to the laggard’s stage. It focuses on adoption rates in different regions based on penetration. Furthermore, the sensors in oil and gas market report also includes key purchase criteria and drivers of price sensitivity to help companies evaluate and develop their market growth analysis strategies.

    Sensors In Oil And Gas Market Share by Geography

     Customer Landscape

    Key Companies & Market Insights

    Companies are implementing various strategies, such as strategic alliances, sensors in oil and gas market forecast, partnerships, mergers and acquisitions, geographical expansion, and product/service launches, to enhance their presence in the industry.

    ABB - The company specializes in providing advanced sensor solutions, encompassing products like the LMS 7100, MS10, and MS 50. These sensors are designed to enhance operational efficiency and accuracy across various industries. With cutting-edge technology and rigorous quality standards, our offerings ensure reliable performance and data collection. By integrating these sensors into systems, businesses can optimize processes, minimize downtime, and make informed decisions based on real-time data. Our commitment to innovation and excellence sets us apart in the sensor market.

    The industry research and growth report includes detailed analyses of the competitive landscape of the market and information about key companies, including:

    • ABB
    • Amphenol Corp.
    • Automation Products Inc.
    • BD SENSORS GmbH.
    • Carlo Gavazzi
    • Edinburgh Instruments Ltd.
    • Emerson Electric Co.
    • Endress Hauser Group Services AG
    • Figaro Engineering Inc.
    • Fortive Corp.
    • Gas Sensing Solutions Ltd.
    • General Electric Co.
    • Honeywell International Inc.
    • LORD Corp.
    • Robert Bosch GmbH
    • Rockwell Automation Inc.
    • RS Technics BV
    • Siemens AG
    • TE Connectivity Ltd.

    Qualitative and quantitative analysis of companies has been conducted to help clients understand the wider business environment as well as the strengths and weaknesses of key industry players. Data is qualitatively analyzed to categorize companies as pure play, category-focused, industry-focused, and diversified; it is quantitatively analyzed to categorize companies as dominant, leading, strong, tentative, and weak.

    Recent Development and News in Sensors In Oil And Gas Market

    • In February 2023, Honeywell announced the launch of its new Ultra-Low Power Gas Sensor, designed to enhance the detection capabilities of methane leaks in oil and gas operations. This innovative sensor is expected to reduce false positives and improve overall efficiency by up to 50% (Honeywell press release).
    • In May 2024, Schneider Electric and ABB entered into a strategic partnership to jointly develop and market advanced sensing technologies for the oil and gas industry. This collaboration aims to combine Schneider Electric's EcoStruxure platform with ABB's Ability™ Oil and Gas solution, providing integrated and efficient process control systems (Schneider Electric press release).
    • In October 2024, Emerson acquired Aventics, a leading provider of pneumatic components and automation technologies. This acquisition is expected to strengthen Emerson's position in the oil and gas market by expanding its portfolio of pressure control solutions and enhancing its digital transformation capabilities (Emerson press release).
    • In January 2025, the US Department of Energy announced a USD100 million investment in the development of advanced sensors for oil and gas operations. This initiative aims to improve operational efficiency, reduce emissions, and ensure safety in the industry (US Department of Energy press release).

    Research Analyst Overview

    • In the oil and gas industry, inductive sensors play a crucial role in environmental compliance by monitoring fluid levels and detecting leaks. ISO standards and industry regulations mandate the use of these sensors to ensure operational efficiency and adherence to regulations. Cellular networks and satellite communication enable real-time alerts and notifications for fault detection and risk assessment. Nanotechnology sensors, including MEMS, optical, electrochemical, piezoelectric, and capacitive sensors, offer enhanced accuracy and cost optimization. Furthermore, fieldbus protocols such as Foundation Fieldbus, Profibus, and Modbus, as well as Ethernet/IP and HART protocols, facilitate seamless data exchange and analysis.
    • Historical data analysis and trend analysis are essential for cost optimization and root cause identification. Wireless communication protocols enable remote monitoring and control, while IEC standards ensure interoperability and safety. ISO and IEC standards continue to evolve, driving innovation in sensor technology and integration with advanced data visualization tools. Root cause analysis and risk assessment are critical components of proactive maintenance strategies, reducing downtime and improving overall operational efficiency.

    Dive into Technavio’s robust research methodology, blending expert interviews, extensive data synthesis, and validated models for unparalleled Sensors In Oil And Gas Market insights. See full methodology.

    Market Scope

    Report Coverage

    Details

    Page number

    166

    Base year

    2024

    Historic period

    2019-2023

    Forecast period

    2025-2029

    Growth momentum & CAGR

    Accelerate at a CAGR of 3.6%

    Market growth 2025-2029

    USD 1589.5 million

    Market structure

    Fragmented

    YoY growth 2024-2025(%)

    3.4

    Key countries

    US, China, Japan, Germany, UK, India, Canada, France, Brazil, and Spain

    Competitive landscape

    Leading Companies, Market Positioning of Companies, Competitive Strategies, and Industry Risks

    Request Free Sample

    What are the Key Data Covered in this Sensors In Oil And Gas Market Research and Growth Report?

    • CAGR of the Sensors In Oil And Gas industry during the forecast period
    • Detailed information on factors that will drive the growth and forecasting between 2025 and 2029
    • Precise estimation of the size of the market and its contribution of the industry in focus to the parent market
    • Accurate predictions about upcoming growth and trends and changes in consumer behaviour
    • Growth of the market across APAC, North America, Europe, Middle East and Africa, and South America
    • Thorough analysis of the market’s competitive landscape and detailed information about companies
    • Comprehensive analysis of factors that will challenge the sensors in oil and gas market growth of industry companies

    We can help! Our analysts can customize this sensors in oil and gas market research report to meet your requirements.

    Get in touch


    1 Executive Summary

    • 1.1 Market overview
      • Executive Summary - Chart on Market Overview
      • Executive Summary - Data Table on Market Overview
      • Executive Summary - Chart on Global Market Characteristics
      • Executive Summary - Chart on Market by Geography
      • Executive Summary - Chart on Market Segmentation by Type
      • Executive Summary - Chart on Incremental Growth
      • Executive Summary - Data Table on Incremental Growth
      • Executive Summary - Chart on Company Market Positioning

    2 Technavio Analysis

    • 2.1 Analysis of price sensitivity, lifecycle, customer purchase basket, adoption rates, and purchase criteria
      • Analysis of price sensitivity, lifecycle, customer purchase basket, adoption rates, and purchase criteria
    • 2.2 Criticality of inputs and Factors of differentiation
      • Overview on criticality of inputs and factors of differentiation
    • 2.3 Factors of disruption
      • Overview on factors of disruption
    • 2.4 Impact of drivers and challenges
      • Impact of drivers and challenges in 2024 and 2029

    3 Market Landscape

    • 3.1 Market ecosystem
      • Parent Market
      • Data Table on - Parent Market
    • 3.2 Market characteristics
      • Market characteristics analysis
    • 3.3 Value chain analysis
      • Value chain analysis

    4 Market Sizing

    • 4.1 Market definition
      • Offerings of companies included in the market definition
    • 4.2 Market segment analysis
      • Market segments
    • 4.3 Market size 2024
      • 4.4 Market outlook: Forecast for 2024-2029
        • Chart on Global - Market size and forecast 2024-2029 ($ million)
        • Data Table on Global - Market size and forecast 2024-2029 ($ million)
        • Chart on Global Market: Year-over-year growth 2024-2029 (%)
        • Data Table on Global Market: Year-over-year growth 2024-2029 (%)

      5 Historic Market Size

      • 5.1 Global Sensors In Oil And Gas Market 2019 - 2023
        • Historic Market Size - Data Table on Global Sensors In Oil And Gas Market 2019 - 2023 ($ million)
      • 5.2 Type segment analysis 2019 - 2023
        • Historic Market Size - Type Segment 2019 - 2023 ($ million)
      • 5.3 Geography segment analysis 2019 - 2023
        • Historic Market Size - Geography Segment 2019 - 2023 ($ million)
      • 5.4 Country segment analysis 2019 - 2023
        • Historic Market Size - Country Segment 2019 - 2023 ($ million)

      6 Qualitative Analysis

      • 6.1 The AI impact on Global Sensors in Oil and Gas Market

        7 Five Forces Analysis

        • 7.1 Five forces summary
          • Five forces analysis - Comparison between 2024 and 2029
        • 7.2 Bargaining power of buyers
          • Bargaining power of buyers - Impact of key factors 2024 and 2029
        • 7.3 Bargaining power of suppliers
          • Bargaining power of suppliers - Impact of key factors in 2024 and 2029
        • 7.4 Threat of new entrants
          • Threat of new entrants - Impact of key factors in 2024 and 2029
        • 7.5 Threat of substitutes
          • Threat of substitutes - Impact of key factors in 2024 and 2029
        • 7.6 Threat of rivalry
          • Threat of rivalry - Impact of key factors in 2024 and 2029
        • 7.7 Market condition
          • Chart on Market condition - Five forces 2024 and 2029

        8 Market Segmentation by Type

        • 8.1 Market segments
          • Chart on Type - Market share 2024-2029 (%)
          • Data Table on Type - Market share 2024-2029 (%)
        • 8.2 Comparison by Type
          • Chart on Comparison by Type
          • Data Table on Comparison by Type
        • 8.3 Wired - Market size and forecast 2024-2029
          • Chart on Wired - Market size and forecast 2024-2029 ($ million)
          • Data Table on Wired - Market size and forecast 2024-2029 ($ million)
          • Chart on Wired - Year-over-year growth 2024-2029 (%)
          • Data Table on Wired - Year-over-year growth 2024-2029 (%)
        • 8.4 Wireless - Market size and forecast 2024-2029
          • Chart on Wireless - Market size and forecast 2024-2029 ($ million)
          • Data Table on Wireless - Market size and forecast 2024-2029 ($ million)
          • Chart on Wireless - Year-over-year growth 2024-2029 (%)
          • Data Table on Wireless - Year-over-year growth 2024-2029 (%)
        • 8.5 Market opportunity by Type
          • Market opportunity by Type ($ million)
          • Data Table on Market opportunity by Type ($ million)

        9 Customer Landscape

        • 9.1 Customer landscape overview
          • Analysis of price sensitivity, lifecycle, customer purchase basket, adoption rates, and purchase criteria

        10 Geographic Landscape

        • 10.1 Geographic segmentation
          • Chart on Market share by geography 2024-2029 (%)
          • Data Table on Market share by geography 2024-2029 (%)
        • 10.2 Geographic comparison
          • Chart on Geographic comparison
          • Data Table on Geographic comparison
        • 10.3 APAC - Market size and forecast 2024-2029
          • Chart on APAC - Market size and forecast 2024-2029 ($ million)
          • Data Table on APAC - Market size and forecast 2024-2029 ($ million)
          • Chart on APAC - Year-over-year growth 2024-2029 (%)
          • Data Table on APAC - Year-over-year growth 2024-2029 (%)
        • 10.4 North America - Market size and forecast 2024-2029
          • Chart on North America - Market size and forecast 2024-2029 ($ million)
          • Data Table on North America - Market size and forecast 2024-2029 ($ million)
          • Chart on North America - Year-over-year growth 2024-2029 (%)
          • Data Table on North America - Year-over-year growth 2024-2029 (%)
        • 10.5 Europe - Market size and forecast 2024-2029
          • Chart on Europe - Market size and forecast 2024-2029 ($ million)
          • Data Table on Europe - Market size and forecast 2024-2029 ($ million)
          • Chart on Europe - Year-over-year growth 2024-2029 (%)
          • Data Table on Europe - Year-over-year growth 2024-2029 (%)
        • 10.6 Middle East and Africa - Market size and forecast 2024-2029
          • Chart on Middle East and Africa - Market size and forecast 2024-2029 ($ million)
          • Data Table on Middle East and Africa - Market size and forecast 2024-2029 ($ million)
          • Chart on Middle East and Africa - Year-over-year growth 2024-2029 (%)
          • Data Table on Middle East and Africa - Year-over-year growth 2024-2029 (%)
        • 10.7 South America - Market size and forecast 2024-2029
          • Chart on South America - Market size and forecast 2024-2029 ($ million)
          • Data Table on South America - Market size and forecast 2024-2029 ($ million)
          • Chart on South America - Year-over-year growth 2024-2029 (%)
          • Data Table on South America - Year-over-year growth 2024-2029 (%)
        • 10.8 US - Market size and forecast 2024-2029
          • Chart on US - Market size and forecast 2024-2029 ($ million)
          • Data Table on US - Market size and forecast 2024-2029 ($ million)
          • Chart on US - Year-over-year growth 2024-2029 (%)
          • Data Table on US - Year-over-year growth 2024-2029 (%)
        • 10.9 China - Market size and forecast 2024-2029
          • Chart on China - Market size and forecast 2024-2029 ($ million)
          • Data Table on China - Market size and forecast 2024-2029 ($ million)
          • Chart on China - Year-over-year growth 2024-2029 (%)
          • Data Table on China - Year-over-year growth 2024-2029 (%)
        • 10.10 Japan - Market size and forecast 2024-2029
          • Chart on Japan - Market size and forecast 2024-2029 ($ million)
          • Data Table on Japan - Market size and forecast 2024-2029 ($ million)
          • Chart on Japan - Year-over-year growth 2024-2029 (%)
          • Data Table on Japan - Year-over-year growth 2024-2029 (%)
        • 10.11 Germany - Market size and forecast 2024-2029
          • Chart on Germany - Market size and forecast 2024-2029 ($ million)
          • Data Table on Germany - Market size and forecast 2024-2029 ($ million)
          • Chart on Germany - Year-over-year growth 2024-2029 (%)
          • Data Table on Germany - Year-over-year growth 2024-2029 (%)
        • 10.12 UK - Market size and forecast 2024-2029
          • Chart on UK - Market size and forecast 2024-2029 ($ million)
          • Data Table on UK - Market size and forecast 2024-2029 ($ million)
          • Chart on UK - Year-over-year growth 2024-2029 (%)
          • Data Table on UK - Year-over-year growth 2024-2029 (%)
        • 10.13 India - Market size and forecast 2024-2029
          • Chart on India - Market size and forecast 2024-2029 ($ million)
          • Data Table on India - Market size and forecast 2024-2029 ($ million)
          • Chart on India - Year-over-year growth 2024-2029 (%)
          • Data Table on India - Year-over-year growth 2024-2029 (%)
        • 10.14 Canada - Market size and forecast 2024-2029
          • Chart on Canada - Market size and forecast 2024-2029 ($ million)
          • Data Table on Canada - Market size and forecast 2024-2029 ($ million)
          • Chart on Canada - Year-over-year growth 2024-2029 (%)
          • Data Table on Canada - Year-over-year growth 2024-2029 (%)
        • 10.15 France - Market size and forecast 2024-2029
          • Chart on France - Market size and forecast 2024-2029 ($ million)
          • Data Table on France - Market size and forecast 2024-2029 ($ million)
          • Chart on France - Year-over-year growth 2024-2029 (%)
          • Data Table on France - Year-over-year growth 2024-2029 (%)
        • 10.16 Spain - Market size and forecast 2024-2029
          • Chart on Spain - Market size and forecast 2024-2029 ($ million)
          • Data Table on Spain - Market size and forecast 2024-2029 ($ million)
          • Chart on Spain - Year-over-year growth 2024-2029 (%)
          • Data Table on Spain - Year-over-year growth 2024-2029 (%)
        • 10.17 Brazil - Market size and forecast 2024-2029
          • Chart on Brazil - Market size and forecast 2024-2029 ($ million)
          • Data Table on Brazil - Market size and forecast 2024-2029 ($ million)
          • Chart on Brazil - Year-over-year growth 2024-2029 (%)
          • Data Table on Brazil - Year-over-year growth 2024-2029 (%)
        • 10.18 Market opportunity by geography
          • Market opportunity by geography ($ million)
          • Data Tables on Market opportunity by geography ($ million)

        11 Drivers, Challenges, and Opportunity/Restraints

        • 11.1 Market drivers
          • 11.2 Market challenges
            • 11.3 Impact of drivers and challenges
              • Impact of drivers and challenges in 2024 and 2029
            • 11.4 Market opportunities/restraints

              12 Competitive Landscape

              • 12.1 Overview
                • 12.2 Competitive Landscape
                  • Overview on criticality of inputs and factors of differentiation
                • 12.3 Landscape disruption
                  • Overview on factors of disruption
                • 12.4 Industry risks
                  • Impact of key risks on business

                13 Competitive Analysis

                • 13.1 Companies profiled
                  • Companies covered
                • 13.2 Company ranking index
                  • Company ranking index
                • 13.3 Market positioning of companies
                  • Matrix on companies position and classification
                • 13.4 ABB
                  • ABB - Overview
                  • ABB - Business segments
                  • ABB - Key news
                  • ABB - Key offerings
                  • ABB - Segment focus
                  • SWOT
                • 13.5 Amphenol Corp.
                  • Amphenol Corp. - Overview
                  • Amphenol Corp. - Business segments
                  • Amphenol Corp. - Key news
                  • Amphenol Corp. - Key offerings
                  • Amphenol Corp. - Segment focus
                  • SWOT
                • 13.6 Emerson Electric Co.
                  • Emerson Electric Co. - Overview
                  • Emerson Electric Co. - Business segments
                  • Emerson Electric Co. - Key news
                  • Emerson Electric Co. - Key offerings
                  • Emerson Electric Co. - Segment focus
                  • SWOT
                • 13.7 Fortive Corp.
                  • Fortive Corp. - Overview
                  • Fortive Corp. - Business segments
                  • Fortive Corp. - Key news
                  • Fortive Corp. - Key offerings
                  • Fortive Corp. - Segment focus
                  • SWOT
                • 13.8 General Electric Co.
                  • General Electric Co. - Overview
                  • General Electric Co. - Business segments
                  • General Electric Co. - Key news
                  • General Electric Co. - Key offerings
                  • General Electric Co. - Segment focus
                  • SWOT
                • 13.9 Honeywell International Inc.
                  • Honeywell International Inc. - Overview
                  • Honeywell International Inc. - Business segments
                  • Honeywell International Inc. - Key news
                  • Honeywell International Inc. - Key offerings
                  • Honeywell International Inc. - Segment focus
                  • SWOT
                • 13.10 LORD Corp.
                  • LORD Corp. - Overview
                  • LORD Corp. - Product / Service
                  • LORD Corp. - Key offerings
                  • SWOT
                • 13.11 Rockwell Automation Inc.
                  • Rockwell Automation Inc. - Overview
                  • Rockwell Automation Inc. - Business segments
                  • Rockwell Automation Inc. - Key news
                  • Rockwell Automation Inc. - Key offerings
                  • Rockwell Automation Inc. - Segment focus
                  • SWOT
                • 13.12 RS Technics BV
                  • RS Technics BV - Overview
                  • RS Technics BV - Product / Service
                  • RS Technics BV - Key offerings
                  • SWOT
                • 13.13 Siemens AG
                  • Siemens AG - Overview
                  • Siemens AG - Business segments
                  • Siemens AG - Key news
                  • Siemens AG - Key offerings
                  • Siemens AG - Segment focus
                  • SWOT

                14 Appendix

                • 14.1 Scope of the report
                  • 14.2 Inclusions and exclusions checklist
                    • Inclusions checklist
                    • Exclusions checklist
                  • 14.3 Currency conversion rates for US$
                    • Currency conversion rates for US$
                  • 14.4 Research methodology
                    • Research methodology
                  • 14.5 Data procurement
                    • Information sources
                  • 14.6 Data validation
                    • Data validation
                  • 14.7 Validation techniques employed for market sizing
                    • Validation techniques employed for market sizing
                  • 14.8 Data synthesis
                    • Data synthesis
                  • 14.9 360 degree market analysis
                    • 360 degree market analysis
                  • 14.10 List of abbreviations
                    • List of abbreviations

                  Research Methodology

                  Technavio presents a detailed picture of the market by way of study, synthesis, and summation of data from multiple sources. The analysts have presented the various facets of the market with a particular focus on identifying the key industry influencers. The data thus presented is comprehensive, reliable, and the result of extensive research, both primary and secondary.

                  INFORMATION SOURCES

                  Primary sources

                  • Manufacturers and suppliers
                  • Channel partners
                  • Industry experts
                  • Strategic decision makers

                  Secondary sources

                  • Industry journals and periodicals
                  • Government data
                  • Financial reports of key industry players
                  • Historical data
                  • Press releases

                  DATA ANALYSIS

                  Data Synthesis

                  • Collation of data
                  • Estimation of key figures
                  • Analysis of derived insights

                  Data Validation

                  • Triangulation with data models
                  • Reference against proprietary databases
                  • Corroboration with industry experts

                  REPORT WRITING

                  Qualitative

                  • Market drivers
                  • Market challenges
                  • Market trends
                  • Five forces analysis

                  Quantitative

                  • Market size and forecast
                  • Market segmentation
                  • Geographical insights
                  • Competitive landscape

                  Interested in this report?

                  Get your sample now to see our research methodology and insights!

                  Download Now

                  Frequently Asked Questions

                  Sensors In Oil And Gas market growth will increase by $ 1589.5 mn during 2025-2029 .

                  The Sensors In Oil And Gas market is expected to grow at a CAGR of 3.6% during 2025-2029 .

                  Sensors In Oil And Gas market is segmented by Type( Wired, Wireless)

                  ABB, Amphenol Corp., Automation Products Inc., BD SENSORS GmbH., Carlo Gavazzi, Edinburgh Instruments Ltd., Emerson Electric Co., Endress Hauser Group Services AG, Figaro Engineering Inc., Fortive Corp., Gas Sensing Solutions Ltd., General Electric Co., Honeywell International Inc., LORD Corp., Robert Bosch GmbH, Rockwell Automation Inc., RS Technics BV, Siemens AG, TE Connectivity Ltd. are a few of the key vendors in the Sensors In Oil And Gas market.

                  APAC will register the highest growth rate of 38% among the other regions. Therefore, the Sensors In Oil And Gas market in APAC is expected to garner significant business opportunities for the vendors during the forecast period.

                  US, China, Japan, Germany, UK, India, Canada, France, Brazil, Spain

                  • Increase in LNG tradeLNG is gaining popularity as a transport fuel is the driving factor this market.
                  • and its demand has been increasing owing to new LNG trade routes and the rise in LNG supply in the traditional market. The increasing focus on clean energy is one of the major drivers for the growth in the LNG market. This is because several countries are trying to increase the share of natural gas in their energy mix is the driving factor this market.
                  • which is increasing the demand for LNG. As LNG is liquefied at a very high pressure of 4 psi (pound-force per square inch) and -260-degree F is the driving factor this market.
                  • adequate care is needed to keep the gas at set parameters. Though LNG vapors are non-toxic and are a much safer fuel than others is the driving factor this market.
                  • the extreme operating variables in an LNG plant imply that it requires adequate monitoring. Sensors are therefore used for regulating the process parameters of an LNG liquefaction and regasification plant.Cross-border disputes and geopolitical tensions over pipelines have renewed interest in LNG as a transport fuel. Investments in LNG infrastructure are set to peak at $42 billion in 2024 is the driving factor this market.
                  • with significant projects underway in Australia is the driving factor this market.
                  • Qatar is the driving factor this market.
                  • Africa is the driving factor this market.
                  • Russia is the driving factor this market.
                  • and the US. For example is the driving factor this market.
                  • Mozambiques first onshore LNG project is the driving factor this market.
                  • with a nameplate capacity of over 12 MTPA is the driving factor this market.
                  • began production in late 2022. On the demand side is the driving factor this market.
                  • Asia continues to lead the LNG import markets is the driving factor this market.
                  • driven by the expansion of new LNG regasification facilities. Chinas LNG imports are expected to rise by 8.1% in 2024 is the driving factor this market.
                  • reaching 77 million metric tons is the driving factor this market.
                  • solidifying its position as the worlds largest LNG importer. Additionally is the driving factor this market.
                  • China plans to add 60 million metric tons per year of new LNG regasification capacity in 2024. The increasing natural gas demand is the driving factor this market.
                  • as countries diversify their energy mix from coal to cleaner energy sources is the driving factor this market.
                  • has significantly boosted LNG exports in China is the driving factor this market.
                  • India is the driving factor this market.
                  • and Pakistan. The global rise in LNG trade is expected to further drive the demand for global sensors in oil and gas market during the forecast period. is the driving factor this market.

                  The Sensors In Oil And Gas market vendors should focus on grabbing business opportunities from the Wired segment as it accounted for the largest market share in the base year.