Server Operating System Market Analysis North America, Europe, APAC, South America, Middle East and Africa - US, Germany, UK, China, Canada - Size and Forecast 2024-2028

Server Operating System Market Analysis North America, Europe, APAC, South America, Middle East and Africa - US, Germany, UK, China, Canada - Size and Forecast 2024-2028

Published: Aug 2024 174 Pages SKU: IRTNTR75381

Market Overview at a Glance

$12.19 B
Market Opportunity
10.87%
CAGR
9.53
YoY growth 2023-2024(%)

Server Operating System Market Size 2024-2028

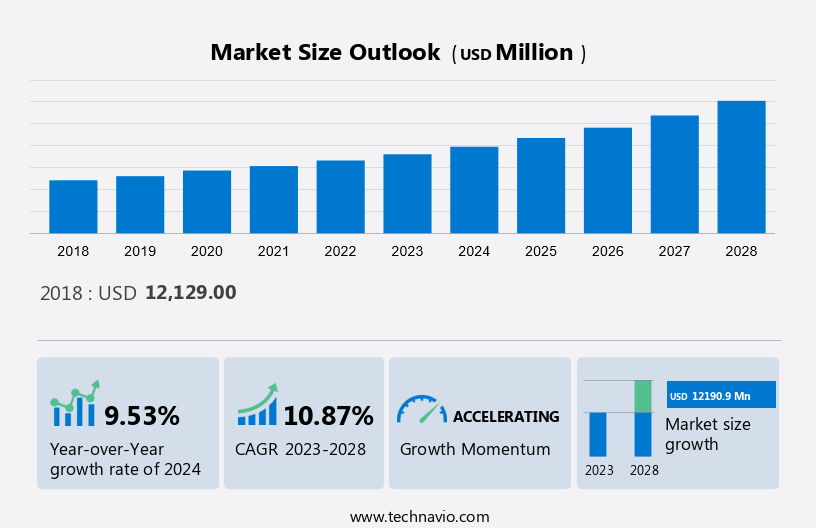
The server operating system market size is estimated to increase by USD 12.19 billion and grow at a CAGR of 10.87% between 2023 and 2028. The market is experiencing significant growth, driven by several key factors. Firstly, the increasing investments in the construction of hyper-scale data centers are fueling the demand for advanced server operating systems that can efficiently manage large-scale infrastructure. Secondly, technological advancements in server operating systems, such as containerization and virtualization, are enabling organizations to optimize their IT resources, data center, and improve application performance. However, the market is also facing challenges, including the rising number of security issues, which require server operating systems to provide robust security features to protect against cyber threats. Additionally, the growing complexity of IT environments is necessitating the need for server operating systems that can seamlessly integrate with various applications and tools. Overall, the server operating system market is expected to continue its growth trajectory, driven by these market trends and challenges.

What will be the Size of the Market During the Forecast Period?

Server Operating System Market Size

To learn more about this report, View Report Sample

Market Segmentation

By Deployment

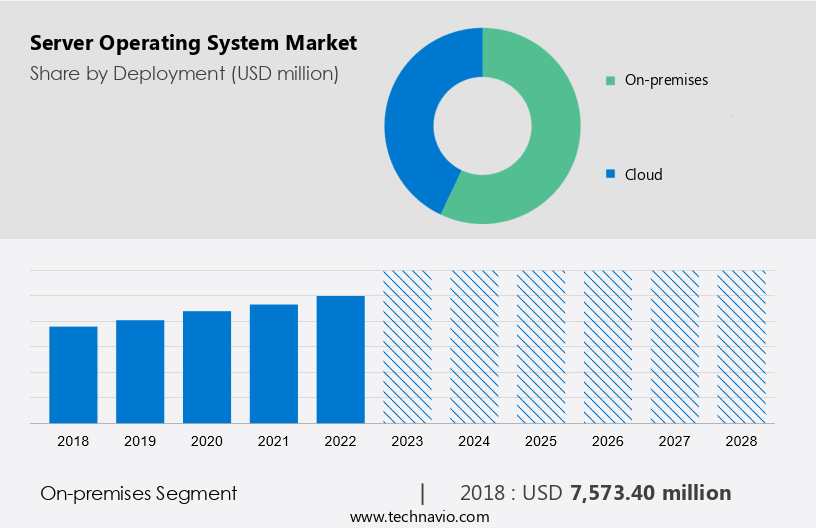
The market share growth by the on-premises segment will be significant during the forecast period. On-premises solutions in the global market are popular among companies looking to manage their IT infrastructure. On-premises solutions give companies complete control over the hardware and software, allowing them to adapt the system to their individual needs. One of the main benefits of on-premises solutions is increased security and privacy. Businesses can keep data and applications behind firewalls and other security measures, reducing the risk of cyberattacks and data breaches. This is especially important for software companies that handle sensitive data such as financial or medical information.

Server Operating System Market Size

Get a glance at the market contribution of various segments View the PDF Sample

The on-premises segment was valued at USD 7.57 billion in 2018. On-premises solutions allow companies to choose their hardware and software companies, design their systems to meet their specific needs and make changes and upgrades as needed. This gives software companies more control over their IT infrastructure, helping them achieve the best possible performance. On-premises solutions also offer improved performance and reliability compared to cloud-based solutions. However, on-premises solutions can be expensive up-front, as software companies must invest in the hardware, software, and staff required to maintain and manage the operating system.

By Region

Server Operating System Market Share by Geography

For more insights on the market share of various regions Download PDF Sample now!

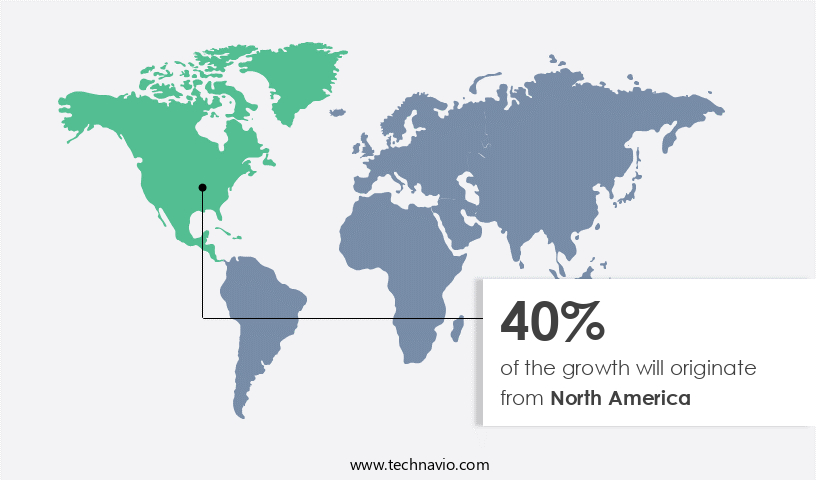
North America is estimated to contribute 40% to the growth of the global market during the forecast period. Technavio’s analysts have elaborately explained the regional trends and drivers that shape the market during the forecast period. One of the reasons why North America has a strong position in the market is the high acceptance of cloud-based services by enterprises. These cloud-based services require advanced systems for optimal performance and security. North America is home to major cloud service providers such as Amazon Web Services (AWS), Microsoft Azure, and Google Cloud. Another factor contributing to the growth of the North American market is the increasing demand for data centers.

The North American region is home to some of the world's largest data centers. Companies such as Microsoft Corp (Microsoft), IBM Corp (IBM), and Oracle Corp (Oracle) have a strong presence in North America and invest heavily in research and development (R&D) to innovate and gain a competitive advantage over other companies. For example, Google LLC (Google) announced its USD 750 million new data center in Nebraska to meet its goal of spending USD 9.5 billion on new Google data centers and offices in 2022. Such expansion plans drive the growth of the market in North America during the forecast period.

Market Dynamics and Customer Landscape

The market is a significant segment of the IT industry, focusing on software that manages and operates servers in data centers and cloud platforms. Server OS includes various types such as Application Servers, File Servers, Database Servers, Mail Servers, Web Servers, and others. These operating systems are essential for Client Server Infrastructure and Client Machinery to function effectively in Network environments. Cloud computing has been a major driver in the growth of the Server OS market, with hybrid cloud environments and 5G networking technologies playing a pivotal role. Server OS software is integral to enterprise migration and digital transformation, as businesses invest in IT infrastructure to enhance internet services and enterprise computing. Linux segment holds a substantial share in the Server OS market due to its open-source nature and flexibility. Virtual Machine Segment is also gaining traction with the increasing adoption of virtual machine software. Trained IT personnel are essential for implementing and managing Server OS, making it a vital area of focus for businesses and developers alike. 

Key Market Driver

The market is experiencing significant growth, propelled by growing investments in the construction of hyper-scale data centers worldwide. Data center operators are expanding operations to meet the escalating demand for cloud computing services. For instance, AWS, a leading cloud service provider, has substantially increased annual spending on data centers, reaching USD 16.1 billion in Q3 2021.

Moreover, the Northern Virginia region, hosting over 50 data centers, benefits from extensive IT infrastructure and strategic positioning. Such investments contribute to increased demand for server operating systems, catering to the needs of businesses across various industries, driving market growth during the forecast period.

Significant Market Trends

Technological advancements are the major trend shaping the market. companies in the global market are focused on developing technologically advanced computer server solutions. These companies focus on deploying servers with customized configurations that meet the needs of end-user industries. The government is also supporting the development of new servers in developing countries such as India. For example, the Indian government's Ministry of Electronics and Information Technology (MeitY) launched India's first native server, Rudra, in December 2021. The Advanced Computing Development Center (C-DAC) developed the server as part of the National Supercomputing Mission (NSM). A newly introduced server design can be used to create a standalone commercial server. It also serves as a building block for large supercomputer systems. Similarly, in December 2021, Dell Technologies announced the launch of its new Dell EMC PowerEdge building block rack servers and small footprint tower servers in India. The company claims that its newly launched servers are tailored to the technical needs of small businesses.

Further, the small footprint of these servers helps alleviate SMB space constraints. These servers can also be used in offices, hospitality, and retail environments. Such servers support advanced technologies such as artificial intelligence (AI) and accelerators for enterprise-class workloads such as inference, medical imaging, data analytics, virtualization, and software-defined storage. Therefore, the increasing number of products offered by market companies, technological advancements in the market, and the availability of inexpensive physical servers specifically designed for SMEs all contribute to the growth of the focused market. These factors are likely to propel the growth of the global market during the forecast period. 

Major Market Challenge

The rising number of security issues may impede the growth of the market. Data breaches and cyberattacks are an ongoing threat to businesses, especially small businesses, discouraging investment in physical servers. As a result, security issues have become one of the most important considerations when choosing a computer service provider. According to IBM's 2022 security report, the global average impact of a data breach on an organization is USD 3.86 million, with the highest average cost in the United States at an average of USD 7.9 million. The geographic location of data centers and security systems such as physical security, biometrics, and compliance provides assurance against potentially costly threats.

Additionally, organizations should implement various virtual security measures such as log inspection, strong data encryption, and access based on clearance levels to protect against internal and external attacks and data breaches. Data centers should monitor activity anomalies and report attempts to compromise communications. End-user trust is extremely important to companies operating in the global market. Market providers aim to convince end-users that their or their customers' sensitive data has not been compromised and is safely stored. A data breach doesn't just have an economic impact on your business. This can lead to a lack of trust in the company and provider, and damage the image, integrity, and credibility of the provider. Therefore, these security challenges faced by market companies may adversely affect the growth of the global market during the forecast period.

Key Market Customer Landscape

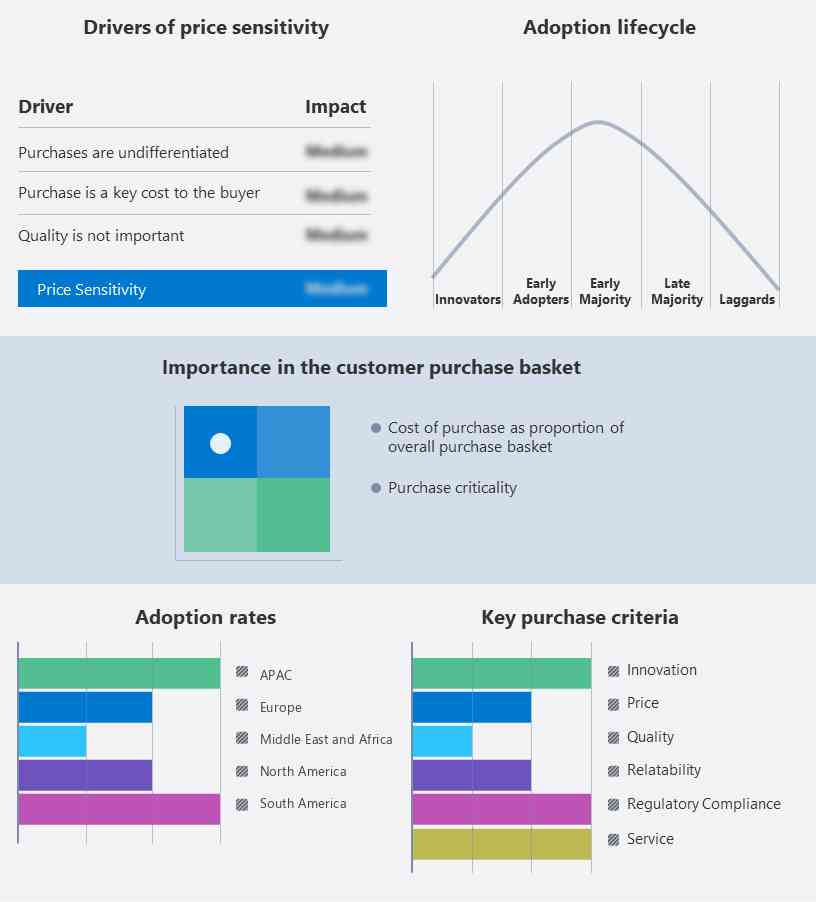
The report includes the adoption lifecycle of the market, covering from the innovator’s stage to the laggard’s stage. It focuses on adoption rates in different regions based on penetration. Furthermore, the report also includes key purchase criteria and drivers of price sensitivity to help companies evaluate and develop their growth strategies.

Server Operating System Market Share by Geography

Market Customer Landscape

Who are the Major Market Companies?

Companies are implementing various strategies, such as strategic alliances, partnerships, mergers and acquisitions, geographical expansion, and product/service launches, to enhance their presence in the market.

  • Alphabet Inc.: The company offers server operating systems such as COS 101 LTS, Fedora CoreOS stable, and RHEL 9 under the brand Google LLC.

The report also includes detailed analyses of the competitive landscape of the market and information about 15 market companies, including:

  • Alphabet Inc.
  • Amazon.com Inc.
  • Canonical Ltd.
  • Cisco Systems Inc.
  • Debian
  • Dell Technologies Inc.
  • FreeBSD
  • Fujitsu Ltd.
  • Hewlett Packard Enterprise Co.
  • Huawei Technologies Co. Ltd.
  • International Business Machines Corp.
  • Microsoft Corp.
  • NEC Corp.
  • Open Text Corp.
  • Oracle Corp.
  • PC OpenSystems LLC
  • SMART Global Holdings Inc.
  • Suse Group
  • Unisys Corp.
  • VMware Inc.

Qualitative and quantitative analysis of companies has been conducted to help clients understand the wider business environment as well as the strengths and weaknesses of key market players. Data is qualitatively analyzed to categorize companies as pure play, category-focused, industry-focused, and diversified; it is quantitatively analyzed to categorize companies as dominant, leading, strong, tentative, and weak.

Segment Overview

The market research report provides comprehensive data (region-wise segment analysis), with forecasts and estimates in "USD billion " for the period 2024-2028, as well as historical data from 2018-2022 for the following segments.

  • Deployment Outlook 
    • On-premises
    • Cloud
  • End-user Outlook 
    • Large enterprises
    • Small and medium-sized enterprises
  • Region Outlook 
    • North America
      • The U.S.
      • Canada
    • Europe
      • The U.K.
      • Germany
      • France
      • Rest of Europe
    • APAC
      • China
      • India
    • Middle East & Africa
      • Saudi Arabia
      • South Africa
      • Rest of the Middle East & Africa
    • South America
      • Argentina
      • Brazil
      • Chile

Market Analyst Overview

Unleashing the Power of Server Operating Systems in the Digital Age Server Operating Systems (OS) play a pivotal role in the digital transformation of businesses, powering various IT infrastructure including Cloud platforms, Data center infrastructure, Client server infrastructure, and Network. Operating Systems are the backbone of Computers, be it Windows Server or MacOS X Server, and enable the functioning of Application servers, File servers, Database servers, Mail servers, Web servers, and more. In today's Hybrid cloud environment, IT teams manage both Physical and Virtualized infrastructure, utilizing Virtual machines and Cloud based solutions. Server OS, a crucial component of IT technology, is available in both Subscription model, with Paid subscription and Non-paid subscription options, catering to the needs of Large enterprises and individual clients.

Further, advancements in IoT, AI technology, Government investments, and Digital technology have led to the adoption of 5G networking technologies and Colocation data centres, further fueling the growth of server operating systems. The integration of Server OS with hybrid cloud environments and the use of trained IT personnel ensure minimal Server downtime, making businesses more efficient and competitive. In conclusion, Server Operating Systems continue to be a significant player in the IT landscape, providing essential functionality and flexibility to businesses in various industries.

Market Scope

Report Coverage

Details

Page number

174

Base year

2023

Historic period

2018-2022

Forecast period

2024-2028

Growth momentum & CAGR

Accelerate at a CAGR of 10.87%

Market growth 2024-2028

USD 12.19 billion

Market structure

Fragmented

YoY growth 2023-2024(%)

9.53

Regional analysis

North America, Europe, APAC, South America, and Middle East and Africa

Performing market contribution

North America at 40%

Key countries

US, Germany, UK, China, and Canada

Competitive landscape

Leading Companies, Market Positioning of Companies, Competitive Strategies, and Industry Risks

Key companies profiled

Alphabet Inc., Amazon.com Inc., Canonical Ltd., Cisco Systems Inc., Debian, Dell Technologies Inc., FreeBSD, Fujitsu Ltd., Hewlett Packard Enterprise Co., Huawei Technologies Co. Ltd., International Business Machines Corp., Microsoft Corp., NEC Corp., Open Text Corporation, Oracle Corp., PC OpenSystems LLC, SMART Global Holdings Inc., Suse Group, Unisys Corp., and VMware Inc.

Market dynamics

Parent market analysis, Market growth inducers and obstacles, Fast-growing and slow-growing segment analysis, Market growth and Forecasting, COVID 19 impact and recovery analysis and future consumer dynamics, Market condition analysis for the market forecast period

Customization purview

If our market report has not included the data that you are looking for, you can reach out to our analysts and get segments customized.

View PDF Sample

What are the Key Data Covered in this Market Forecasting Report?

  • CAGR of the market during the forecast period
  • Detailed information on factors that will drive the market growth and forecasting of the market between 2024 and 2028
  • Precise estimation of the size of the market size and its contribution to the parent market
  • Accurate predictions about upcoming market trends and analysis and changes in consumer behavior
  • Growth of the market industry across Europe, North America, APAC, South America, and Middle East and Africa
  • Thorough market growth analysis of the market’s competitive landscape and detailed information about vendors
  • Comprehensive market analysis and report on the factors that will challenge the market research and growth of market companies

We can help! Our analysts can customize this market research report to meet your requirements. 

Get in touch

1 Executive Summary

  • 1.1 Market overview
    • Executive Summary - Chart on Market Overview
    • Executive Summary - Data Table on Market Overview
    • Executive Summary - Chart on Global Market Characteristics
    • Executive Summary - Chart on Market by Geography
    • Executive Summary - Chart on Market Segmentation by Deployment
    • Executive Summary - Chart on Market Segmentation by End-user
    • Executive Summary - Chart on Incremental Growth
    • Executive Summary - Data Table on Incremental Growth
    • Executive Summary - Chart on Company Market Positioning

2 Market Landscape

  • 2.1 Market ecosystem
    • Parent Market
    • Data Table on - Parent Market
  • 2.2 Market characteristics
    • Market characteristics analysis
  • 2.3 Value chain analysis
    • Value Chain Analysis

3 Market Sizing

  • 3.1 Market definition
    • Offerings of companies included in the market definition
  • 3.2 Market segment analysis
    • Market segments
  • 3.3 Market size 2023
    • 3.4 Market outlook: Forecast for 2023-2028
      • Chart on Global - Market size and forecast 2023-2028 ($ million)
      • Data Table on Global - Market size and forecast 2023-2028 ($ million)
      • Chart on Global Market: Year-over-year growth 2023-2028 (%)
      • Data Table on Global Market: Year-over-year growth 2023-2028 (%)

    4 Historic Market Size

    • 4.1 Global Server Operating System Market 2018 - 2022
      • Historic Market Size - Data Table on Global Server Operating System Market 2018 - 2022 ($ million)
    • 4.2 Deployment segment analysis 2018 - 2022
      • Historic Market Size - Deployment Segment 2018 - 2022 ($ million)
    • 4.3 End-user segment analysis 2018 - 2022
      • Historic Market Size - End-user Segment 2018 - 2022 ($ million)
    • 4.4 Geography segment analysis 2018 - 2022
      • Historic Market Size - Geography Segment 2018 - 2022 ($ million)
    • 4.5 Country segment analysis 2018 - 2022
      • Historic Market Size - Country Segment 2018 - 2022 ($ million)

    5 Five Forces Analysis

    • 5.1 Five forces summary
      • Five forces analysis - Comparison between 2023 and 2028
    • 5.2 Bargaining power of buyers
      • Bargaining power of buyers - Impact of key factors 2023 and 2028
    • 5.3 Bargaining power of suppliers
      • Bargaining power of suppliers - Impact of key factors in 2023 and 2028
    • 5.4 Threat of new entrants
      • Threat of new entrants - Impact of key factors in 2023 and 2028
    • 5.5 Threat of substitutes
      • Threat of substitutes - Impact of key factors in 2023 and 2028
    • 5.6 Threat of rivalry
      • Threat of rivalry - Impact of key factors in 2023 and 2028
    • 5.7 Market condition
      • Chart on Market condition - Five forces 2023 and 2028

    6 Market Segmentation by Deployment

    • 6.1 Market segments
      • Chart on Deployment - Market share 2023-2028 (%)
      • Data Table on Deployment - Market share 2023-2028 (%)
    • 6.2 Comparison by Deployment
      • Chart on Comparison by Deployment
      • Data Table on Comparison by Deployment
    • 6.3 On-premises - Market size and forecast 2023-2028
      • Chart on On-premises - Market size and forecast 2023-2028 ($ million)
      • Data Table on On-premises - Market size and forecast 2023-2028 ($ million)
      • Chart on On-premises - Year-over-year growth 2023-2028 (%)
      • Data Table on On-premises - Year-over-year growth 2023-2028 (%)
    • 6.4 Cloud - Market size and forecast 2023-2028
      • Chart on Cloud - Market size and forecast 2023-2028 ($ million)
      • Data Table on Cloud - Market size and forecast 2023-2028 ($ million)
      • Chart on Cloud - Year-over-year growth 2023-2028 (%)
      • Data Table on Cloud - Year-over-year growth 2023-2028 (%)
    • 6.5 Market opportunity by Deployment
      • Market opportunity by Deployment ($ million)
      • Data Table on Market opportunity by Deployment ($ million)

    7 Market Segmentation by End-user

    • 7.1 Market segments
      • Chart on End-user - Market share 2023-2028 (%)
      • Data Table on End-user - Market share 2023-2028 (%)
    • 7.2 Comparison by End-user
      • Chart on Comparison by End-user
      • Data Table on Comparison by End-user
    • 7.3 Large enterprises - Market size and forecast 2023-2028
      • Chart on Large enterprises - Market size and forecast 2023-2028 ($ million)
      • Data Table on Large enterprises - Market size and forecast 2023-2028 ($ million)
      • Chart on Large enterprises - Year-over-year growth 2023-2028 (%)
      • Data Table on Large enterprises - Year-over-year growth 2023-2028 (%)
    • 7.4 Small and medium-sized enterprises - Market size and forecast 2023-2028
      • Chart on Small and medium-sized enterprises - Market size and forecast 2023-2028 ($ million)
      • Data Table on Small and medium-sized enterprises - Market size and forecast 2023-2028 ($ million)
      • Chart on Small and medium-sized enterprises - Year-over-year growth 2023-2028 (%)
      • Data Table on Small and medium-sized enterprises - Year-over-year growth 2023-2028 (%)
    • 7.5 Market opportunity by End-user
      • Market opportunity by End-user ($ million)
      • Data Table on Market opportunity by End-user ($ million)

    8 Customer Landscape

    • 8.1 Customer landscape overview
      • Analysis of price sensitivity, lifecycle, customer purchase basket, adoption rates, and purchase criteria

    9 Geographic Landscape

    • 9.1 Geographic segmentation
      • Chart on Market share by geography 2023-2028 (%)
      • Data Table on Market share by geography 2023-2028 (%)
    • 9.2 Geographic comparison
      • Chart on Geographic comparison
      • Data Table on Geographic comparison
    • 9.3 North America - Market size and forecast 2023-2028
      • Chart on North America - Market size and forecast 2023-2028 ($ million)
      • Data Table on North America - Market size and forecast 2023-2028 ($ million)
      • Chart on North America - Year-over-year growth 2023-2028 (%)
      • Data Table on North America - Year-over-year growth 2023-2028 (%)
    • 9.4 Europe - Market size and forecast 2023-2028
      • Chart on Europe - Market size and forecast 2023-2028 ($ million)
      • Data Table on Europe - Market size and forecast 2023-2028 ($ million)
      • Chart on Europe - Year-over-year growth 2023-2028 (%)
      • Data Table on Europe - Year-over-year growth 2023-2028 (%)
    • 9.5 APAC - Market size and forecast 2023-2028
      • Chart on APAC - Market size and forecast 2023-2028 ($ million)
      • Data Table on APAC - Market size and forecast 2023-2028 ($ million)
      • Chart on APAC - Year-over-year growth 2023-2028 (%)
      • Data Table on APAC - Year-over-year growth 2023-2028 (%)
    • 9.6 South America - Market size and forecast 2023-2028
      • Chart on South America - Market size and forecast 2023-2028 ($ million)
      • Data Table on South America - Market size and forecast 2023-2028 ($ million)
      • Chart on South America - Year-over-year growth 2023-2028 (%)
      • Data Table on South America - Year-over-year growth 2023-2028 (%)
    • 9.7 Middle East and Africa - Market size and forecast 2023-2028
      • Chart on Middle East and Africa - Market size and forecast 2023-2028 ($ million)
      • Data Table on Middle East and Africa - Market size and forecast 2023-2028 ($ million)
      • Chart on Middle East and Africa - Year-over-year growth 2023-2028 (%)
      • Data Table on Middle East and Africa - Year-over-year growth 2023-2028 (%)
    • 9.8 US - Market size and forecast 2023-2028
      • Chart on US - Market size and forecast 2023-2028 ($ million)
      • Data Table on US - Market size and forecast 2023-2028 ($ million)
      • Chart on US - Year-over-year growth 2023-2028 (%)
      • Data Table on US - Year-over-year growth 2023-2028 (%)
    • 9.9 Germany - Market size and forecast 2023-2028
      • Chart on Germany - Market size and forecast 2023-2028 ($ million)
      • Data Table on Germany - Market size and forecast 2023-2028 ($ million)
      • Chart on Germany - Year-over-year growth 2023-2028 (%)
      • Data Table on Germany - Year-over-year growth 2023-2028 (%)
    • 9.10 UK - Market size and forecast 2023-2028
      • Chart on UK - Market size and forecast 2023-2028 ($ million)
      • Data Table on UK - Market size and forecast 2023-2028 ($ million)
      • Chart on UK - Year-over-year growth 2023-2028 (%)
      • Data Table on UK - Year-over-year growth 2023-2028 (%)
    • 9.11 China - Market size and forecast 2023-2028
      • Chart on China - Market size and forecast 2023-2028 ($ million)
      • Data Table on China - Market size and forecast 2023-2028 ($ million)
      • Chart on China - Year-over-year growth 2023-2028 (%)
      • Data Table on China - Year-over-year growth 2023-2028 (%)
    • 9.12 Canada - Market size and forecast 2023-2028
      • Chart on Canada - Market size and forecast 2023-2028 ($ million)
      • Data Table on Canada - Market size and forecast 2023-2028 ($ million)
      • Chart on Canada - Year-over-year growth 2023-2028 (%)
      • Data Table on Canada - Year-over-year growth 2023-2028 (%)
    • 9.13 Market opportunity by geography
      • Market opportunity by geography ($ million)
      • Data Tables on Market opportunity by geography ($ million)

    10 Drivers, Challenges, and Opportunity/Restraints

    • 10.1 Market drivers
      • 10.2 Market challenges
        • 10.3 Impact of drivers and challenges
          • Impact of drivers and challenges in 2023 and 2028
        • 10.4 Market opportunities/restraints

          11 Competitive Landscape

          • 11.1 Overview
            • 11.2 Competitive Landscape
              • Overview on criticality of inputs and factors of differentiation
            • 11.3 Landscape disruption
              • Overview on factors of disruption
            • 11.4 Industry risks
              • Impact of key risks on business

            12 Competitive Analysis

            • 12.1 Companies profiled
              • Companies covered
            • 12.2 Market positioning of companies
              • Matrix on companies position and classification
            • 12.3 Alphabet Inc.
              • Alphabet Inc. - Overview
              • Alphabet Inc. - Business segments
              • Alphabet Inc. - Key offerings
              • Alphabet Inc. - Segment focus
            • 12.4 Amazon.com Inc.
              • Amazon.com Inc. - Overview
              • Amazon.com Inc. - Business segments
              • Amazon.com Inc. - Key news
              • Amazon.com Inc. - Key offerings
              • Amazon.com Inc. - Segment focus
            • 12.5 Canonical Ltd.
              • Canonical Ltd. - Overview
              • Canonical Ltd. - Product / Service
              • Canonical Ltd. - Key offerings
            • 12.6 Cisco Systems Inc.
              • Cisco Systems Inc. - Overview
              • Cisco Systems Inc. - Business segments
              • Cisco Systems Inc. - Key news
              • Cisco Systems Inc. - Key offerings
              • Cisco Systems Inc. - Segment focus
            • 12.7 Debian
              • Debian - Overview
              • Debian - Product / Service
              • Debian - Key offerings
            • 12.8 Dell Technologies Inc.
              • Dell Technologies Inc. - Overview
              • Dell Technologies Inc. - Business segments
              • Dell Technologies Inc. - Key news
              • Dell Technologies Inc. - Key offerings
              • Dell Technologies Inc. - Segment focus
            • 12.9 Fujitsu Ltd.
              • Fujitsu Ltd. - Overview
              • Fujitsu Ltd. - Business segments
              • Fujitsu Ltd. - Key news
              • Fujitsu Ltd. - Key offerings
              • Fujitsu Ltd. - Segment focus
            • 12.10 Hewlett Packard Enterprise Co.
              • Hewlett Packard Enterprise Co. - Overview
              • Hewlett Packard Enterprise Co. - Business segments
              • Hewlett Packard Enterprise Co. - Key news
              • Hewlett Packard Enterprise Co. - Key offerings
              • Hewlett Packard Enterprise Co. - Segment focus
            • 12.11 Huawei Technologies Co. Ltd.
              • Huawei Technologies Co. Ltd. - Overview
              • Huawei Technologies Co. Ltd. - Product / Service
              • Huawei Technologies Co. Ltd. - Key news
              • Huawei Technologies Co. Ltd. - Key offerings
            • 12.12 International Business Machines Corp.
              • International Business Machines Corp. - Overview
              • International Business Machines Corp. - Business segments
              • International Business Machines Corp. - Key news
              • International Business Machines Corp. - Key offerings
              • International Business Machines Corp. - Segment focus
            • 12.13 Microsoft Corp.
              • Microsoft Corp. - Overview
              • Microsoft Corp. - Business segments
              • Microsoft Corp. - Key news
              • Microsoft Corp. - Key offerings
              • Microsoft Corp. - Segment focus
            • 12.14 NEC Corp.
              • NEC Corp. - Overview
              • NEC Corp. - Business segments
              • NEC Corp. - Key news
              • NEC Corp. - Key offerings
              • NEC Corp. - Segment focus
            • 12.15 Oracle Corp.
              • Oracle Corp. - Overview
              • Oracle Corp. - Business segments
              • Oracle Corp. - Key news
              • Oracle Corp. - Key offerings
              • Oracle Corp. - Segment focus
            • 12.16 Suse Group
              • Suse Group - Overview
              • Suse Group - Product / Service
              • Suse Group - Key offerings
            • 12.17 Unisys Corp.
              • Unisys Corp. - Overview
              • Unisys Corp. - Business segments
              • Unisys Corp. - Key news
              • Unisys Corp. - Key offerings
              • Unisys Corp. - Segment focus

            13 Appendix

            • 13.1 Scope of the report
              • 13.2 Inclusions and exclusions checklist
                • Inclusions checklist
                • Exclusions checklist
              • 13.3 Currency conversion rates for US$
                • Currency conversion rates for US$
              • 13.4 Research methodology
                • Research methodology
              • 13.5 Data procurement
                • Information sources
              • 13.6 Data validation
                • Data validation
              • 13.7 Validation techniques employed for market sizing
                • Validation techniques employed for market sizing
              • 13.8 Data synthesis
                • Data synthesis
              • 13.9 360 degree market analysis
                • 360 degree market analysis
              • 13.10 List of abbreviations
                • List of abbreviations

              Research Methodology

              Technavio presents a detailed picture of the market by way of study, synthesis, and summation of data from multiple sources. The analysts have presented the various facets of the market with a particular focus on identifying the key industry influencers. The data thus presented is comprehensive, reliable, and the result of extensive research, both primary and secondary.

              INFORMATION SOURCES

              Primary sources

              • Manufacturers and suppliers
              • Channel partners
              • Industry experts
              • Strategic decision makers

              Secondary sources

              • Industry journals and periodicals
              • Government data
              • Financial reports of key industry players
              • Historical data
              • Press releases

              DATA ANALYSIS

              Data Synthesis

              • Collation of data
              • Estimation of key figures
              • Analysis of derived insights

              Data Validation

              • Triangulation with data models
              • Reference against proprietary databases
              • Corroboration with industry experts

              REPORT WRITING

              Qualitative

              • Market drivers
              • Market challenges
              • Market trends
              • Five forces analysis

              Quantitative

              • Market size and forecast
              • Market segmentation
              • Geographical insights
              • Competitive landscape

              Interested in this report?

              Get your sample now to see our research methodology and insights!

              Download Now

              Frequently Asked Questions

              Server Operating System market growth will increase by $ 12190.9 mn during 2024-2028.

              The Server Operating System market is expected to grow at a CAGR of 10.87% during 2024-2028.

              Server Operating System market is segmented by Deployment( On-premises, Cloud) End-user( Large enterprises, Small and medium-sized enterprises, medium-sized enterprises)

              Alphabet Inc., Amazon.com Inc., Canonical Ltd., Cisco Systems Inc., Debian, Dell Technologies Inc., FreeBSD, Fujitsu Ltd., Hewlett Packard Enterprise Co., Huawei Technologies Co. Ltd., International Business Machines Corp., Microsoft Corp., NEC Corp., Open Text Corporation, Oracle Corp., PC OpenSystems LLC, SMART Global Holdings Inc., Suse Group, Unisys Corp., VMware Inc. are a few of the key vendors in the Server Operating System market.

              North America will register the highest growth rate of 40% among the other regions. Therefore, the Server Operating System market in North America is expected to garner significant business opportunities for the vendors during the forecast period.

              US, Germany, UK, China, Canada

              • Growing investments in construction of hyper scale data centersHyperscale data centers are built to provide a scalable computer architecture to enterprises. This architecture can be combined with an enterprise's existing architecture. The architecture of a hyper scale data center consists of various small servers called nodes. Enterprises use cost-effective strategies such as including more servers in the data center with increased demand is the driving factor this market.
              • which can help reduce the initial costs of operating the data centers.Some of the major vendors in the market provide hyperscale servers for data centers. For instance is the driving factor this market.
              • AWS was one of the first vendors to offer hyper scale servers for data centers and provided approximately 40% of the available hyper scale capacity globally in 2022. Massive data centers equipped with the hyper scale servers provided by these vendors are present globally and thus need to strictly adhere to the data regulation and privacy laws imposed by the regional governments.Data center operators are continuing to expand their operations across the globe to enhance the capacity of these data centers and keep up with the growth of their cloud computing businesses. Out of the 20 leading hyper scales is the driving factor this market.
              • AWS has been the largest spender on expanding data centers is the driving factor this market.
              • followed by Microsoft and Google. For instance is the driving factor this market.
              • the annual spending of AWS on data centers across the world has grown steadily. AWS is regarded as the world's largest spender on equipping data centers globally. The Northern Virginia region has the presence of more than 50 data centers and has the largest concentration of data centers across the globe. This is due to the substantial IT infrastructure installed in the region and its strategic location near Washington is the driving factor this market.
              • DC. In 2020 is the driving factor this market.
              • AWS estimated that data center activities in the US contributed $1.3 billion to the gross domestic product (GDP) of the country. Thus is the driving factor this market.
              • the increasing investments in data centers will increase the demand for computer servers is the driving factor this market.
              • including OS. These factors will propel the growth of the global server operating system market during the forecast period. is the driving factor this market.

              The Server Operating System market vendors should focus on grabbing business opportunities from the On-premises segment as it accounted for the largest market share in the base year.
              RIA - Research AI Assistant
              Ask RIA