
Short Term Vacation Rental Market Size 2025-2029
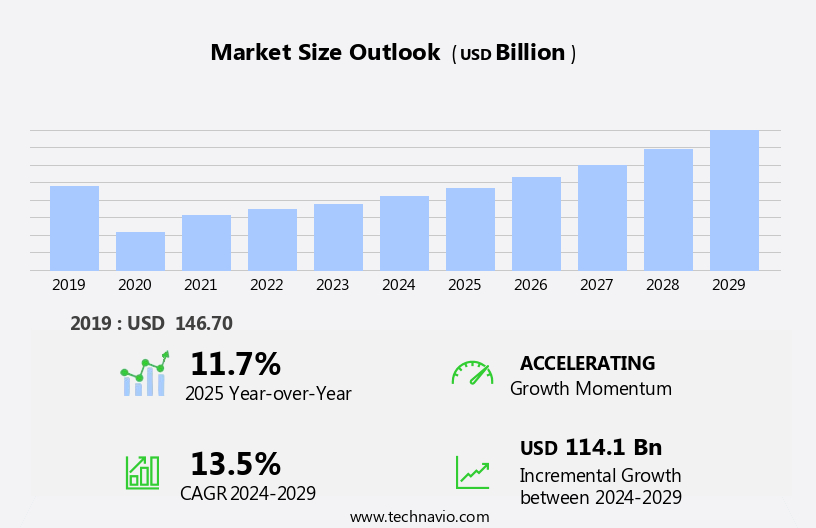
The short term vacation rental market size is forecast to increase by USD 114.1 billion, at a CAGR of 13.5% between 2024 and 2029.
- The market is experiencing significant growth, driven by the expanding tourism industry and the increasing popularity of alternative accommodation options. Travelers seek flexibility, convenience, and unique experiences, making short term rentals an attractive choice over traditional and boutique hotels. Technological advancements further enhance the market's appeal, with digital platforms simplifying the booking process and offering personalized recommendations based on traveler preferences. However, the market faces challenges in ensuring consistent quality across vacation rental properties. The lack of standardization and regulation can lead to inconsistencies in the guest experience, potentially impacting customer satisfaction and brand reputation.
- Addressing this challenge requires a commitment to quality assurance, from property maintenance and cleanliness to guest communication and support. Companies that prioritize these aspects and leverage technology to streamline operations will capitalize on the market's opportunities while navigating challenges effectively.
What will be the Size of the Short Term Vacation Rental Market during the forecast period?
Explore in-depth regional segment analysis with market size data - historical 2019-2023 and forecasts 2025-2029 - in the full report.
Request Free Sample
The short-term rental market continues to evolve, with dynamic pricing strategies shaping the landscape. Property managers employ guest management systems to optimize operations, while digital marketing and channel management tools expand reach. Email marketing and social media platforms engage guests, driving direct bookings. Property valuation relies on data analysis, including occupancy rates and revenue management. Seasonal demand influences pricing, with peak seasons offering higher yields. Energy efficiency and green initiatives attract eco-conscious travelers, while luxury rentals cater to affluent guests.
Amenities, from smart home technology to concierge services, enhance the guest experience. Calendar synchronization ensures seamless booking and maintenance services maintain property condition. Legal compliance remains crucial, with security systems and yield management tools addressing safety and revenue optimization. Budget rentals and cabin rentals cater to diverse markets, expanding the market's reach. Overall, the short-term rental market's continuous evolution reflects the industry's adaptability and innovation.
How is this Short Term Vacation Rental Industry segmented?
The short term vacation rental industry research report provides comprehensive data (region-wise segment analysis), with forecasts and estimates in "USD billion" for the period 2025-2029, as well as historical data from 2019-2023 for the following segments.
- Mode Of Booking
- Offline
- Online
- Management
- Managed by owners
- Professionally managed
- Type
- Apartments and condominiums
- Villas and luxury homes
- Cottages and cabins
- Resorts and bungalows
- Others
- Location
- Urban
- Rural
- Coastal
- Mountain
- Traveler Type
- Leisure Travelers
- Business Travelers
- Families
- Geography
- North America
- US
- Canada
- Europe
- France
- Germany
- Italy
- The Netherlands
- UK
- APAC
- China
- Japan
- Rest of World (ROW)
- North America
By Mode Of Booking Insights
The offline segment is estimated to witness significant growth during the forecast period.
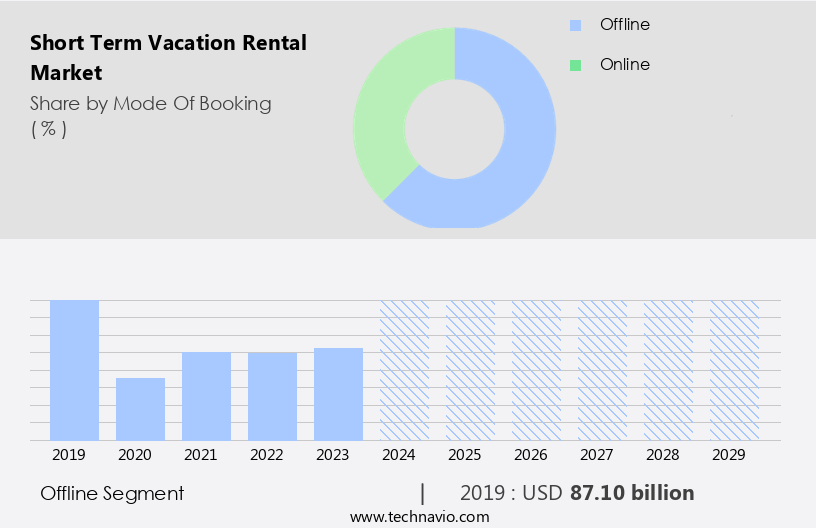
The Offline segment was valued at USD 87.10 billion in 2019 and showed a gradual increase during the forecast period.
Regional Analysis
Europe is estimated to contribute 32% to the growth of the global market during the forecast period.Technavio’s analysts have elaborately explained the regional trends and drivers that shape the market during the forecast period.

The European the market is experiencing growth due to the rising demand for travel and unique experiences. Travelers seek more personalized accommodations, leading to the popularity of short term rentals over traditional hotels. Weekend getaways and city breaks align with the trend of experiential travel, further fueling market growth. Short term rentals offer flexible options and can be cost-effective for families or groups. Pricing strategies, such as dynamic pricing and seasonal demand, influence rental income. Guest management systems, email marketing, and channel management help optimize bookings. Operating expenses include cleaning services, maintenance, and property management software. Energy efficiency and green initiatives are essential property amenities.
Smart home technology enhances the guest experience, while calendar synchronization and investment analysis aid revenue management. Legal compliance, security systems, and customer satisfaction are crucial for business success. Luxury rentals and budget options cater to diverse market segments. Short term rentals on booking platforms, such as booking.Com, can generate direct bookings and high occupancy rates. Smart meters and yield management help optimize energy usage and revenue. In summary, the European the market is thriving due to changing traveler preferences, flexible options, and cost-effectiveness.
Market Dynamics
Our researchers analyzed the data with 2024 as the base year, along with the key drivers, trends, and challenges. A holistic analysis of drivers will help companies refine their marketing strategies to gain a competitive advantage.
The global vacation rental market size and forecast projects robust growth, driven by evolving short term vacation rental market trends 2024-2028. B2B short term rental management solutions empower property managers with vacation rental property management software, optimizing operations. Smart home technology in vacation rentals enhances guest experiences, while sustainable short term rental practices align with eco-conscious trends. Vacation rental market growth opportunities 2025 highlight niches like short term rentals for digital nomads and short term rental market for business travelers. Luxury vacation rentals market insights reveal rising demand for premium stays, alongside wellness-focused vacation rental trends and pet-friendly short term rental trends. Short term rental demand in Europe 2025 is surging, despite vacation rental regulations impact 2024-2028. Vacation rental market challenges and solutions address offline booking trends in vacation rentals, with direct booking strategies for vacation rentals and vacation rental pricing strategy optimization boosting profitability. Data-driven vacation rental revenue management and short term rental market competitive analysis ensure businesses stay ahead.
In the dynamic and lucrative the market, property managers and homeowners leverage various strategies to attract travelers seeking temporary accommodations.
What are the key market drivers leading to the rise in the adoption of Short Term Vacation Rental Industry?
- The tourism industry's expansion and the rising preference for short-term rental properties are the primary market drivers.
- The market experiences significant growth due to the expanding global tourism industry. Governments worldwide have implemented strategies to promote sustainable tourism and showcase best practices, such as the G20 Tourism and SDG Dashboard launched by the Indian government in collaboration with the UNWTO in September 2023. This initiative highlights the increasing importance of tourism and its positive impact on the demand for short term vacation rentals. As the number of tourists continues to rise, the need for quality accommodation solutions increases. Consequently, property management software, cleaning services, maintenance services, concierge services, and smart home technology have become essential components of the market.
- Dynamic pricing and channel management tools help rental property owners optimize their revenue and reach a broader audience through social media marketing. Moreover, loyalty programs offer a competitive edge by providing repeat customers with exclusive benefits and incentives. The focus on enhancing the guest experience is a critical differentiator for luxury rentals, ensuring a harmonious and immersive stay for travelers. In conclusion, the growth of the global tourism industry, increasing demand for high-quality vacation rentals, and the adoption of advanced technologies are key market drivers for the market.
What are the market trends shaping the Short Term Vacation Rental Industry?
- The trend in the short-term vacation rental market is being shaped by technological advancements. Technological innovations, such as keyless entry systems, virtual check-ins, and smart home automation, are increasingly common in this sector.
- The market is experiencing significant growth due to several key factors. Advanced technologies, such as dynamic pricing algorithms, centralized management platforms, and AI-driven guest communication tools, are transforming the industry. Property owners are embracing smart home technology to enhance security, simplify operations, and cater to technologically advanced customers. For instance, approximately 70% of vacation rental managers have installed Wi-Fi/electronic locks on their properties. Furthermore, the use of business intelligence software and data mining tools is becoming increasingly popular to optimize decision-making.
- Digital marketing strategies, including guest reviews on platforms like booking.Com, also play a crucial role in attracting customers. Property valuation is influenced by seasonal demand, property amenities, and energy efficiency. As the market continues to evolve, property owners and managers must stay informed to remain competitive.
What challenges does the Short Term Vacation Rental Industry face during its growth?
- The inconsistency in delivering high-quality vacation rental properties is a significant challenge impeding the industry's growth. This issue undermines consumer trust and confidence, making it essential for providers to prioritize consistency in service delivery to foster long-term success and expansion within the vacation rental market.
- The market faces challenges in ensuring consistent guest communication and experience due to the diverse range of suppliers and customers. Inconsistencies in property quality, advertised images, and services can negatively impact customer satisfaction and trust. Direct bookings and revenue management are crucial for vacation rental providers, yet legal compliance and security systems are essential to mitigate risks. Peak season demand and yield management are key market dynamics, requiring effective strategies to optimize occupancy rates.
- Booking platforms offer convenience for customers, but suppliers must maintain high standards to compete effectively. Addressing these challenges through improved guest communication, adherence to basic living standards, and efficient services can help enhance the overall vacation rental experience and drive market growth.
Exclusive Customer Landscape
The short term vacation rental market forecasting report includes the adoption lifecycle of the market, covering from the innovator’s stage to the laggard’s stage. It focuses on adoption rates in different regions based on penetration. Furthermore, the short term vacation rental market report also includes key purchase criteria and drivers of price sensitivity to help companies evaluate and develop their market growth analysis strategies.
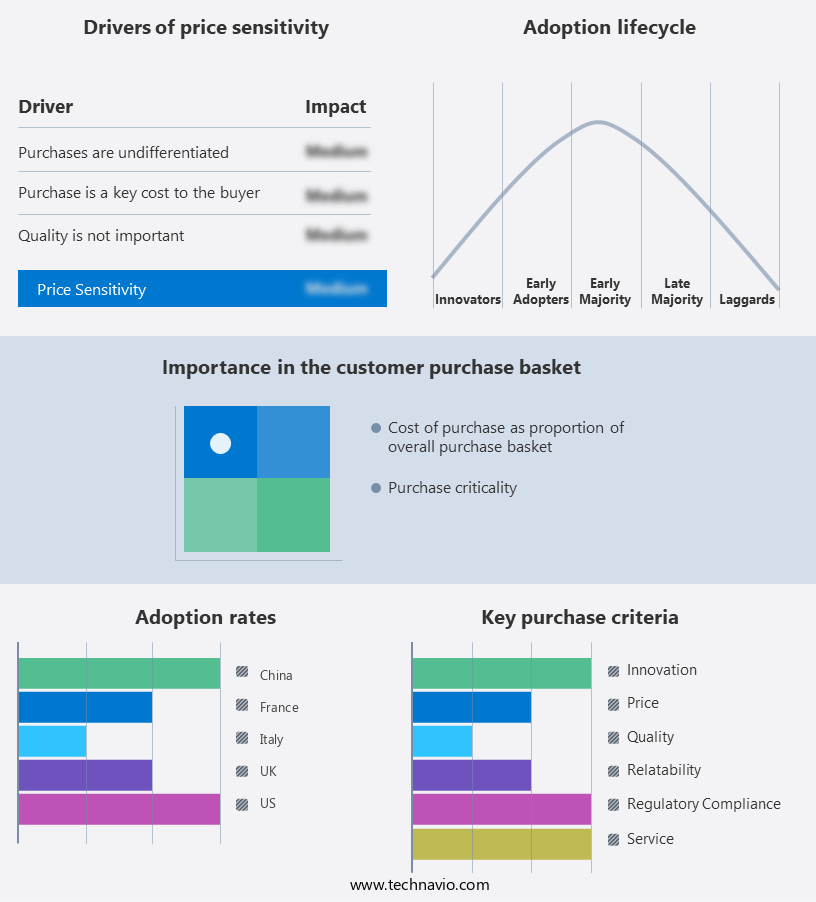
Customer Landscape
Key Companies & Market Insights
Companies are implementing various strategies, such as strategic alliances, short term vacation rental market forecast, partnerships, mergers and acquisitions, geographical expansion, and product/service launches, to enhance their presence in the industry.
9flats - This company specializes in providing short-term vacation rentals for travelers, featuring a diverse selection of private villas, bungalows, and apartments.
The industry research and growth report includes detailed analyses of the competitive landscape of the market and information about key companies, including:
- 9flats
- Agoda Homes
- Airbnb
- Booking.com
- Expedia Group
- FlipKey
- HomeAway
- Homestay
- Housetrip
- Novasol
- Onefinestay
- Sonder
- Stayz
- TripAdvisor Rentals
- TUI Villas
- Vacasa
- Vacation Home Rentals
- Vrbo
- Wimdu
- Wyndham Destinations
Qualitative and quantitative analysis of companies has been conducted to help clients understand the wider business environment as well as the strengths and weaknesses of key industry players. Data is qualitatively analyzed to categorize companies as pure play, category-focused, industry-focused, and diversified; it is quantitatively analyzed to categorize companies as dominant, leading, strong, tentative, and weak.
Recent Development and News in Short Term Vacation Rental Market
- In January 2024, Airbnb, a leading player in the short-term vacation rental market, announced the launch of its new "Airbnb Plus" service, offering guests a higher standard of accommodation with enhanced cleaning protocols and professional design consultations (Airbnb Press Release).
- In March 2024, Expedia Group's Vrbo platform entered into a strategic partnership with Marriott International, allowing Marriott's loyalty members to earn and redeem points for Vrbo bookings (Expedia Group Press Release).
- In May 2024, Sonder, a tech-enabled hospitality brand, secured a USD150 million Series E funding round, enabling further expansion of its serviced apartment offerings in the short-term rental market (Sonder Press Release).
- In January 2025, the European Union passed the European Digital Services Act, which includes regulations for short-term rental platforms, requiring them to provide more detailed information about their listings and implement stronger verification processes for hosts (European Commission Press Release).
Research Analyst Overview
- The short-term vacation rental market is characterized by a complex regulatory landscape and dynamic market trends. Legal frameworks vary significantly across jurisdictions, necessitating thorough risk management and investment strategies for portfolio diversification. Lease agreements and rental agreements must comply with local regulations, while competitor analysis tools help identify market opportunities and inform pricing optimization. Background checks and tenant screening ensure guest safety and property security. Property management companies leverage user experience (UX) design to enhance the booking process and improve guest satisfaction. Revenue forecasting and demand forecasting tools help optimize pricing and capacity planning.
- Property portfolio management software facilitates efficient property maintenance, tax compliance, and energy management. Financial modeling and credit checks enable effective financial planning and risk assessment. Community engagement and neighborhood analysis are crucial for building a strong brand and maintaining positive guest reviews. Home automation, keyless entry, and mobile app development enhance the guest experience and streamline operations. Insurance coverage, liability insurance, and guest communication platforms are essential for managing risks and fostering guest relationships. Performance measurement tools enable continuous improvement and exit strategies ensure long-term success. Property insurance and pricing optimization help mitigate risks and maximize returns.
Dive into Technavio’s robust research methodology, blending expert interviews, extensive data synthesis, and validated models for unparalleled Short Term Vacation Rental Market insights. See full methodology.
|
Market Scope |
|
|
Report Coverage |
Details |
|
Page number |
198 |
|
Base year |
2024 |
|
Historic period |
2019-2023 |
|
Forecast period |
2025-2029 |
|
Growth momentum & CAGR |
Accelerate at a CAGR of 13.5% |
|
Market growth 2025-2029 |
USD 114.1 billion |
|
Market structure |
Fragmented |
|
YoY growth 2024-2025(%) |
11.7 |
|
Key countries |
US, Germany, UK, France, Italy, Canada, China, Saudi Arabia, The Netherlands, and Japan |
|
Competitive landscape |
Leading Companies, Market Positioning of Companies, Competitive Strategies, and Industry Risks |
What are the Key Data Covered in this Short Term Vacation Rental Market Research and Growth Report?
- CAGR of the Short Term Vacation Rental industry during the forecast period
- Detailed information on factors that will drive the growth and forecasting between 2025 and 2029
- Precise estimation of the size of the market and its contribution of the industry in focus to the parent market
- Accurate predictions about upcoming growth and trends and changes in consumer behaviour
- Growth of the market across Europe, North America, APAC, Middle East and Africa, and South America
- Thorough analysis of the market’s competitive landscape and detailed information about companies
- Comprehensive analysis of factors that will challenge the short term vacation rental market growth of industry companies
We can help! Our analysts can customize this short term vacation rental market research report to meet your requirements.
 RIA -
RIA - 
