Shower Trays Market Analysis APAC, North America, Europe, South America, Middle East and Africa - US, China, Japan, UK, Germany - Size and Forecast 2024-2028

Shower Trays Market Analysis APAC, North America, Europe, South America, Middle East and Africa - US, China, Japan, UK, Germany - Size and Forecast 2024-2028

Published: Feb 2024 149 Pages SKU: IRTNTR77601

Market Overview at a Glance

$899.35 Mn
Market Opportunity
4.13%
CAGR
3.61
YoY growth 2023-2024(%)

Shower Trays Market Size 2024-2028 

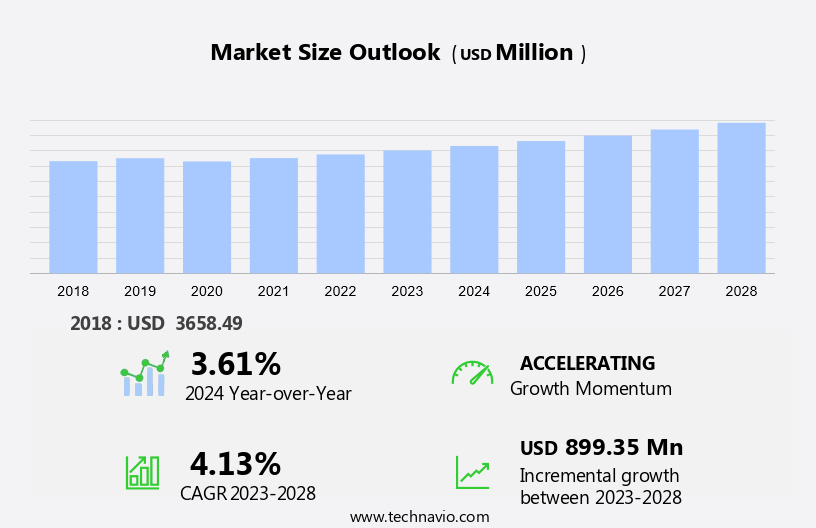
The shower trays market size is forecast to increase by USD 899.35 billion at a CAGR of 4.13% between 2023 and 2028. The market is witnessing significant growth due to the frequent launches of innovative shower tray designs by companies. Rectangular and square shapes continue to dominate the market, while cornered shower trays are gaining popularity for their space-saving benefits. A key trend in the market is the increasing demand for anti-slippery shower trays, ensuring safety and convenience for users. However, the installation complexity associated with shower trays, including the need for proper drainage ditch and water hole alignment, poses a challenge for both consumers and installers.

Overall, the market is expected to grow steadily, driven by these factors and the increasing preference for modern and functional bathroom designs. Key considerations for consumers include the material, size, and drainage system of the shower tray, while hardware such as drain covers and grates play a crucial role in ensuring proper functionality and aesthetics.

Market Analysis

Shower Trays Market Size

 Request Free Sample

The shower trays market is witnessing significant growth in the US, driven by the increasing demand for modern and functional bathroom designs. Shower trays come in various shapes and sizes, including rectangular and square, with cornered options offering a sleek and space-saving solution. Materials such as acrylic, steel, ceramic, resin, and exotic teak are commonly used in manufacturing shower trays. Acrylic and steel are popular choices due to their durability and easy maintenance, while ceramic and resin offer a more affordable alternative. Designs range from simple and minimalist to high-end, luxury options.

Moreover, shower trays with drainage ditches or water holes add a touch of sophistication, while sink-integrated models provide added convenience. The real estate sector, luxury hotels, spas, penthouse developments, designer modular homes, and tourism industries are major contributors to the market's growth. Brands focus on creating high-end products with anti-slip materials, anti-bacterial properties, and easy-to-clean surfaces to meet consumer demands. However, concerns over water leakage and improper installation can negatively impact the market. Proper maintenance and the use of sealant are essential to ensure the longevity and functionality of shower trays. In summary, the shower tray market in the US is thriving, with a focus on design, materials, and functionality driving growth.

Consumers seek durable, easy-to-clean, and stylish options, while manufacturers strive to meet these demands while addressing concerns over water leakage and improper installation.

Market Segmentation

The market research report provides comprehensive data (region-wise segment analysis), with forecasts and estimates in "USD million" for the period 2024-2028, as well as historical data from 2018-2022 for the following segments.

  • Material
    • Ceramics
    • Acrylic
    • Others
  • Distribution Channel
    • Offline
    • Online
  • Geography
    • APAC
      • China
      • Japan
    • North America
      • US
    • Europe
      • Germany
      • UK
    • South America
    • Middle East and Africa

By Material Insights

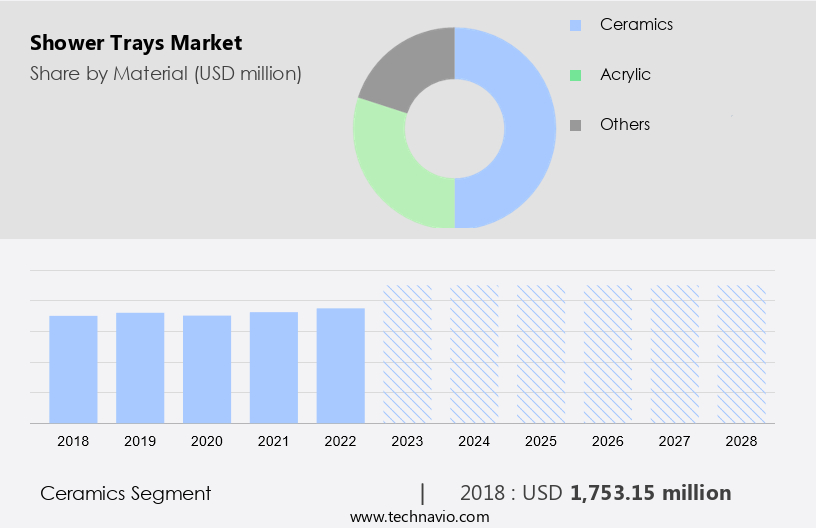
The ceramics segment is estimated to witness significant growth during the forecast period. Shower trays are an essential component of modern bathroom designs, ensuring dryness and maintaining high levels of hygiene. Among the various materials used in manufacturing shower trays, ceramic is a popular choice due to its inherent waterproof properties. This feature effectively prevents water from permeating through the surface, safeguarding the bathroom floor and subfloor from potential water damage. Ceramic shower trays boast durability and resistance to wear and tear, making them a reliable investment for homeowners. Compared to other materials, ceramic trays are less prone to cracking, chipping, or fading over time. Moreover, they offer versatility in terms of design, with various colors, shapes, and styles available to suit diverse bathroom decors.

Moreover, the sleek, glossy finish of ceramic adds an air of sophistication and elegance to the bathroom space. Ceramic's waterproof nature, coupled with its durability and aesthetic appeal, makes it a preferred choice for those seeking long-lasting and visually appealing shower tray solutions.

Shower Trays Market Size

Get a glance at the market share of various segments Request Free Sample

The ceramics segment was valued at USD 1.75 billion in 2018 and showed a gradual increase during the forecast period.

Regional Insights

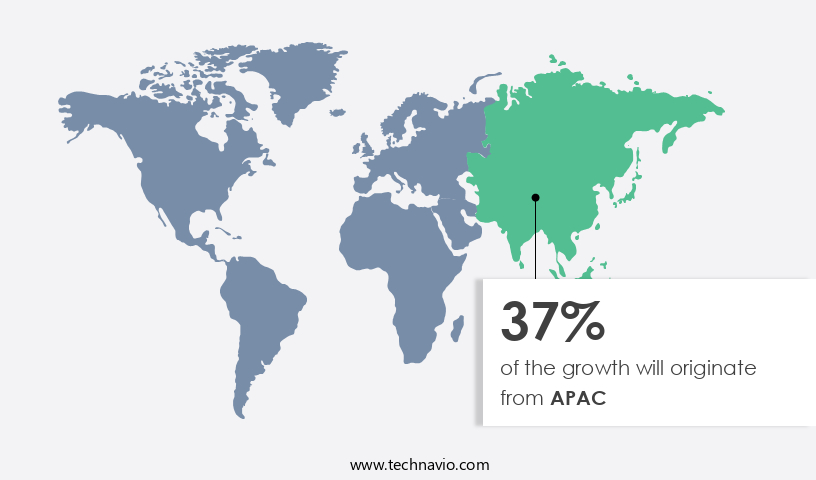
APAC is estimated to contribute 37% to the growth of the global market during the forecast period. Technavio's analysts have elaborately explained the regional trends and drivers that shape the market during the forecast period.

Shower Trays Market Share by Geography

For more insights on the market share of various regions Request Free Sample

In Asia Pacific (APAC), the ongoing urbanization process has resulted in a significant increase in construction activities, particularly in the residential and commercial sectors. This trend is driven by the region's growing middle-class population, which now has increased disposable income and a higher standard of living. Consequently, there is a surging demand for modern bathroom fixtures, including shower trays. These functional and stylish products cater to the region's evolving lifestyle preferences, which prioritize health, wellness, and personal hygiene. Shower trays provide a practical and hygienic bathing solution, especially in urban environments where space is at a premium. The market for shower trays in APAC is witnessing substantial growth due to these factors, with materials like acrylic and steel being popular choices for their durability and ease of maintenance.

Market Dynamics

Our researchers analyzed the data with 2023 as the base year, along with the key drivers, trends, and challenges. A holistic analysis of drivers will help companies refine their marketing strategies to gain a competitive advantage.

Market Driver

Frequent launches of shower trays by companies is the key driver of the market. Shower trays continue to evolve with frequent product launches, providing consumers with an array of design choices, materials, sizes, and features. This differentiation not only broadens the customer base but also offers manufacturers a competitive advantage. Innovative shower trays, such as the latest release from Acquabella in January 2023, boast an extensive color palette, with over 2,000 options from RAL and NCS systems. By introducing unique features, enhanced functionality, or superior value, manufacturers secure market share and maintain growth. Other companies, like Square, Cornered, and Drainage Ditch, also introduce new shower trays with distinct attributes, contributing to the market's expansion.

Market Trends

Growing demand for anti-slippery shower trays is the upcoming trend in the market. Shower trays play a crucial role in ensuring safety and convenience in bathrooms. Anti-slip shower trays, in particular, are gaining popularity due to their ability to provide enhanced traction and stability. With an aging population and a growing focus on accessibility, the demand for anti-slip shower trays is on the rise. These trays help prevent slips and falls, thereby addressing a significant safety concern for consumers. Manufacturers are continually innovating to improve the effectiveness of anti-slip features, ensuring that shower trays meet and exceed customer expectations. Rectangular, square, and cornered shower trays, equipped with drainage ditches or water holes, serve as functional sinks, adding to the overall safety and functionality of the bathroom space.

Market Challenge

Installation complexity associated with shower trays is a key challenge affecting the market growth. Shower trays are essential components of modern bathroom designs, available in various shapes and sizes, including rectangular and square models, as well as cornered options. The installation process, however, can be time-consuming and intrusive, especially in existing bathrooms where extensive floor preparation or structural adjustments are necessary. Homeowners may postpone their purchase decisions due to the inconvenience of lengthy installation times and disruption to daily routines. Installing shower trays demands a certain degree of proficiency, particularly in areas of plumbing, carpentry, and waterproofing. Inaccurately installed shower trays can result in problems such as leaks, water damage, or uneven surfaces, which can impair the shower enclosure's functionality and appearance.

However, the complex installations may lead to increased product returns or exchanges, as customers may find it challenging to install the shower trays themselves or encounter complications with professional installations. The installation process for shower trays involves several steps, including preparing the floor, installing the drainage ditch or water hole, and securing the shower tray in place. Each step requires precision and attention to detail to ensure a successful installation. Incorrect installation can lead to costly repairs and replacements, making it crucial to consider the expertise of professionals or invest in thorough DIY preparation and research.

Exclusive Customer Landscape

The market forecasting report includes the adoption lifecycle of the market, covering from the innovator's stage to the laggard's stage. It focuses on adoption rates in different regions based on penetration. Furthermore, the report also includes key purchase criteria and drivers of price sensitivity to help companies evaluate and develop their market growth analysis strategies.

Shower Trays Market Share by Geography

 Customer Landscape

Key Companies & Market Insights

Companies are implementing various strategies, such as strategic alliances, partnerships, mergers and acquisitions, geographical expansion, and product/service launches, to enhance their presence in the market.

Duravit AG: The company offers stone resin shower trays with upstands in rectangular, square, and quadrant shapes. Additionally, the company offers upstand stone resin trays, which come in different sizes and shapes.

The market research and growth report includes detailed analyses of the competitive landscape of the market and information about key companies, including:

  • American Bath Group
  • Ceramica Althea SPA
  • Cersanit SA
  • Coram Showers
  • Cosentino Global S.L.U
  • Drummonds
  • Eczacibasi Holding AS
  • Jaquar India
  • LIXIL Corp.
  • MX Group Ltd.
  • Novellini Spa
  • POLIMAT
  • POLYSAN s.r.o
  • Roca Sanitario SA
  • RONAL GROUP
  • SONAS
  • Villeroy and Boch AG
  • Wolseley UK
  • acquabella
  • AKW Medi Care Ltd.
  • CCL Specialist Supplies Ltd.
  • Kohler Co.
  • Roman Ltd

Qualitative and quantitative analysis of companies has been conducted to help clients understand the wider business environment as well as the strengths and weaknesses of key market players. Data is qualitatively analyzed to categorize companies as pure play, category-focused, industry-focused, and diversified; it is quantitatively analyzed to categorize companies as dominant, leading, strong, tentative, and weak.

Research Analyst Overview

Shower trays, an essential bathroom fixture, come in various shapes and sizes including rectangular and square designs with cornered or flat edges. Materials range from acrylic, steel, ceramic, resin, and exotic teak. The drainage ditch or water hole is a crucial feature ensuring water flow and preventing leakage. Anti-slip materials and anti-bacterial properties add to the hygiene and safety aspects. In the real estate sector, high-end properties prefer large, luxurious shower trays in designer shapes and sizes. In contrast, budget homes may opt for cheap substitutes. Proper installation and maintenance are vital to prevent water leakage and damage to tiles.

Moreover, the sealant plays a significant role in ensuring a leak-proof fit. Lixil and other leading market players offer digital instruments like water sensors and leakage control systems for added convenience and water conservation. Shower trays are not just functional but also contribute to brand awareness and lifestyle in luxury hotels, spas, penthouses, and designer modular homes. Despite their importance, shower trays are often overlooked, leading to issues like improper installation, slippery surfaces, and water wastage. Regular maintenance and choosing the right materials and designs can ensure a long-lasting, functional, and aesthetically pleasing bathroom fixture.

Market Scope

Report Coverage

Details

Page number

149

Base year

2023

Historic period

2018-2022

Forecast period

2024-2028

Growth momentum & CAGR

Accelerate at a CAGR of 4.13%

Market growth 2024-2028

USD 899.35 million

Market structure

Fragmented

YoY growth 2023-2024(%)

3.61

Regional analysis

APAC, North America, Europe, South America, and Middle East and Africa

Performing market contribution

APAC at 37%

Key countries

US, China, Japan, UK, and Germany

Competitive landscape

Leading Companies, Market Positioning of Companies, Competitive Strategies, and Industry Risks

Key companies profiled

American Bath Group, Ceramica Althea SPA, Cersanit SA, Coram Showers, Cosentino Global S.L.U, Drummonds, Duravit AG, Eczacibasi Holding AS, Jaquar India, LIXIL Corp., MX Group Ltd., Novellini Spa, POLIMAT, POLYSAN s.r.o, Roca Sanitario SA, RONAL GROUP, SONAS, Villeroy and Boch AG, Wolseley UK, acquabella, AKW Medi Care Ltd., CCL Specialist Supplies Ltd., Kohler Co., and Roman Ltd

Market dynamics

Parent market analysis, market growth inducers and obstacles, market forecast, fast-growing and slow-growing segment analysis, COVID-19 impact and recovery analysis and future consumer dynamics, market condition analysis for the forecast period

Customization purview

If our market report has not included the data that you are looking for, you can reach out to our analysts and get segments customized.

Request Free Sample

What are the Key Data Covered in this Market Research and Growth Report?

  • CAGR of the market during the forecast period
  • Detailed information on factors that will drive the market growth and forecasting between 2024 and 2028
  • Precise estimation of the size of the market  and its contribution of the market in focus to the parent market
  • Accurate predictions about upcoming market growth and trends and changes in consumer behaviour
  • Growth of the market across APAC, North America, Europe, South America, and Middle East and Africa
  • Thorough analysis of the market's competitive landscape and detailed information about companies
  • Comprehensive analysis of factors that will challenge the growth of market companies

We can help! Our analysts can customize this market research report to meet your requirements. Get in touch

1 Executive Summary

  • 1.1 Market overview
    • Exhibit 01: Executive Summary – Chart on Market Overview
    • Exhibit 02: Executive Summary – Data Table on Market Overview
    • Exhibit 03: Executive Summary – Chart on Global Market Characteristics
    • Exhibit 04: Executive Summary – Chart on Market by Geography
    • Exhibit 05: Executive Summary – Chart on Market Segmentation by Material
    • Exhibit 06: Executive Summary – Chart on Market Segmentation by Distribution Channel
    • Exhibit 07: Executive Summary – Chart on Incremental Growth
    • Exhibit 08: Executive Summary – Data Table on Incremental Growth
    • Exhibit 09: Executive Summary – Chart on Vendor Market Positioning

2 Market Landscape

  • 2.1 Market ecosystem
    • Exhibit 10: Parent market
    • Exhibit 11: Market Characteristics

3 Market Sizing

  • 3.1 Market definition
    • Exhibit 12: Offerings of vendors included in the market definition
  • 3.2 Market segment analysis
    • Exhibit 13: Market segments
  • 3.3 Market size 2023
    • 3.4 Market outlook: Forecast for 2023-2028
      • Exhibit 14: Chart on Global - Market size and forecast 2023-2028 ($ million)
      • Exhibit 15: Data Table on Global - Market size and forecast 2023-2028 ($ million)
      • Exhibit 16: Chart on Global Market: Year-over-year growth 2023-2028 (%)
      • Exhibit 17: Data Table on Global Market: Year-over-year growth 2023-2028 (%)

    4 Historic Market Size

    • 4.1 Global shower trays market 2018 - 2022
      • Exhibit 18: Historic Market Size – Data Table on global shower trays market 2018 - 2022 ($ million)
    • 4.2 Material Segment Analysis 2018 - 2022
      • Exhibit 19: Historic Market Size – Material Segment 2018 - 2022 ($ million)
    • 4.3 Distribution Channel Segment Analysis 2018 - 2022
      • Exhibit 20: Historic Market Size – Distribution Channel Segment 2018 - 2022 ($ million)
    • 4.4 Geography Segment Analysis 2018 - 2022
      • Exhibit 21: Historic Market Size – Geography Segment 2018 - 2022 ($ million)
    • 4.5 Country Segment Analysis 2018 - 2022
      • Exhibit 22: Historic Market Size – Country Segment 2018 - 2022 ($ million)

    5 Five Forces Analysis

    • 5.1 Five forces summary
      • Exhibit 23: Five forces analysis - Comparison between 2023 and 2028
    • 5.2 Bargaining power of buyers
      • Exhibit 24: Chart on Bargaining power of buyers – Impact of key factors 2023 and 2028
    • 5.3 Bargaining power of suppliers
      • Exhibit 25: Bargaining power of suppliers – Impact of key factors in 2023 and 2028
    • 5.4 Threat of new entrants
      • Exhibit 26: Threat of new entrants – Impact of key factors in 2023 and 2028
    • 5.5 Threat of substitutes
      • Exhibit 27: Threat of substitutes – Impact of key factors in 2023 and 2028
    • 5.6 Threat of rivalry
      • Exhibit 28: Threat of rivalry – Impact of key factors in 2023 and 2028
    • 5.7 Market condition
      • Exhibit 29: Chart on Market condition - Five forces 2023 and 2028

    6 Market Segmentation by Material

    • 6.1 Market segments
      • Exhibit 30: Chart on Material - Market share 2023-2028 (%)
      • Exhibit 31: Data Table on Material - Market share 2023-2028 (%)
    • 6.2 Comparison by Material
      • Exhibit 32: Chart on Comparison by Material
      • Exhibit 33: Data Table on Comparison by Material
    • 6.3 Ceramics - Market size and forecast 2023-2028
      • Exhibit 34: Chart on Ceramics - Market size and forecast 2023-2028 ($ million)
      • Exhibit 35: Data Table on Ceramics - Market size and forecast 2023-2028 ($ million)
      • Exhibit 36: Chart on Ceramics - Year-over-year growth 2023-2028 (%)
      • Exhibit 37: Data Table on Ceramics - Year-over-year growth 2023-2028 (%)
    • 6.4 Acrylic - Market size and forecast 2023-2028
      • Exhibit 38: Chart on Acrylic - Market size and forecast 2023-2028 ($ million)
      • Exhibit 39: Data Table on Acrylic - Market size and forecast 2023-2028 ($ million)
      • Exhibit 40: Chart on Acrylic - Year-over-year growth 2023-2028 (%)
      • Exhibit 41: Data Table on Acrylic - Year-over-year growth 2023-2028 (%)
    • 6.5 Others - Market size and forecast 2023-2028
      • Exhibit 42: Chart on Others - Market size and forecast 2023-2028 ($ million)
      • Exhibit 43: Data Table on Others - Market size and forecast 2023-2028 ($ million)
      • Exhibit 44: Chart on Others - Year-over-year growth 2023-2028 (%)
      • Exhibit 45: Data Table on Others - Year-over-year growth 2023-2028 (%)
    • 6.6 Market opportunity by Material
      • Exhibit 46: Market opportunity by Material ($ million)
      • Exhibit 47: Data Table on Market opportunity by Material ($ million)

    7 Market Segmentation by Distribution Channel

    • 7.1 Market segments
      • Exhibit 48: Chart on Distribution Channel - Market share 2023-2028 (%)
      • Exhibit 49: Data Table on Distribution Channel - Market share 2023-2028 (%)
    • 7.2 Comparison by Distribution Channel
      • Exhibit 50: Chart on Comparison by Distribution Channel
      • Exhibit 51: Data Table on Comparison by Distribution Channel
    • 7.3 Offline - Market size and forecast 2023-2028
      • Exhibit 52: Chart on Offline - Market size and forecast 2023-2028 ($ million)
      • Exhibit 53: Data Table on Offline - Market size and forecast 2023-2028 ($ million)
      • Exhibit 54: Chart on Offline - Year-over-year growth 2023-2028 (%)
      • Exhibit 55: Data Table on Offline - Year-over-year growth 2023-2028 (%)
    • 7.4 Online - Market size and forecast 2023-2028
      • Exhibit 56: Chart on Online - Market size and forecast 2023-2028 ($ million)
      • Exhibit 57: Data Table on Online - Market size and forecast 2023-2028 ($ million)
      • Exhibit 58: Chart on Online - Year-over-year growth 2023-2028 (%)
      • Exhibit 59: Data Table on Online - Year-over-year growth 2023-2028 (%)
    • 7.5 Market opportunity by Distribution Channel
      • Exhibit 60: Market opportunity by Distribution Channel ($ million)
      • Exhibit 61: Data Table on Market opportunity by Distribution Channel ($ million)

    8 Customer Landscape

    • 8.1 Customer landscape overview
      • Exhibit 62: Analysis of price sensitivity, lifecycle, customer purchase basket, adoption rates, and purchase criteria

    9 Geographic Landscape

    • 9.1 Geographic segmentation
      • Exhibit 63: Chart on Market share by geography 2023-2028 (%)
      • Exhibit 64: Data Table on Market share by geography 2023-2028 (%)
    • 9.2 Geographic comparison
      • Exhibit 65: Chart on Geographic comparison
      • Exhibit 66: Data Table on Geographic comparison
    • 9.3 APAC - Market size and forecast 2023-2028
      • Exhibit 67: Chart on APAC - Market size and forecast 2023-2028 ($ million)
      • Exhibit 68: Data Table on APAC - Market size and forecast 2023-2028 ($ million)
      • Exhibit 69: Chart on APAC - Year-over-year growth 2023-2028 (%)
      • Exhibit 70: Data Table on APAC - Year-over-year growth 2023-2028 (%)
    • 9.4 North America - Market size and forecast 2023-2028
      • Exhibit 71: Chart on North America - Market size and forecast 2023-2028 ($ million)
      • Exhibit 72: Data Table on North America - Market size and forecast 2023-2028 ($ million)
      • Exhibit 73: Chart on North America - Year-over-year growth 2023-2028 (%)
      • Exhibit 74: Data Table on North America - Year-over-year growth 2023-2028 (%)
    • 9.5 Europe - Market size and forecast 2023-2028
      • Exhibit 75: Chart on Europe - Market size and forecast 2023-2028 ($ million)
      • Exhibit 76: Data Table on Europe - Market size and forecast 2023-2028 ($ million)
      • Exhibit 77: Chart on Europe - Year-over-year growth 2023-2028 (%)
      • Exhibit 78: Data Table on Europe - Year-over-year growth 2023-2028 (%)
    • 9.6 South America - Market size and forecast 2023-2028
      • Exhibit 79: Chart on South America - Market size and forecast 2023-2028 ($ million)
      • Exhibit 80: Data Table on South America - Market size and forecast 2023-2028 ($ million)
      • Exhibit 81: Chart on South America - Year-over-year growth 2023-2028 (%)
      • Exhibit 82: Data Table on South America - Year-over-year growth 2023-2028 (%)
    • 9.7 Middle East and Africa - Market size and forecast 2023-2028
      • Exhibit 83: Chart on Middle East and Africa - Market size and forecast 2023-2028 ($ million)
      • Exhibit 84: Data Table on Middle East and Africa - Market size and forecast 2023-2028 ($ million)
      • Exhibit 85: Chart on Middle East and Africa - Year-over-year growth 2023-2028 (%)
      • Exhibit 86: Data Table on Middle East and Africa - Year-over-year growth 2023-2028 (%)
    • 9.8 US - Market size and forecast 2023-2028
      • Exhibit 87: Chart on US - Market size and forecast 2023-2028 ($ million)
      • Exhibit 88: Data Table on US - Market size and forecast 2023-2028 ($ million)
      • Exhibit 89: Chart on US - Year-over-year growth 2023-2028 (%)
      • Exhibit 90: Data Table on US - Year-over-year growth 2023-2028 (%)
    • 9.9 China - Market size and forecast 2023-2028
      • Exhibit 91: Chart on China - Market size and forecast 2023-2028 ($ million)
      • Exhibit 92: Data Table on China - Market size and forecast 2023-2028 ($ million)
      • Exhibit 93: Chart on China - Year-over-year growth 2023-2028 (%)
      • Exhibit 94: Data Table on China - Year-over-year growth 2023-2028 (%)
    • 9.10 UK - Market size and forecast 2023-2028
      • Exhibit 95: Chart on UK - Market size and forecast 2023-2028 ($ million)
      • Exhibit 96: Data Table on UK - Market size and forecast 2023-2028 ($ million)
      • Exhibit 97: Chart on UK - Year-over-year growth 2023-2028 (%)
      • Exhibit 98: Data Table on UK - Year-over-year growth 2023-2028 (%)
    • 9.11 Germany - Market size and forecast 2023-2028
      • Exhibit 99: Chart on Germany - Market size and forecast 2023-2028 ($ million)
      • Exhibit 100: Data Table on Germany - Market size and forecast 2023-2028 ($ million)
      • Exhibit 101: Chart on Germany - Year-over-year growth 2023-2028 (%)
      • Exhibit 102: Data Table on Germany - Year-over-year growth 2023-2028 (%)
    • 9.12 Japan - Market size and forecast 2023-2028
      • Exhibit 103: Chart on Japan - Market size and forecast 2023-2028 ($ million)
      • Exhibit 104: Data Table on Japan - Market size and forecast 2023-2028 ($ million)
      • Exhibit 105: Chart on Japan - Year-over-year growth 2023-2028 (%)
      • Exhibit 106: Data Table on Japan - Year-over-year growth 2023-2028 (%)
    • 9.13 Market opportunity by geography
      • Exhibit 107: Market opportunity by geography ($ million)
      • Exhibit 108: Data Tables on Market opportunity by geography ($ million)

    10 Drivers, Challenges, and Trends

    • 10.1 Market drivers
      • 10.2 Market challenges
        • 10.3 Impact of drivers and challenges
          • Exhibit 109: Impact of drivers and challenges in 2023 and 2028
        • 10.4 Market trends

          11 Vendor Landscape

          • 11.1 Overview
            • 11.2 Vendor landscape
              • Exhibit 110: Overview on Criticality of inputs and Factors of differentiation
            • 11.3 Landscape disruption
              • Exhibit 111: Overview on factors of disruption
            • 11.4 Industry risks
              • Exhibit 112: Impact of key risks on business

            12 Vendor Analysis

            • 12.1 Vendors covered
              • Exhibit 113: Vendors covered
            • 12.2 Market positioning of vendors
              • Exhibit 114: Matrix on vendor position and classification
            • 12.3 American Bath Group
              • Exhibit 115: American Bath Group - Overview
              • Exhibit 116: American Bath Group - Product / Service
              • Exhibit 117: American Bath Group - Key offerings
            • 12.4 Ceramica Althea SPA
              • Exhibit 118: Ceramica Althea SPA - Overview
              • Exhibit 119: Ceramica Althea SPA - Product / Service
              • Exhibit 120: Ceramica Althea SPA - Key offerings
            • 12.5 Coram Showers
              • Exhibit 121: Coram Showers - Overview
              • Exhibit 122: Coram Showers - Product / Service
              • Exhibit 123: Coram Showers - Key offerings
            • 12.6 Drummonds
              • Exhibit 124: Drummonds - Overview
              • Exhibit 125: Drummonds - Product / Service
              • Exhibit 126: Drummonds - Key offerings
            • 12.7 Duravit AG
              • Exhibit 127: Duravit AG - Overview
              • Exhibit 128: Duravit AG - Product / Service
              • Exhibit 129: Duravit AG - Key offerings
            • 12.8 Eczacibasi Holding AS
              • Exhibit 130: Eczacibasi Holding AS - Overview
              • Exhibit 131: Eczacibasi Holding AS - Product / Service
              • Exhibit 132: Eczacibasi Holding AS - Key offerings
            • 12.9 LIXIL Corp.
              • Exhibit 133: LIXIL Corp. - Overview
              • Exhibit 134: LIXIL Corp. - Business segments
              • Exhibit 135: LIXIL Corp. - Key offerings
              • Exhibit 136: LIXIL Corp. - Segment focus
            • 12.10 MX Group Ltd.
              • Exhibit 137: MX Group Ltd. - Overview
              • Exhibit 138: MX Group Ltd. - Product / Service
              • Exhibit 139: MX Group Ltd. - Key offerings
            • 12.11 Novellini Spa
              • Exhibit 140: Novellini Spa - Overview
              • Exhibit 141: Novellini Spa - Product / Service
              • Exhibit 142: Novellini Spa - Key offerings
            • 12.12 POLIMAT
              • Exhibit 143: POLIMAT - Overview
              • Exhibit 144: POLIMAT - Product / Service
              • Exhibit 145: POLIMAT - Key offerings
            • 12.13 POLYSAN s.r.o
              • Exhibit 146: POLYSAN s.r.o - Overview
              • Exhibit 147: POLYSAN s.r.o - Product / Service
              • Exhibit 148: POLYSAN s.r.o - Key offerings
            • 12.14 RONAL GROUP
              • Exhibit 149: RONAL GROUP - Overview
              • Exhibit 150: RONAL GROUP - Product / Service
              • Exhibit 151: RONAL GROUP - Key offerings
            • 12.15 SONAS
              • Exhibit 152: SONAS - Overview
              • Exhibit 153: SONAS - Product / Service
              • Exhibit 154: SONAS - Key offerings
            • 12.16 Villeroy and Boch AG
              • Exhibit 155: Villeroy and Boch AG - Overview
              • Exhibit 156: Villeroy and Boch AG - Business segments
              • Exhibit 157: Villeroy and Boch AG - Key offerings
              • Exhibit 158: Villeroy and Boch AG - Segment focus
            • 12.17 Wolseley UK
              • Exhibit 159: Wolseley UK - Overview
              • Exhibit 160: Wolseley UK - Product / Service
              • Exhibit 161: Wolseley UK - Key offerings

            13 Appendix

            • 13.1 Scope of the report
              • 13.2 Inclusions and exclusions checklist
                • Exhibit 162: Inclusions checklist
                • Exhibit 163: Exclusions checklist
              • 13.3 Currency conversion rates for US$
                • Exhibit 164: Currency conversion rates for US$
              • 13.4 Research methodology
                • Exhibit 165: Research methodology
                • Exhibit 166: Validation techniques employed for market sizing
                • Exhibit 167: Information sources
              • 13.5 List of abbreviations
                • Exhibit 168: List of abbreviations

              Research Methodology

              Technavio presents a detailed picture of the market by way of study, synthesis, and summation of data from multiple sources. The analysts have presented the various facets of the market with a particular focus on identifying the key industry influencers. The data thus presented is comprehensive, reliable, and the result of extensive research, both primary and secondary.

              INFORMATION SOURCES

              Primary sources

              • Manufacturers and suppliers
              • Channel partners
              • Industry experts
              • Strategic decision makers

              Secondary sources

              • Industry journals and periodicals
              • Government data
              • Financial reports of key industry players
              • Historical data
              • Press releases

              DATA ANALYSIS

              Data Synthesis

              • Collation of data
              • Estimation of key figures
              • Analysis of derived insights

              Data Validation

              • Triangulation with data models
              • Reference against proprietary databases
              • Corroboration with industry experts

              REPORT WRITING

              Qualitative

              • Market drivers
              • Market challenges
              • Market trends
              • Five forces analysis

              Quantitative

              • Market size and forecast
              • Market segmentation
              • Geographical insights
              • Competitive landscape

              Interested in this report?

              Get your sample now to see our research methodology and insights!

              Download Now

              Frequently Asked Questions

              Shower Trays market growth will increase by $ 899.35 mn during 2024-2028.

              The Shower Trays market is expected to grow at a CAGR of 4.13% during 2024-2028.

              Shower Trays market is segmented by Material( Ceramics, Acrylic, Others) Distribution Channel( Offline, Online)

              American Bath Group, Ceramica Althea SPA, Cersanit SA, Coram Showers, Cosentino Global S.L.U, Drummonds, Duravit AG, Eczacibasi Holding AS, Jaquar India, LIXIL Corp., MX Group Ltd., Novellini Spa, POLIMAT, POLYSAN s.r.o, Roca Sanitario SA, RONAL GROUP, SONAS, Villeroy and Boch AG, Wolseley UK, acquabella, AKW Medi Care Ltd., CCL Specialist Supplies Ltd., Kohler Co., Roman Ltd are a few of the key vendors in the Shower Trays market.

              APAC will register the highest growth rate of 37% among the other regions. Therefore, the Shower Trays market in APAC is expected to garner significant business opportunities for the vendors during the forecast period.

              US, China, Japan, UK, Germany

              • Frequent launches of shower trays by vendorsFrequent launches of shower tray allow manufacturers to introduce a variety of designs is the driving factor this market.
              • materials is the driving factor this market.
              • sizes is the driving factor this market.
              • and features is the driving factor this market.
              • catering to diverse consumer preferences. This differentiation helps attract a wider range of customers and expands market reach. Continuous innovation and frequent product launches give companies a competitive edge in the market. By offering unique features is the driving factor this market.
              • improved performance is the driving factor this market.
              • or better value compared with competitors is the driving factor this market.
              • manufacturers can capture market share and sustain growth momentum. Some of the recent instances of launch are given below: In January 2023 is the driving factor this market.
              • Acquabella launched the latest shower tray. The new shower tray is available in a wide variety of colors is the driving factor this market.
              • from classic greys and beiges to a full range of over 2 is the driving factor this market.
              • 000 RAL(Reichs-Ausschuss fur Lieferbedingungen)/NCS(Natural Color System) options. In January 2022 is the driving factor this market.
              • CCL Building Products launched a new shower tray. This new Garla shower tray is an elegantly sleek and stylish addition to the product portfolio. In April 2022 is the driving factor this market.
              • AKW launched an easy-to-install shower tray for visual impairments consumers. With this launch is the driving factor this market.
              • the company is focused on expanding its product portfolio. Regular product launches provide opportunities for manufacturers to gather feedback from customers and incorporate improvements or modifications into future iterations. This customer-centric approach enhances product quality is the driving factor this market.
              • satisfaction is the driving factor this market.
              • and loyalty is the driving factor this market.
              • driving sustained market growth. Thus is the driving factor this market.
              • frequent launches in the global shower trays market will play a crucial role in stimulating demand is the driving factor this market.
              • fostering innovation is the driving factor this market.
              • and driving market growth during the forecast period. is the driving factor this market.

              The Shower Trays market vendors should focus on grabbing business opportunities from the Ceramics segment as it accounted for the largest market share in the base year.