Silicone Elastomers Market Size 2026-2030
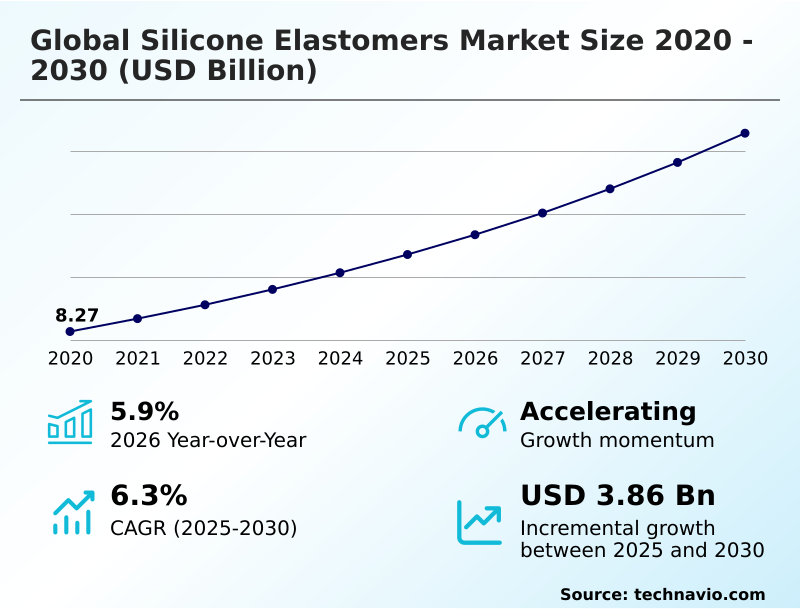
The silicone elastomers market size is valued to increase by USD 3.86 billion, at a CAGR of 6.3% from 2025 to 2030. Increasing demand for hip and knee implants will drive the silicone elastomers market.
Major Market Trends & Insights
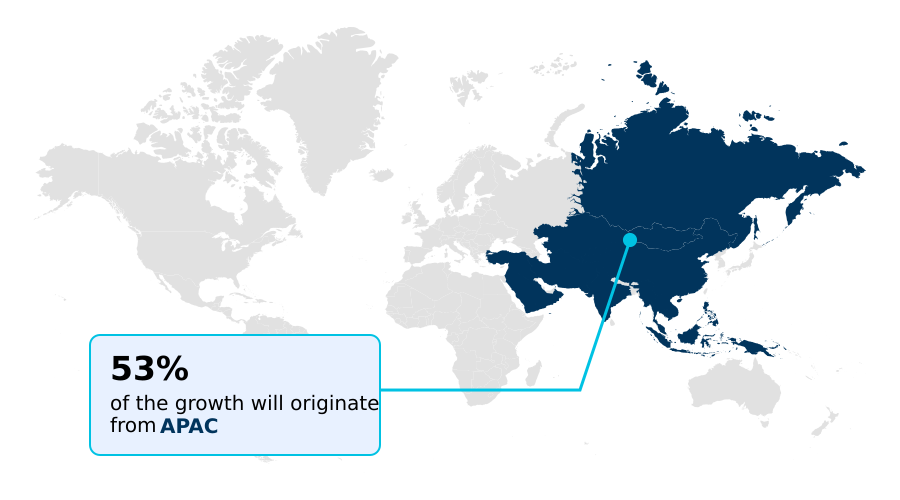
- APAC dominated the market and accounted for a 53.1% growth during the forecast period.
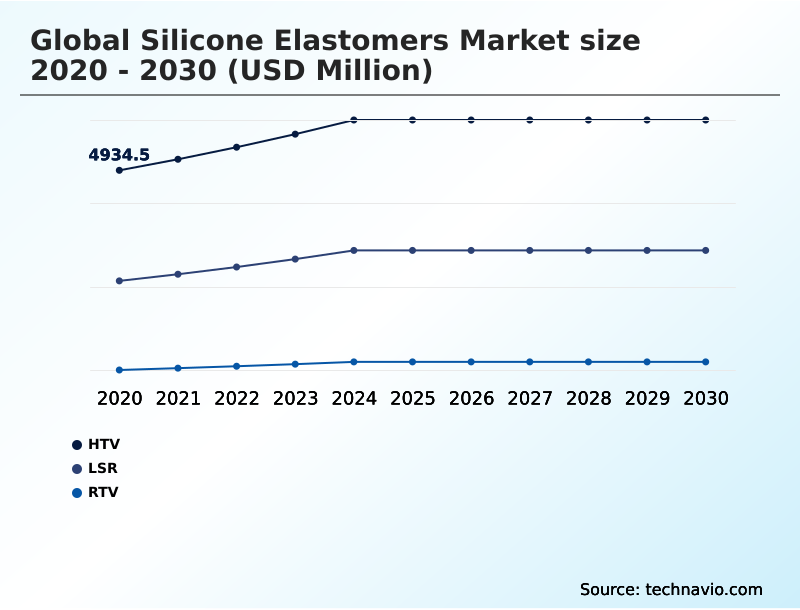
- By Product - HTV segment was valued at USD 6.00 billion in 2024
- By End-user - Construction segment accounted for the largest market revenue share in 2024
Market Size & Forecast
- Market Opportunities: USD 6.31 billion
- Market Future Opportunities: USD 3.86 billion
- CAGR from 2025 to 2030 : 6.3%
Market Summary
- The silicone elastomers market is driven by the intrinsic superior properties of these materials, including thermal stability, chemical resistance, and flexibility, making them indispensable across the automotive, electronics, and healthcare sectors. A key market dynamic is the persistent demand for lightweight materials to enhance energy efficiency, particularly in electric vehicles and aerospace.
- This intersects with the growing trend of adopting 3d printable silicone for rapid prototyping and creating complex, customized components. For instance, a medical device manufacturer must navigate stringent clinical policies for a new implant-grade silicone, which requires extensive biocompatibility testing and can extend development timelines. This scenario highlights the central challenge of balancing innovation with rigorous regulatory compliance.
- The market also grapples with raw material price volatility, which affects production costs for materials like organomodified silicones and versatile crosslinkers, compelling companies to adopt agile supply chain strategies to maintain profitability while delivering high-performance products such as those used in next-generation flexible displays.
What will be the Size of the Silicone Elastomers Market during the forecast period?
Get Key Insights on Market Forecast (PDF) Get Free Sample
How is the Silicone Elastomers Market Segmented?
The silicone elastomers industry research report provides comprehensive data (region-wise segment analysis), with forecasts and estimates in "USD million" for the period 2026-2030, as well as historical data from 2020-2024 for the following segments.
- Product
- HTV
- LSR
- RTV
- End-user
- Construction
- Automotive
- Electrical and electronics
- Consumer goods
- Others
- Method
- Compression molding
- Liquid injection molding
- Injection molding
- Extrusion
- Geography
- APAC
- China
- Japan
- India
- North America
- US
- Canada
- Mexico
- Europe
- Germany
- UK
- France
- Middle East and Africa
- Saudi Arabia
- UAE
- South Africa
- South America
- Brazil
- Argentina
- Rest of World (ROW)
- APAC
By Product Insights
The htv segment is estimated to witness significant growth during the forecast period.
High-Temperature Vulcanized (HTV) silicone elastomers, a form of high consistency rubber, are pivotal in industrial sectors where thermal stability and mechanical strength are paramount.
This segment's growth is propelled by its use in automotive gaskets, industrial seals, and high-voltage electric vehicle components, where performance under extreme conditions is non-negotiable.
Innovations in precision curing and the development of specialized silicone-based performance additives are enhancing material properties like tear resistance. While liquid silicone rubber is preferred for medical micro-components, HTV excels in larger aerospace and medical components.
The APAC region, contributing over 53% of the market's incremental growth, is a dominant force, fueled by its expansive manufacturing and industrial base, further driving demand for these robust materials.
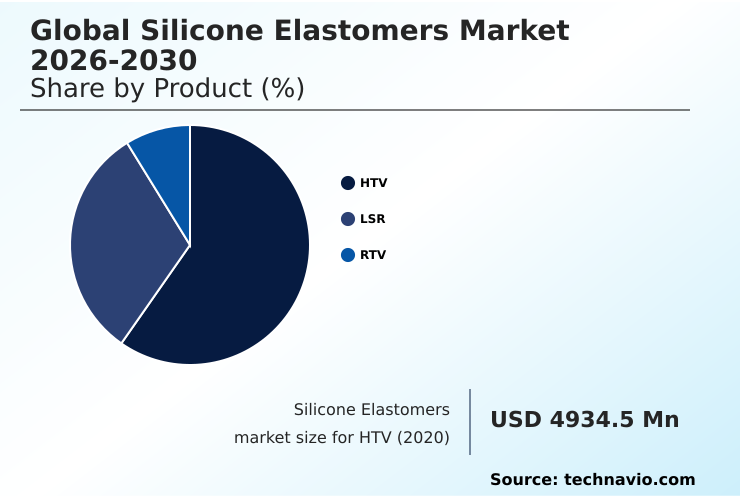
The HTV segment was valued at USD 6.00 billion in 2024 and showed a gradual increase during the forecast period.
Regional Analysis
APAC is estimated to contribute 53.1% to the growth of the global market during the forecast period.Technavio’s analysts have elaborately explained the regional trends and drivers that shape the market during the forecast period.
See How Silicone Elastomers Market Demand is Rising in APAC Get Free Sample
The geographic landscape is led by the APAC region, which is set to expand at a rate of 6.6% and accounts for 53.1% of the market's incremental growth.
This dominance is fueled by robust industrial electronics and semiconductor packaging sectors in countries like China, Japan, and South Korea. Demand is high for materials offering superior electronic applications insulation.
The region is a hub for innovation in optical-grade silicone elastomers used in automotive led lighting and next-generation flexible displays. Formulations using high-temperature vulcanized materials and processes like room temperature vulcanization are common.
Advanced manufacturers are leveraging AI-assisted material design and versatile crosslinkers to meet the stringent requirements of these high-tech industries, solidifying APAC's position as a critical center for both production and consumption.
Market Dynamics
Our researchers analyzed the data with 2025 as the base year, along with the key drivers, trends, and challenges. A holistic analysis of drivers will help companies refine their marketing strategies to gain a competitive advantage.
- The silicone elastomers market is evolving beyond conventional applications, driven by highly specialized demands in emerging technology sectors. The development of silicone elastomer for soft robotics is enabling new possibilities in automation and human-machine interaction, where flexibility and durability are paramount.
- Simultaneously, the advent of 3d printable medical grade wearables is revolutionizing personalized healthcare, allowing for on-demand fabrication of patient-specific devices with complex geometries. In the automotive industry, lightweight automotive sealing elastomers are critical for enhancing electric vehicle efficiency by reducing overall weight and ensuring superior sealing performance.
- The consumer electronics sector benefits from highly transparent elastomers for displays, which provide exceptional optical clarity and protection for next-generation flexible and foldable screens. Furthermore, the push for enhanced hygiene in clinical settings has spurred the creation of antimicrobial elastomers for medical devices, which inhibit microbial growth and improve patient safety.
- The R&D investment for these specialized materials is significant, with development cycles for medical-grade products being up to 50% longer than for automotive-grade materials due to rigorous validation and regulatory hurdles, impacting supply chain planning and go-to-market strategies.
What are the key market drivers leading to the rise in the adoption of Silicone Elastomers Industry?
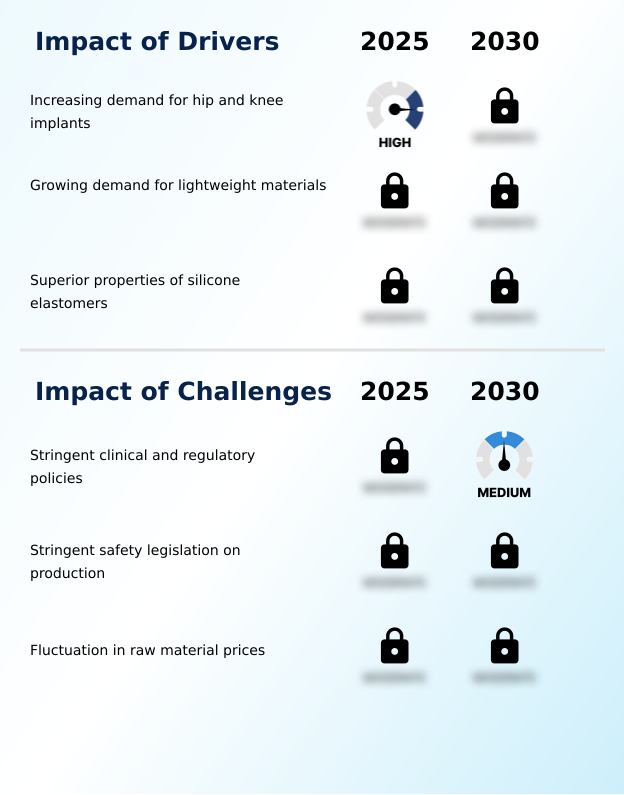
- Increasing demand for hip and knee implants, which require biocompatible and durable materials, is a significant driver for the market.
- Significant drivers are propelling market expansion, primarily the demand for lightweight silicone elastomer solutions in the automotive sector, which can contribute to a 3-5% improvement in vehicle efficiency.
- The medical field is another major driver, with a growing need for biocompatible durable medical devices made from implant-grade silicone and high-purity silicone materials.
- Innovations in advanced compounding and the use of organomodified silicones have led to low viscosity elastomers with enhanced performance. These materials enable a 20% increase in tensile strength, which is critical for high-performance sealing and automotive sealing applications.
- The superior properties of these materials ensure their continued adoption in critical sectors where reliability and longevity are essential for operational success.
What are the market trends shaping the Silicone Elastomers Industry?
- The adoption of antimicrobial silicone elastomers is an emerging trend. This development is driven by heightened hygiene standards in sensitive environments.
- Key trends are reshaping the market, led by the development of antimicrobial silicone elastomer solutions that inhibit microbial growth, with some silver ion technologies reducing surface bacteria by over 99%. The adoption of 3d printable silicone is accelerating prototyping, where advanced photopolymerization techniques are cutting development cycles by up to 30%.
- In electronics, highly transparent silicone is enabling innovation in flexible display technology and soft robotics components, offering superior optical clarity and durability. The creation of thermoplastic silicone with non-leaching characteristics and formulations incorporating bioactive materials is also gaining traction, particularly in consumer and medical applications where safety is paramount.
- These trends reflect a market-wide shift toward materials that offer enhanced functionality, faster production, and improved safety profiles.
What challenges does the Silicone Elastomers Industry face during its growth?
- Stringent clinical and regulatory policies pose a significant challenge to the market, particularly impacting development costs and time-to-market for medical-grade products.
- The market faces persistent challenges, notably the volatility of raw material prices, such as for methylsiloxane feedstocks and siloxane, which can impact profit margins by up to 10% in a single quarter. Stringent regulatory pathways for products like medical-grade two-part silicone elastomer can extend development timelines by more than 18 months, adding significant costs.
- Production of cosmetic-grade silicone and peroxide-curing hcr requires adherence to strict safety legislation, increasing operational overhead. Furthermore, ensuring the reliability of weather-resistant structural components, industrial maintenance coatings, and construction sealants demands rigorous quality control. The supply chain for specialized products like high-pressure medical tubing and ev cable insulation is also complex, making it difficult to maintain consistent supply and pricing.
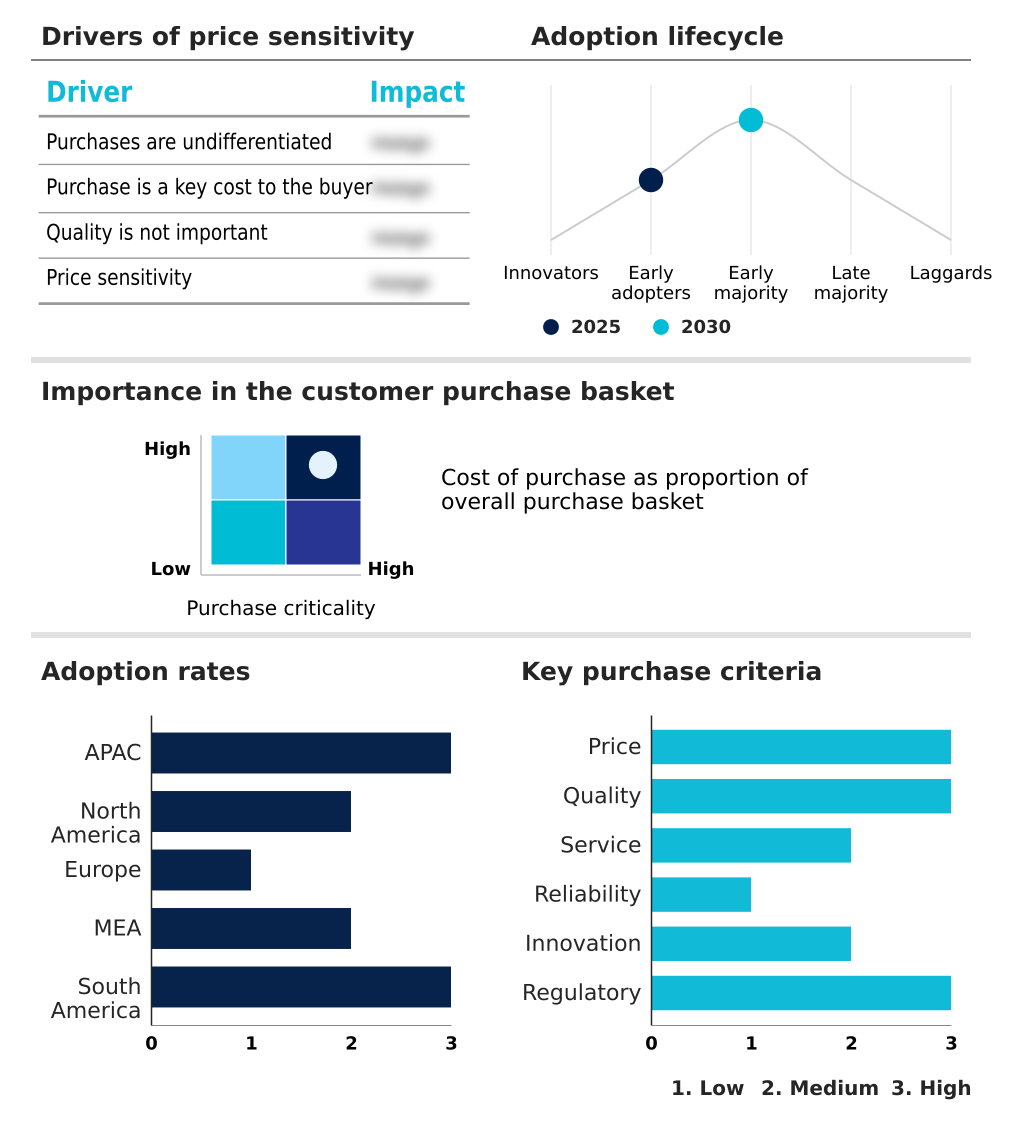
Exclusive Technavio Analysis on Customer Landscape
The silicone elastomers market forecasting report includes the adoption lifecycle of the market, covering from the innovator’s stage to the laggard’s stage. It focuses on adoption rates in different regions based on penetration. Furthermore, the silicone elastomers market report also includes key purchase criteria and drivers of price sensitivity to help companies evaluate and develop their market growth analysis strategies.
Customer Landscape of Silicone Elastomers Industry
Competitive Landscape
Companies are implementing various strategies, such as strategic alliances, silicone elastomers market forecast, partnerships, mergers and acquisitions, geographical expansion, and product/service launches, to enhance their presence in the industry.
Avantor Inc. - Offerings encompass advanced silicone elastomers, including two-part systems and liquid silicone rubbers, engineered for demanding industrial, electronic, and medical applications.
The industry research and growth report includes detailed analyses of the competitive landscape of the market and information about key companies, including:
- Avantor Inc.
- Avantor Topco Sub GP LLC
- Bentec Medical
- China National Bluestar Co.
- Dow Chemical Co.
- DuPont de Nemours Inc.
- Evonik Industries AG
- KCC SILICONE CORP
- MESGO
- Momentive Materials Inc.
- Quantum Silicon Inc.
- Rogers Corp.
- Siltech Corp.
- Wacker Chemie AG
- Wynca Group
Qualitative and quantitative analysis of companies has been conducted to help clients understand the wider business environment as well as the strengths and weaknesses of key industry players. Data is qualitatively analyzed to categorize companies as pure play, category-focused, industry-focused, and diversified; it is quantitatively analyzed to categorize companies as dominant, leading, strong, tentative, and weak.
Recent Development and News in Silicone elastomers market
- In August 2025, Shin-Etsu introduced a recyclable thermoplastic silicone featuring high hardness and elongation, suitable for injection molding and coating applications in electronics.
- In May 2025, Wacker Chemie AG expanded its manufacturing presence in China to produce high-quality silicone elastomers for the region's growing medical and industrial markets.
- In April 2025, Dow Chemical Co. launched a new high-performance silicone elastomer grade specifically designed for automotive sealing, offering superior heat resistance and flexibility.
- In February 2025, Momentive Performance Materials introduced a novel 3D printable silicone elastomer engineered for soft robotics and medical-grade wearable devices.
Dive into Technavio’s robust research methodology, blending expert interviews, extensive data synthesis, and validated models for unparalleled Silicone Elastomers Market insights. See full methodology.
| Market Scope | |
|---|---|
| Page number | 309 |
| Base year | 2025 |
| Historic period | 2020-2024 |
| Forecast period | 2026-2030 |
| Growth momentum & CAGR | Accelerate at a CAGR of 6.3% |
| Market growth 2026-2030 | USD 3862.6 million |
| Market structure | Fragmented |
| YoY growth 2025-2026(%) | 5.9% |
| Key countries | China, Japan, India, South Korea, Australia, Indonesia, US, Canada, Mexico, Germany, UK, France, Italy, Spain, The Netherlands, Saudi Arabia, UAE, South Africa, Israel, Turkey, Brazil, Argentina and Chile |
| Competitive landscape | Leading Companies, Market Positioning of Companies, Competitive Strategies, and Industry Risks |
Research Analyst Overview
- The silicone elastomers market is defined by continuous material science innovation, with manufacturers leveraging advanced compounding and precision curing to develop high-performance products. Key materials include high consistency rubber, two-part silicone elastomer, and liquid silicone rubber, which are processed through methods like room temperature vulcanization and photopolymerization.
- The market is driven by demand for specialized grades such as cosmetic-grade silicone, medical-grade silicone elastomer, and implant-grade silicone. Formulations are enhanced with organomodified silicones, versatile crosslinkers, and silicone-based performance additives. Innovations like silver ion technologies and bioactive materials create elastomers with non-leaching characteristics. The sourcing of raw materials like methylsiloxane feedstocks and siloxane remains a critical operational factor.
- Technologies such as AI-assisted material design are being employed to optimize formulations, such as thermoplastic silicone and peroxide-curing hcr, leading to the creation of superior optical-grade silicone elastomers and low viscosity elastomers. This approach has proven to reduce formulation defects by over 20%, accelerating the development of next-generation materials.
What are the Key Data Covered in this Silicone Elastomers Market Research and Growth Report?
-
What is the expected growth of the Silicone Elastomers Market between 2026 and 2030?
-
USD 3.86 billion, at a CAGR of 6.3%
-
-
What segmentation does the market report cover?
-
The report is segmented by Product (HTV, LSR, and RTV), End-user (Construction, Automotive, Electrical and electronics, Consumer goods, and Others), Method (Compression molding, Liquid injection molding, Injection molding, and Extrusion) and Geography (APAC, North America, Europe, Middle East and Africa, South America)
-
-
Which regions are analyzed in the report?
-
APAC, North America, Europe, Middle East and Africa and South America
-
-
What are the key growth drivers and market challenges?
-
Increasing demand for hip and knee implants, Stringent clinical and regulatory policies
-
-
Who are the major players in the Silicone Elastomers Market?
-
Avantor Inc., Avantor Topco Sub GP LLC, Bentec Medical, China National Bluestar Co., Dow Chemical Co., DuPont de Nemours Inc., Evonik Industries AG, KCC SILICONE CORP, MESGO, Momentive Materials Inc., Quantum Silicon Inc., Rogers Corp., Siltech Corp., Wacker Chemie AG and Wynca Group
-
Market Research Insights
- Market dynamics are shaped by a pronounced shift toward high-performance materials. The adoption of 3d printable silicone for rapid prototyping has been shown to reduce development cycles by up to 30%, a critical advantage in competitive sectors.
- In automotive, the push for lightweighting has led to the integration of lightweight silicone elastomer in components, achieving an average weight reduction of 15% compared to traditional materials. High-purity silicone materials are now standard for biocompatible durable medical devices and soft robotics components. Meanwhile, the demand for highly transparent silicone in flexible display technology and automotive led lighting is growing.
- Advances in antimicrobial silicone elastomer formulations enhance safety in medical and consumer applications, driving their adoption. The market for high-performance sealing solutions, particularly for automotive sealing applications and industrial maintenance coatings, is expanding as these materials demonstrate superior longevity and resistance to harsh conditions, justifying their premium.
We can help! Our analysts can customize this silicone elastomers market research report to meet your requirements.
 RIA -
RIA - 
