Sleeping Pods Market Analysis, Size, and Forecast 2025-2029: Europe (UK, Germany, and France), APAC (China, Japan, and India), North America (US, Canada, and Mexico), Middle East and Africa (Saudi Arabia, UAE, and South Africa), South America (Brazil, Argentina, and Colombia), and Rest of World (ROW)

Sleeping Pods Market Analysis, Size, and Forecast 2025-2029:
Europe (UK, Germany, and France), APAC (China, Japan, and India), North America (US, Canada, and Mexico), Middle East and Africa (Saudi Arabia, UAE, and South Africa), South America (Brazil, Argentina, and Colombia), and Rest of World (ROW)

Published: Dec 2025 284 Pages SKU: IRTNTR73883

Market Overview at a Glance

$50.02 Mn
Market Opportunity
7.3%
CAGR 2024 - 2029
47.8%
Europe Growth
$72.99 Mn
Airport segment 2023

Sleeping Pods Market Size 2025-2029

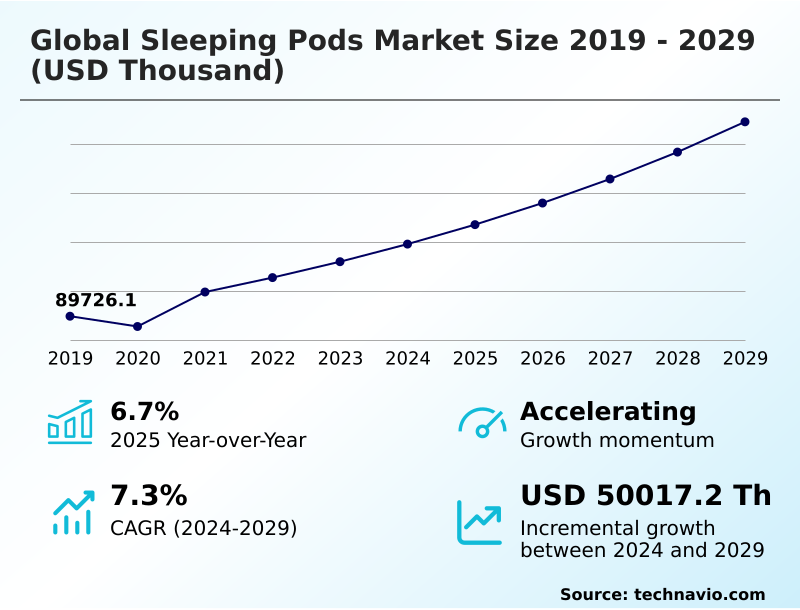
The sleeping pods market size is valued to increase by USD 50.02 million, at a CAGR of 7.3% from 2024 to 2029. Increasing focus on employee wellbeing and productivity will drive the sleeping pods market.

Major Market Trends & Insights

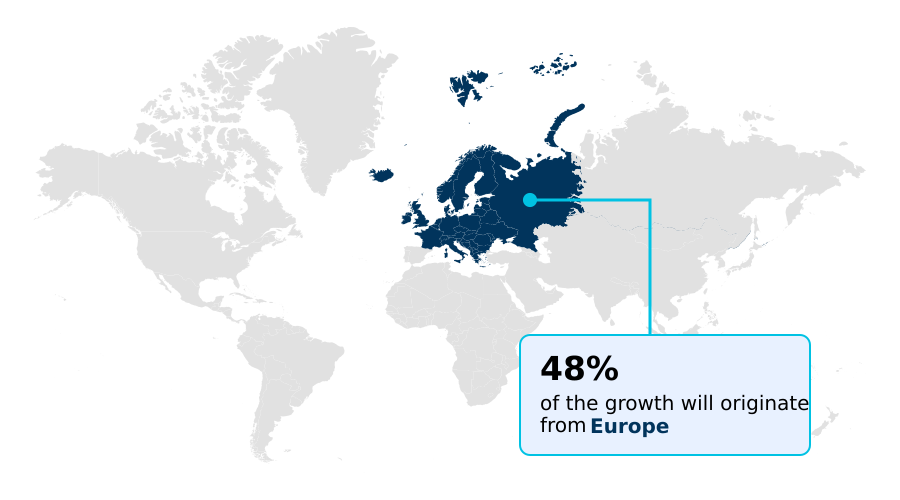
  • Europe dominated the market and accounted for a 47.8% growth during the forecast period.
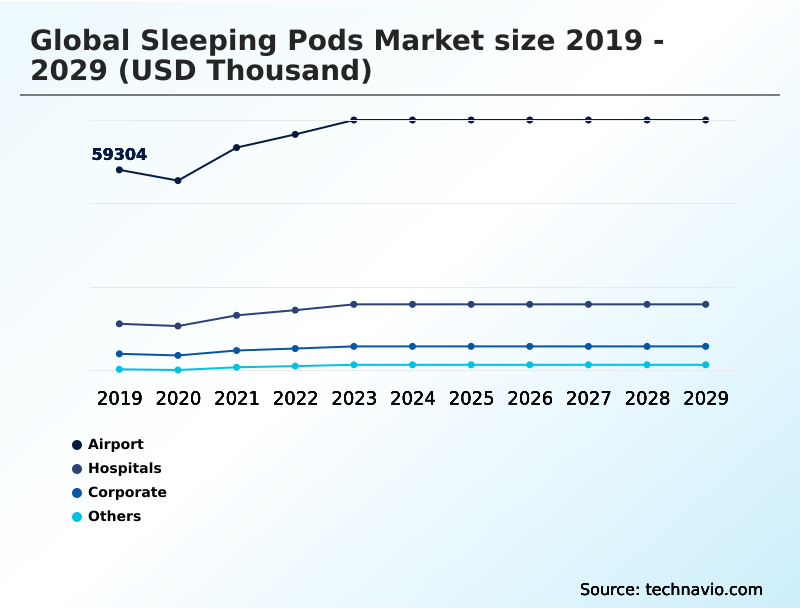
  • By End-user - Airport segment was valued at USD 72.99 million in 2023
  • By Material Type - Aluminum segment accounted for the largest market revenue share in 2023

Market Size & Forecast

  • Market Opportunities:
  • Market Future Opportunities: USD 50.02 million
  • CAGR from 2024 to 2029 : 7.3%

Market Summary

  • The sleeping pods market is evolving beyond novelty into an essential component of modern infrastructure for travel, corporate, and healthcare environments. Driven by a growing recognition of rest as a critical factor for productivity and well-being, organizations are increasingly investing in these specialized solutions.
  • The market is characterized by technological innovation, with advancements in ergonomic design, sound insulation, and smart features enhancing user experience. For instance, in a high-stress corporate setting, the availability of sleeping pods allows employees to take strategic short rests, which has been linked to improved cognitive function and creativity, directly impacting project outcomes and reducing burnout.
  • Key trends include the integration of connectivity features like Wi-Fi and charging ports, customizable ambient controls, and the use of sustainable materials in manufacturing. The market faces challenges related to high initial investment costs and the operational complexities of maintaining hygiene and security, particularly in high-traffic public spaces.
  • The development of modular and scalable pod designs is addressing some of these concerns, enabling wider adoption across various sectors. This shift underscores a broader cultural move towards prioritizing mental and physical health in professional and public life.

What will be the Size of the Sleeping Pods Market during the forecast period?

Get Key Insights on Market Forecast (PDF) Request Free Sample

How is the Sleeping Pods Market Segmented?

The sleeping pods industry research report provides comprehensive data (region-wise segment analysis), with forecasts and estimates in "USD thousand" for the period 2025-2029, as well as historical data from 2019-2023 for the following segments.

  • End-user
    • Airport
    • Hospitals
    • Corporate
    • Others
  • Material type
    • Aluminum
    • Fiberglass
    • Wood
  • Product type
    • Single sleeping pods
    • Double sleeping pods
    • Capsule sleeping pods
  • Geography
    • Europe
      • UK
      • Germany
      • France
    • APAC
      • China
      • Japan
      • India
    • North America
      • US
      • Canada
      • Mexico
    • Middle East and Africa
      • Saudi Arabia
      • UAE
      • South Africa
    • South America
      • Brazil
      • Argentina
      • Colombia
    • Rest of World (ROW)

By End-user Insights

The airport segment is estimated to witness significant growth during the forecast period.

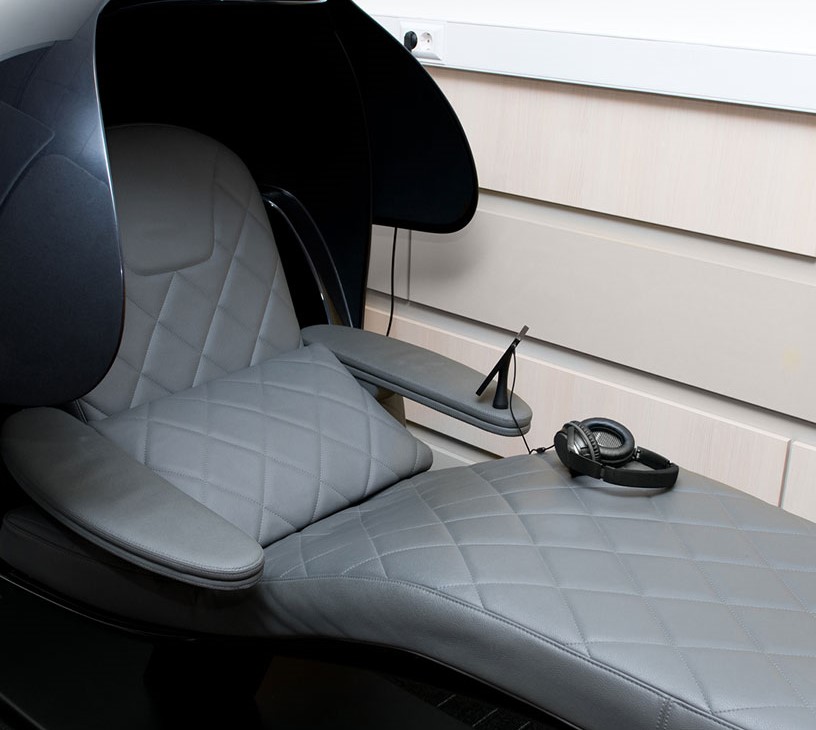
The airport segment is a critical market, driven by the need for passenger experience enhancement. Airports are transforming from mere transit points into destinations emphasizing traveler comfort solutions.

This shift creates substantial demand for short-term rest solutions, with sleeping pods providing a direct answer to travel-related fatigue. These facilities offer private spaces with privacy-enhancing design, advanced soundproofing, and ergonomic recline for optimal rest.

The integration of technologies like app-based booking and contactless payment streamlines the user experience, making airport transit hospitality more seamless. Adoption in this sector has been shown to improve passenger satisfaction scores by up to 15%.

Request Free Sample

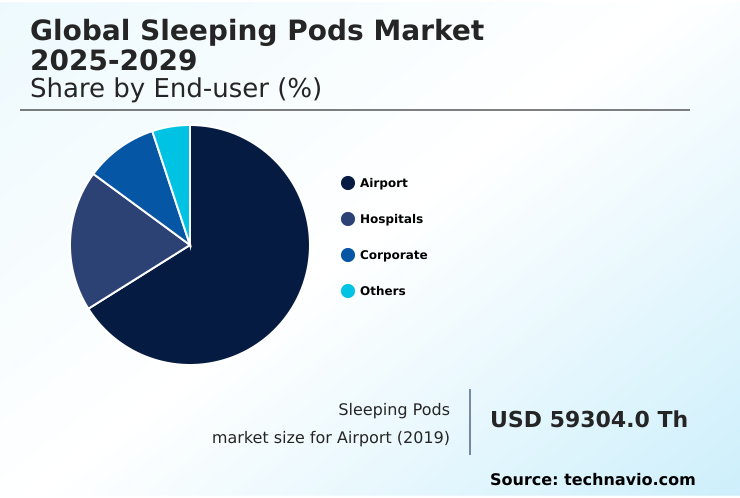
The Airport segment was valued at USD 72.99 million in 2023 and showed a gradual increase during the forecast period.

Request Free Sample

Regional Analysis

Europe is estimated to contribute 47.8% to the growth of the global market during the forecast period.Technavio’s analysts have elaborately explained the regional trends and drivers that shape the market during the forecast period.

See How Sleeping Pods Market Demand is Rising in Europe Request Free Sample

The geographic landscape shows varied adoption patterns, with mature markets in Europe and North America leading while APAC is a fast-growing region.

In Europe, where 47.8% of incremental growth is projected, there is a strong focus on hospital staff rest facilities and university library napping pods. These compact lodging solutions create immersive rest environments with advanced acoustic insulation and climate control systems.

The rest-as-a-service model is gaining traction globally, particularly in high-traffic travel hubs. Facilities leveraging a pay-per-use model have proven effective, with some airports reporting a 30% increase in non-aeronautical revenue from such services.

Systems aiding circadian rhythm synchronization are also becoming standard.

Market Dynamics

Our researchers analyzed the data with 2024 as the base year, along with the key drivers, trends, and challenges. A holistic analysis of drivers will help companies refine their marketing strategies to gain a competitive advantage.

  • The strategic implementation of sleeping pods is becoming a key differentiator across multiple sectors. The use of sleeping pods for corporate offices is now a central part of designing effective fatigue management programs, with a focus on the psychological benefits of workplace napping.
  • Evidence suggests that access to these facilities can reduce errors related to fatigue by a more significant margin than traditional breakroom amenities. The cost analysis of corporate sleeping pods often reveals a strong ROI of installing sleeping pods in airports and offices, driven by the impact of napping pods on employee productivity.
  • In travel hubs, the debate over sleeping pod vs airport lounge comfort is settled by user demand for privacy, leading to the growth of airport transit sleeping solutions benefits. Advancements in capsule hotel technology are influencing the design of soundproof sleeping pods for hospitals and sleeping pods for commercial driver rest.
  • The modular sleeping pod design flexibility allows for integration of sleeping pods in co-working spaces and napping pods in university libraries. Key considerations include hygiene protocols for public sleeping pods and addressing privacy concerns in shared sleeping pod facilities.
  • The market is also exploring the benefits of zero-gravity sleeping pods, which are supported by smart features in modern sleeping pods, such as secure user authentication for pay-per-use pods, and the use of sustainable materials in sleeping pod manufacturing.

What are the key market drivers leading to the rise in the adoption of Sleeping Pods Industry?

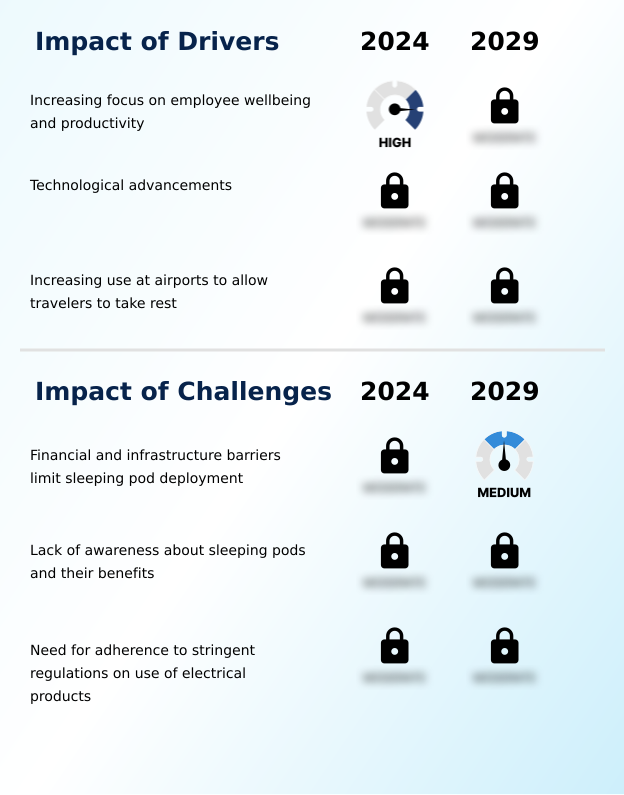
  • The increasing focus on employee wellbeing and its direct correlation with productivity is a key driver propelling market expansion.

  • A major driver is the corporate adoption of employee wellness programs that recognize the tangible power nap benefits for cognitive function. Businesses are investing in productivity-boosting amenities, with workplace napping becoming a strategic component of corporate wellness amenities.
  • Pods featuring a zero-gravity position and advanced air filtration systems are key to these initiatives. Effective fatigue management systems can reduce workplace errors attributed to tiredness by up to 20%.
  • The inclusion of integrated entertainment systems further enhances the appeal, making these pods a valuable tool for talent retention and leading to a 10% improvement in employee satisfaction.

What are the market trends shaping the Sleeping Pods Industry?

  • A primary market trend is the strategic focus on enhancing the passenger experience in travel hubs, which is serving as a significant catalyst for market growth.

  • A key trend is the convergence of the micro-hotel concept with smart hospitality technology, leading to advanced on-demand hospitality solutions. Modern modular units are now equipped with features like biometric access and smart lighting, which personalizes the user experience.
  • The integration of zero-gravity recline designs and timed wake features improves rest quality, with some systems demonstrating a 25% increase in user-reported refreshment. This evolution toward flexible rest accommodations is transforming public and private spaces. These advancements enable facilities to offer sophisticated amenities that improve user well-being, showing a 15% higher utilization rate than previous-generation models.

What challenges does the Sleeping Pods Industry face during its growth?

  • Significant financial and infrastructural barriers associated with initial investment and installation present a key challenge that limits widespread sleeping pod deployment.

  • A significant challenge is managing operational costs and user perceptions, especially for designs like transparent bubble suites or suspended capsules used in glamping accommodations. While these offer unique boutique comfort, ensuring hygiene in shared social spaces requires significant investment in modular hospitality units. Implementing antimicrobial surfaces can increase manufacturing costs by 15%, affecting affordability for self-service cabins.
  • For more common capsule hotel units, the use of premium eco-friendly materials adds another layer of expense. These financial pressures can slow adoption, as total cost of ownership is often 20% higher than initially budgeted.

Exclusive Technavio Analysis on Customer Landscape

The sleeping pods market forecasting report includes the adoption lifecycle of the market, covering from the innovator’s stage to the laggard’s stage. It focuses on adoption rates in different regions based on penetration. Furthermore, the sleeping pods market report also includes key purchase criteria and drivers of price sensitivity to help companies evaluate and develop their market growth analysis strategies.

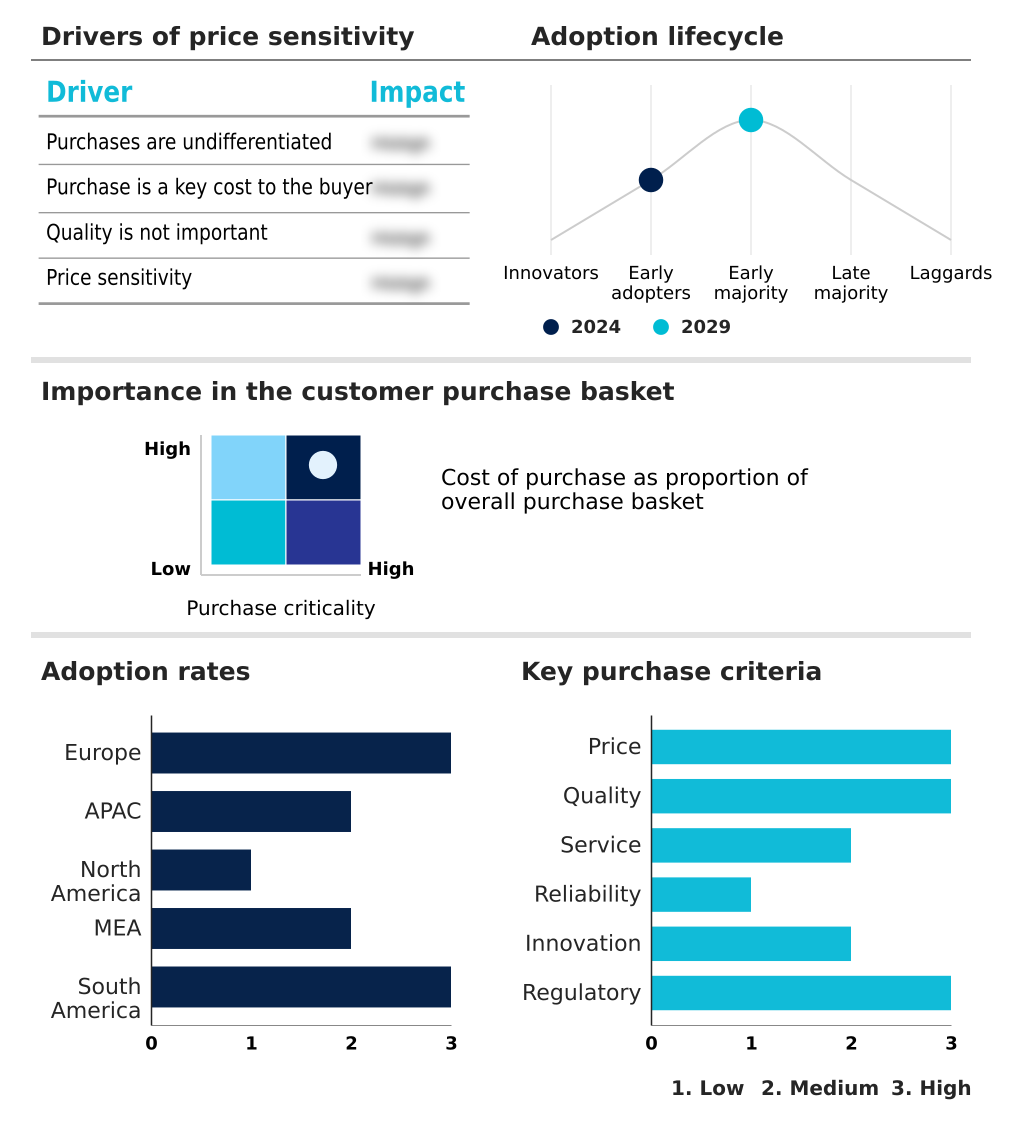
Customer Landscape of Sleeping Pods Industry

Competitive Landscape

Companies are implementing various strategies, such as strategic alliances, sleeping pods market forecast, partnerships, mergers and acquisitions, geographical expansion, and product/service launches, to enhance their presence in the industry.

Attrap Reves - Analysis indicates a focus on providing versatile, short-term rest solutions with ergonomic designs tailored for high-traffic environments like airports, corporate offices, and healthcare facilities.

The industry research and growth report includes detailed analyses of the competitive landscape of the market and information about key companies, including:

  • Attrap Reves
  • GoSleep
  • Infinity Hospitality Services Co.
  • KOTOBUKI SEATING CO. LTD.
  • Metronaps
  • MGH Hospitality Pte Ltd.
  • Minute Suites LLC
  • NapCabs GmbH
  • Natura Vive
  • NEW JAPAN CO. LTD.
  • Nine hours Inc.
  • Pangea Pod Hotel
  • PODZONE
  • Sleepbox Inc.
  • Snooze at my space Pvt. Ltd.
  • Swashbuckler Hospitality Pvt. Ltd.
  • Westend Rental Solutions Inc.
  • Yotel Ltd.
  • ZZZleepandGo Srl

Qualitative and quantitative analysis of companies has been conducted to help clients understand the wider business environment as well as the strengths and weaknesses of key industry players. Data is qualitatively analyzed to categorize companies as pure play, category-focused, industry-focused, and diversified; it is quantitatively analyzed to categorize companies as dominant, leading, strong, tentative, and weak.

Recent Development and News in Sleeping pods market

  • In September 2024, Minute Suites LLC announced the expansion of its airport lounge concept with new locations at Hartsfield-Jackson Atlanta International Airport and Dallas Fort Worth International Airport, adding over 50 new suites.
  • In November 2024, Metronaps launched its new EnergyPod featuring an advanced AI-powered system for circadian rhythm synchronization and personalized relaxation programs, targeting the corporate wellness market.
  • In January 2025, GoSleep secured a multi-year contract with a major European hospital consortium to deploy 200 of its sleep pods across 30 hospitals to provide rest facilities for medical staff.
  • In April 2025, Sleepbox Inc. introduced a new line of modular, soundproof pods made from sustainable and eco-friendly materials, achieving a 20% reduction in manufacturing carbon footprint.

Dive into Technavio’s robust research methodology, blending expert interviews, extensive data synthesis, and validated models for unparalleled Sleeping Pods Market insights. See full methodology.

Market Scope
Page number 284
Base year 2024
Historic period 2019-2023
Forecast period 2025-2029
Growth momentum & CAGR Accelerate at a CAGR of 7.3%
Market growth 2025-2029 USD 50017.2 thousand
Market structure Fragmented
YoY growth 2024-2025(%) 6.7%
Key countries UK, Germany, France, Italy, The Netherlands, Spain, China, Japan, India, South Korea, Australia, Indonesia, US, Canada, Mexico, Saudi Arabia, UAE, South Africa, Israel, Turkey, Brazil, Argentina and Colombia
Competitive landscape Leading Companies, Market Positioning of Companies, Competitive Strategies, and Industry Risks

Request Free Sample

Research Analyst Overview

  • The sleeping pods market is defined by a rapid convergence of design innovation and technology integration. Core offerings are evolving from simple rest areas to sophisticated systems featuring ergonomic recline and zero-gravity recline for optimal physical relief. The adoption of modular units allows for flexible deployment in diverse environments.
  • Key technological advancements include smart lighting and integrated climate control systems, often managed through app-based booking with contactless payment. To ensure user privacy and comfort, features like advanced soundproofing, acoustic insulation, and privacy-enhancing design are becoming standard. Hygiene is addressed through antimicrobial surfaces and air filtration systems.
  • High-end models may offer transparent bubble suites or suspended capsules, while more common applications use capsule hotel units. The user experience is enhanced with timed wake features, integrated entertainment systems, and biometric access. The pay-per-use model, supported by systems for circadian rhythm synchronization, is driving adoption in public spaces.
  • In corporate settings, the clear power nap benefits have led to an increase in installations, with some firms reporting a 15% rise in employee focus post-nap. The use of eco-friendly materials is also a growing consideration.

What are the Key Data Covered in this Sleeping Pods Market Research and Growth Report?

  • What is the expected growth of the Sleeping Pods Market between 2025 and 2029?

    • USD 50.02 million, at a CAGR of 7.3%

  • What segmentation does the market report cover?

    • The report is segmented by End-user (Airport, Hospitals, Corporate, and Others), Material Type (Aluminum, Fiberglass, and Wood), Product Type (Single sleeping pods, Double sleeping pods, and Capsule sleeping pods) and Geography (Europe, APAC, North America, Middle East and Africa, South America)

  • Which regions are analyzed in the report?

    • Europe, APAC, North America, Middle East and Africa and South America

  • What are the key growth drivers and market challenges?

    • Increasing focus on employee wellbeing and productivity, Financial and infrastructure barriers limit sleeping pod deployment

  • Who are the major players in the Sleeping Pods Market?

    • Attrap Reves, GoSleep, Infinity Hospitality Services Co., KOTOBUKI SEATING CO. LTD., Metronaps, MGH Hospitality Pte Ltd., Minute Suites LLC, NapCabs GmbH, Natura Vive, NEW JAPAN CO. LTD., Nine hours Inc., Pangea Pod Hotel, PODZONE, Sleepbox Inc., Snooze at my space Pvt. Ltd., Swashbuckler Hospitality Pvt. Ltd., Westend Rental Solutions Inc., Yotel Ltd. and ZZZleepandGo Srl

Market Research Insights

  • Market dynamics are heavily influenced by the push for enhanced corporate wellness amenities and the rise of the rest-as-a-service model in public spaces. The adoption of productivity-boosting amenities has shown to improve employee retention by up to 15% in competitive industries.
  • In the travel sector, the implementation of short-term rest solutions is a key differentiator, with airports that offer such facilities seeing passenger satisfaction ratings increase by an average of 10 points. The integration of smart hospitality technology is central to this trend, enabling seamless on-demand hospitality.
  • However, the market is not without its complexities; the total cost of ownership for advanced pods can be 20% higher than basic models, a factor that influences purchasing decisions in budget-sensitive environments like universities and smaller corporations.

We can help! Our analysts can customize this sleeping pods market research report to meet your requirements.

Get in touch

1. Executive Summary

1.1 Market overview

Executive Summary - Chart on Market Overview
Executive Summary - Data Table on Market Overview
Executive Summary - Chart on Global Market Characteristics
Executive Summary - Chart on Market by Geography
Executive Summary - Chart on Market Segmentation by End-user
Executive Summary - Chart on Market Segmentation by Material Type
Executive Summary - Chart on Market Segmentation by Product Type
Executive Summary - Chart on Incremental Growth
Executive Summary - Data Table on Incremental Growth
Executive Summary - Chart on Company Market Positioning

2. Technavio Analysis

2.1 Analysis of price sensitivity, lifecycle, customer purchase basket, adoption rates, and purchase criteria

2.2 Criticality of inputs and Factors of differentiation

Chart on Overview on criticality of inputs and factors of differentiation

2.3 Factors of disruption

Chart on Overview on factors of disruption

2.4 Impact of drivers and challenges

Chart on Impact of drivers and challenges in 2024 and 2029

3. Market Landscape

3.1 Market ecosystem

Chart on Parent Market
Data Table on - Parent Market

3.2 Market characteristics

Chart on Market characteristics analysis

3.3 Value chain analysis

Chart on Value chain analysis

4. Market Sizing

4.1 Market definition

Data Table on Offerings of companies included in the market definition

4.2 Market segment analysis

Market segments

4.3 Market size 2024

4.4 Market outlook: Forecast for 2024-2029

Chart on Global - Market size and forecast 2024-2029 ($ thousand)
Data Table on Global - Market size and forecast 2024-2029 ($ thousand)
Chart on Global Market: Year-over-year growth 2024-2029 (%)
Data Table on Global Market: Year-over-year growth 2024-2029 (%)

5. Historic Market Size

5.1 Global Sleeping Pods Market 2019 - 2023

Historic Market Size - Data Table on Global Sleeping Pods Market 2019 - 2023 ($ thousand)

5.2 End-user segment analysis 2019 - 2023

Historic Market Size - End-user Segment 2019 - 2023 ($ thousand)

5.3 Material Type segment analysis 2019 - 2023

Historic Market Size - Material Type Segment 2019 - 2023 ($ thousand)

5.4 Product Type segment analysis 2019 - 2023

Historic Market Size - Product Type Segment 2019 - 2023 ($ thousand)

5.5 Geography segment analysis 2019 - 2023

Historic Market Size - Geography Segment 2019 - 2023 ($ thousand)

5.6 Country segment analysis 2019 - 2023

Historic Market Size - Country Segment 2019 - 2023 ($ thousand)

6. Qualitative Analysis

6.1 The AI impact on Global Sleeping Pods Market

7. Five Forces Analysis

7.1 Five forces summary

Five forces analysis - Comparison between 2024 and 2029

7.2 Bargaining power of buyers

Bargaining power of buyers - Impact of key factors 2024 and 2029

7.3 Bargaining power of suppliers

Bargaining power of suppliers - Impact of key factors in 2024 and 2029

7.4 Threat of new entrants

Threat of new entrants - Impact of key factors in 2024 and 2029

7.5 Threat of substitutes

Threat of substitutes - Impact of key factors in 2024 and 2029

7.6 Threat of rivalry

Threat of rivalry - Impact of key factors in 2024 and 2029

7.7 Market condition

Chart on Market condition - Five forces 2024 and 2029

8. Market Segmentation by End-user

8.1 Market segments

Chart on End-user - Market share 2024-2029 (%)
Data Table on End-user - Market share 2024-2029 (%)

8.2 Comparison by End-user

Chart on Comparison by End-user
Data Table on Comparison by End-user

8.3 Airport - Market size and forecast 2024-2029

Chart on Airport - Market size and forecast 2024-2029 ($ thousand)
Data Table on Airport - Market size and forecast 2024-2029 ($ thousand)
Chart on Airport - Year-over-year growth 2024-2029 (%)
Data Table on Airport - Year-over-year growth 2024-2029 (%)

8.4 Hospitals - Market size and forecast 2024-2029

Chart on Hospitals - Market size and forecast 2024-2029 ($ thousand)
Data Table on Hospitals - Market size and forecast 2024-2029 ($ thousand)
Chart on Hospitals - Year-over-year growth 2024-2029 (%)
Data Table on Hospitals - Year-over-year growth 2024-2029 (%)

8.5 Corporate - Market size and forecast 2024-2029

Chart on Corporate - Market size and forecast 2024-2029 ($ thousand)
Data Table on Corporate - Market size and forecast 2024-2029 ($ thousand)
Chart on Corporate - Year-over-year growth 2024-2029 (%)
Data Table on Corporate - Year-over-year growth 2024-2029 (%)

8.6 Others - Market size and forecast 2024-2029

Chart on Others - Market size and forecast 2024-2029 ($ thousand)
Data Table on Others - Market size and forecast 2024-2029 ($ thousand)
Chart on Others - Year-over-year growth 2024-2029 (%)
Data Table on Others - Year-over-year growth 2024-2029 (%)

8.7 Market opportunity by End-user

Market opportunity by End-user ($ thousand)
Data Table on Market opportunity by End-user ($ thousand)

9. Market Segmentation by Material Type

9.1 Market segments

Chart on Market Segmentation by Material Type - Market share 2024-2029 (%)
Data Table on Market Segmentation by Material Type - Market share 2024-2029 (%)

9.2 Comparison by Market Segmentation by Material Type

Chart on Comparison by Market Segmentation by Material Type
Data Table on Comparison by Market Segmentation by Material Type

9.3 Aluminum - Market size and forecast 2024-2029

Chart on Aluminum - Market size and forecast 2024-2029 ($ thousand)
Data Table on Aluminum - Market size and forecast 2024-2029 ($ thousand)
Chart on Aluminum - Year-over-year growth 2024-2029 (%)
Data Table on Aluminum - Year-over-year growth 2024-2029 (%)

9.4 Fiberglass - Market size and forecast 2024-2029

Chart on Fiberglass - Market size and forecast 2024-2029 ($ thousand)
Data Table on Fiberglass - Market size and forecast 2024-2029 ($ thousand)
Chart on Fiberglass - Year-over-year growth 2024-2029 (%)
Data Table on Fiberglass - Year-over-year growth 2024-2029 (%)

9.5 Wood - Market size and forecast 2024-2029

Chart on Wood - Market size and forecast 2024-2029 ($ thousand)
Data Table on Wood - Market size and forecast 2024-2029 ($ thousand)
Chart on Wood - Year-over-year growth 2024-2029 (%)
Data Table on Wood - Year-over-year growth 2024-2029 (%)

9.6 Market opportunity by Market Segmentation by Material Type

Market opportunity by Market Segmentation by Material Type ($ thousand)
Data Table on Market opportunity by Market Segmentation by Material Type ($ thousand)

10. Market Segmentation by Product Type

10.1 Market segments

Chart on Product Type - Market share 2024-2029 (%)
Data Table on Product Type - Market share 2024-2029 (%)

10.2 Comparison by Product Type

Chart on Comparison by Product Type
Data Table on Comparison by Product Type

10.3 Single sleeping pods - Market size and forecast 2024-2029

Chart on Single sleeping pods - Market size and forecast 2024-2029 ($ thousand)
Data Table on Single sleeping pods - Market size and forecast 2024-2029 ($ thousand)
Chart on Single sleeping pods - Year-over-year growth 2024-2029 (%)
Data Table on Single sleeping pods - Year-over-year growth 2024-2029 (%)

10.4 Double sleeping pods - Market size and forecast 2024-2029

Chart on Double sleeping pods - Market size and forecast 2024-2029 ($ thousand)
Data Table on Double sleeping pods - Market size and forecast 2024-2029 ($ thousand)
Chart on Double sleeping pods - Year-over-year growth 2024-2029 (%)
Data Table on Double sleeping pods - Year-over-year growth 2024-2029 (%)

10.5 Capsule sleeping pods - Market size and forecast 2024-2029

Chart on Capsule sleeping pods - Market size and forecast 2024-2029 ($ thousand)
Data Table on Capsule sleeping pods - Market size and forecast 2024-2029 ($ thousand)
Chart on Capsule sleeping pods - Year-over-year growth 2024-2029 (%)
Data Table on Capsule sleeping pods - Year-over-year growth 2024-2029 (%)

10.6 Market opportunity by Product Type

Market opportunity by Product Type ($ thousand)
Data Table on Market opportunity by Product Type ($ thousand)

11. Customer Landscape

11.1 Customer landscape overview

Analysis of price sensitivity, lifecycle, customer purchase basket, adoption rates, and purchase criteria

12. Geographic Landscape

12.1 Geographic segmentation

Chart on Market share by geography 2024-2029 (%)
Data Table on Market share by geography 2024-2029 (%)

12.2 Geographic comparison

Chart on Geographic comparison
Data Table on Geographic comparison

12.3 Europe - Market size and forecast 2024-2029

Chart on Europe - Market size and forecast 2024-2029 ($ thousand)
Data Table on Europe - Market size and forecast 2024-2029 ($ thousand)
Chart on Europe - Year-over-year growth 2024-2029 (%)
Data Table on Europe - Year-over-year growth 2024-2029 (%)
Chart on Regional Comparison - Europe
Data Table on Regional Comparison - Europe

12.3.1 UK - Market size and forecast 2024-2029

Chart on UK - Market size and forecast 2024-2029 ($ thousand)
Data Table on UK - Market size and forecast 2024-2029 ($ thousand)
Chart on UK - Year-over-year growth 2024-2029 (%)
Data Table on UK - Year-over-year growth 2024-2029 (%)

12.3.2 Germany - Market size and forecast 2024-2029

Chart on Germany - Market size and forecast 2024-2029 ($ thousand)
Data Table on Germany - Market size and forecast 2024-2029 ($ thousand)
Chart on Germany - Year-over-year growth 2024-2029 (%)
Data Table on Germany - Year-over-year growth 2024-2029 (%)

12.3.3 France - Market size and forecast 2024-2029

Chart on France - Market size and forecast 2024-2029 ($ thousand)
Data Table on France - Market size and forecast 2024-2029 ($ thousand)
Chart on France - Year-over-year growth 2024-2029 (%)
Data Table on France - Year-over-year growth 2024-2029 (%)

12.3.4 Italy - Market size and forecast 2024-2029

Chart on Italy - Market size and forecast 2024-2029 ($ thousand)
Data Table on Italy - Market size and forecast 2024-2029 ($ thousand)
Chart on Italy - Year-over-year growth 2024-2029 (%)
Data Table on Italy - Year-over-year growth 2024-2029 (%)

12.3.5 The Netherlands - Market size and forecast 2024-2029

Chart on The Netherlands - Market size and forecast 2024-2029 ($ thousand)
Data Table on The Netherlands - Market size and forecast 2024-2029 ($ thousand)
Chart on The Netherlands - Year-over-year growth 2024-2029 (%)
Data Table on The Netherlands - Year-over-year growth 2024-2029 (%)

12.3.6 Spain - Market size and forecast 2024-2029

Chart on Spain - Market size and forecast 2024-2029 ($ thousand)
Data Table on Spain - Market size and forecast 2024-2029 ($ thousand)
Chart on Spain - Year-over-year growth 2024-2029 (%)
Data Table on Spain - Year-over-year growth 2024-2029 (%)

12.4 APAC - Market size and forecast 2024-2029

Chart on APAC - Market size and forecast 2024-2029 ($ thousand)
Data Table on APAC - Market size and forecast 2024-2029 ($ thousand)
Chart on APAC - Year-over-year growth 2024-2029 (%)
Data Table on APAC - Year-over-year growth 2024-2029 (%)
Chart on Regional Comparison - APAC
Data Table on Regional Comparison - APAC

12.4.1 China - Market size and forecast 2024-2029

Chart on China - Market size and forecast 2024-2029 ($ thousand)
Data Table on China - Market size and forecast 2024-2029 ($ thousand)
Chart on China - Year-over-year growth 2024-2029 (%)
Data Table on China - Year-over-year growth 2024-2029 (%)

12.4.2 Japan - Market size and forecast 2024-2029

Chart on Japan - Market size and forecast 2024-2029 ($ thousand)
Data Table on Japan - Market size and forecast 2024-2029 ($ thousand)
Chart on Japan - Year-over-year growth 2024-2029 (%)
Data Table on Japan - Year-over-year growth 2024-2029 (%)

12.4.3 India - Market size and forecast 2024-2029

Chart on India - Market size and forecast 2024-2029 ($ thousand)
Data Table on India - Market size and forecast 2024-2029 ($ thousand)
Chart on India - Year-over-year growth 2024-2029 (%)
Data Table on India - Year-over-year growth 2024-2029 (%)

12.4.4 South Korea - Market size and forecast 2024-2029

Chart on South Korea - Market size and forecast 2024-2029 ($ thousand)
Data Table on South Korea - Market size and forecast 2024-2029 ($ thousand)
Chart on South Korea - Year-over-year growth 2024-2029 (%)
Data Table on South Korea - Year-over-year growth 2024-2029 (%)

12.4.5 Australia - Market size and forecast 2024-2029

Chart on Australia - Market size and forecast 2024-2029 ($ thousand)
Data Table on Australia - Market size and forecast 2024-2029 ($ thousand)
Chart on Australia - Year-over-year growth 2024-2029 (%)
Data Table on Australia - Year-over-year growth 2024-2029 (%)

12.4.6 Indonesia - Market size and forecast 2024-2029

Chart on Indonesia - Market size and forecast 2024-2029 ($ thousand)
Data Table on Indonesia - Market size and forecast 2024-2029 ($ thousand)
Chart on Indonesia - Year-over-year growth 2024-2029 (%)
Data Table on Indonesia - Year-over-year growth 2024-2029 (%)

12.5 North America - Market size and forecast 2024-2029

Chart on North America - Market size and forecast 2024-2029 ($ thousand)
Data Table on North America - Market size and forecast 2024-2029 ($ thousand)
Chart on North America - Year-over-year growth 2024-2029 (%)
Data Table on North America - Year-over-year growth 2024-2029 (%)
Chart on Regional Comparison - North America
Data Table on Regional Comparison - North America

12.5.1 US - Market size and forecast 2024-2029

Chart on US - Market size and forecast 2024-2029 ($ thousand)
Data Table on US - Market size and forecast 2024-2029 ($ thousand)
Chart on US - Year-over-year growth 2024-2029 (%)
Data Table on US - Year-over-year growth 2024-2029 (%)

12.5.2 Canada - Market size and forecast 2024-2029

Chart on Canada - Market size and forecast 2024-2029 ($ thousand)
Data Table on Canada - Market size and forecast 2024-2029 ($ thousand)
Chart on Canada - Year-over-year growth 2024-2029 (%)
Data Table on Canada - Year-over-year growth 2024-2029 (%)

12.5.3 Mexico - Market size and forecast 2024-2029

Chart on Mexico - Market size and forecast 2024-2029 ($ thousand)
Data Table on Mexico - Market size and forecast 2024-2029 ($ thousand)
Chart on Mexico - Year-over-year growth 2024-2029 (%)
Data Table on Mexico - Year-over-year growth 2024-2029 (%)

12.6 Middle East and Africa - Market size and forecast 2024-2029

Chart on Middle East and Africa - Market size and forecast 2024-2029 ($ thousand)
Data Table on Middle East and Africa - Market size and forecast 2024-2029 ($ thousand)
Chart on Middle East and Africa - Year-over-year growth 2024-2029 (%)
Data Table on Middle East and Africa - Year-over-year growth 2024-2029 (%)
Chart on Regional Comparison - Middle East and Africa
Data Table on Regional Comparison - Middle East and Africa

12.6.1 Saudi Arabia - Market size and forecast 2024-2029

Chart on Saudi Arabia - Market size and forecast 2024-2029 ($ thousand)
Data Table on Saudi Arabia - Market size and forecast 2024-2029 ($ thousand)
Chart on Saudi Arabia - Year-over-year growth 2024-2029 (%)
Data Table on Saudi Arabia - Year-over-year growth 2024-2029 (%)

12.6.2 UAE - Market size and forecast 2024-2029

Chart on UAE - Market size and forecast 2024-2029 ($ thousand)
Data Table on UAE - Market size and forecast 2024-2029 ($ thousand)
Chart on UAE - Year-over-year growth 2024-2029 (%)
Data Table on UAE - Year-over-year growth 2024-2029 (%)

12.6.3 South Africa - Market size and forecast 2024-2029

Chart on South Africa - Market size and forecast 2024-2029 ($ thousand)
Data Table on South Africa - Market size and forecast 2024-2029 ($ thousand)
Chart on South Africa - Year-over-year growth 2024-2029 (%)
Data Table on South Africa - Year-over-year growth 2024-2029 (%)

12.6.4 Israel - Market size and forecast 2024-2029

Chart on Israel - Market size and forecast 2024-2029 ($ thousand)
Data Table on Israel - Market size and forecast 2024-2029 ($ thousand)
Chart on Israel - Year-over-year growth 2024-2029 (%)
Data Table on Israel - Year-over-year growth 2024-2029 (%)

12.6.5 Turkey - Market size and forecast 2024-2029

Chart on Turkey - Market size and forecast 2024-2029 ($ thousand)
Data Table on Turkey - Market size and forecast 2024-2029 ($ thousand)
Chart on Turkey - Year-over-year growth 2024-2029 (%)
Data Table on Turkey - Year-over-year growth 2024-2029 (%)

12.7 South America - Market size and forecast 2024-2029

Chart on South America - Market size and forecast 2024-2029 ($ thousand)
Data Table on South America - Market size and forecast 2024-2029 ($ thousand)
Chart on South America - Year-over-year growth 2024-2029 (%)
Data Table on South America - Year-over-year growth 2024-2029 (%)
Chart on Regional Comparison - South America
Data Table on Regional Comparison - South America

12.7.1 Brazil - Market size and forecast 2024-2029

Chart on Brazil - Market size and forecast 2024-2029 ($ thousand)
Data Table on Brazil - Market size and forecast 2024-2029 ($ thousand)
Chart on Brazil - Year-over-year growth 2024-2029 (%)
Data Table on Brazil - Year-over-year growth 2024-2029 (%)

12.7.2 Argentina - Market size and forecast 2024-2029

Chart on Argentina - Market size and forecast 2024-2029 ($ thousand)
Data Table on Argentina - Market size and forecast 2024-2029 ($ thousand)
Chart on Argentina - Year-over-year growth 2024-2029 (%)
Data Table on Argentina - Year-over-year growth 2024-2029 (%)

12.7.3 Colombia - Market size and forecast 2024-2029

Chart on Colombia - Market size and forecast 2024-2029 ($ thousand)
Data Table on Colombia - Market size and forecast 2024-2029 ($ thousand)
Chart on Colombia - Year-over-year growth 2024-2029 (%)
Data Table on Colombia - Year-over-year growth 2024-2029 (%)

12.8 Market opportunity by geography

Market opportunity by geography ($ thousand)
Data Tables on Market opportunity by geography ($ thousand)

13. Drivers, Challenges, and Opportunity

13.1 Market drivers

Increasing focus on employee wellbeing and productivity
Technological advancements
Increasing use at airports to allow travelers to take rest

13.2 Market challenges

Financial and infrastructure barriers limit sleeping pod deployment
Lack of awareness about sleeping pods and their benefits
Need for adherence to stringent regulations on use of electrical products

13.3 Impact of drivers and challenges

Impact of drivers and challenges in 2024 and 2029

13.4 Market opportunities

Enhanced passenger experience in travel hubs as catalyst for growth
Rising convenient lifestyles
Increasing air passenger traffic

14. Competitive Landscape

14.1 Overview

14.2

Overview on criticality of inputs and factors of differentiation

14.3 Landscape disruption

Overview on factors of disruption

14.4 Industry risks

Impact of key risks on business

15. Competitive Analysis

15.1 Companies profiled

Companies covered

15.2 Company ranking index

15.3 Market positioning of companies

Matrix on companies position and classification

15.4 Attrap Reves

Attrap Reves - Overview
Attrap Reves - Product / Service
Attrap Reves - Key offerings
SWOT

15.5 GoSleep

GoSleep - Overview
GoSleep - Product / Service
GoSleep - Key offerings
SWOT

15.6 Infinity Hospitality Services Co.

Infinity Hospitality Services Co. - Overview
Infinity Hospitality Services Co. - Product / Service
Infinity Hospitality Services Co. - Key offerings
SWOT

15.7 Metronaps

Metronaps - Overview
Metronaps - Product / Service
Metronaps - Key news
Metronaps - Key offerings
SWOT

15.8 MGH Hospitality Pte Ltd.

MGH Hospitality Pte Ltd. - Overview
MGH Hospitality Pte Ltd. - Product / Service
MGH Hospitality Pte Ltd. - Key offerings
SWOT

15.9 Minute Suites LLC

Minute Suites LLC - Overview
Minute Suites LLC - Product / Service
Minute Suites LLC - Key offerings
SWOT

15.10 NapCabs GmbH

NapCabs GmbH - Overview
NapCabs GmbH - Product / Service
NapCabs GmbH - Key offerings
SWOT

15.11 Natura Vive

Natura Vive - Overview
Natura Vive - Product / Service
Natura Vive - Key offerings
SWOT

15.12 NEW JAPAN CO. LTD.

NEW JAPAN CO. LTD. - Overview
NEW JAPAN CO. LTD. - Product / Service
NEW JAPAN CO. LTD. - Key offerings
SWOT

15.13 Nine hours Inc.

Nine hours Inc. - Overview
Nine hours Inc. - Product / Service
Nine hours Inc. - Key offerings
SWOT

15.14 Pangea Pod Hotel

Pangea Pod Hotel - Overview
Pangea Pod Hotel - Product / Service
Pangea Pod Hotel - Key offerings
SWOT

15.15 Sleepbox Inc.

Sleepbox Inc. - Overview
Sleepbox Inc. - Product / Service
Sleepbox Inc. - Key offerings
SWOT

15.16 Snooze at my space Pvt. Ltd.

Snooze at my space Pvt. Ltd. - Overview
Snooze at my space Pvt. Ltd. - Product / Service
Snooze at my space Pvt. Ltd. - Key offerings
SWOT

15.17 Yotel Ltd.

Yotel Ltd. - Overview
Yotel Ltd. - Product / Service
Yotel Ltd. - Key offerings
SWOT

15.18 ZZZleepandGo Srl

ZZZleepandGo Srl - Overview
ZZZleepandGo Srl - Product / Service
ZZZleepandGo Srl - Key offerings
SWOT

16. Appendix

16.1 Scope of the report

Market definition
Objectives
Notes and caveats

16.2 Inclusions and exclusions checklist

Inclusions checklist
Exclusions checklist

16.3 Currency conversion rates for US$

16.4 Research methodology

16.5 Data procurement

Information sources

16.6 Data validation

16.7 Validation techniques employed for market sizing

16.8 Data synthesis

16.9 360 degree market analysis

16.10 List of abbreviations

Research Methodology

Technavio presents a detailed picture of the market by way of study, synthesis, and summation of data from multiple sources. The analysts have presented the various facets of the market with a particular focus on identifying the key industry influencers. The data thus presented is comprehensive, reliable, and the result of extensive research, both primary and secondary.

INFORMATION SOURCES

Primary sources

  • Manufacturers and suppliers
  • Channel partners
  • Industry experts
  • Strategic decision makers

Secondary sources

  • Industry journals and periodicals
  • Government data
  • Financial reports of key industry players
  • Historical data
  • Press releases

DATA ANALYSIS

Data Synthesis

  • Collation of data
  • Estimation of key figures
  • Analysis of derived insights

Data Validation

  • Triangulation with data models
  • Reference against proprietary databases
  • Corroboration with industry experts

REPORT WRITING

Qualitative

  • Market drivers
  • Market challenges
  • Market trends
  • Five forces analysis

Quantitative

  • Market size and forecast
  • Market segmentation
  • Geographical insights
  • Competitive landscape

Interested in this report?

Get your sample now to see our research methodology and insights!

Download Now

Frequently Asked Questions

Sleeping Pods market growth will increase by USD 50017.2 thousand thousand during 2025-2029.

The Sleeping Pods market is expected to grow at a CAGR of 7.3% during 2025-2029.

Sleeping Pods market is segmented by End-user (Airport, Hospitals, Corporate, Others) Material type (Aluminum, Fiberglass, Wood) Product type (Single sleeping pods, Double sleeping pods, Capsule sleeping pods)

Attrap Reves, GoSleep, Infinity Hospitality Services Co., KOTOBUKI SEATING CO. LTD., Metronaps, MGH Hospitality Pte Ltd., Minute Suites LLC, NapCabs GmbH, Natura Vive, NEW JAPAN CO. LTD., Nine hours Inc., Pangea Pod Hotel, PODZONE, Sleepbox Inc., Snooze at my space Pvt. Ltd., Swashbuckler Hospitality Pvt. Ltd., Westend Rental Solutions Inc., Yotel Ltd., ZZZleepandGo Srl are a few of the key vendors in the Sleeping Pods market.

Europe will register the highest growth rate of 47.8% among the other regions. Therefore, the Sleeping Pods market in Europe is expected to garner significant business opportunities for the vendors during the forecast period.

UK, Germany, France, Italy, The Netherlands, Spain, China, Japan, India, South Korea, Australia, Indonesia, US, Canada, Mexico, Saudi Arabia, UAE, South Africa, Israel, Turkey, Brazil, Argentina, Colombia

  • Increasing focus on employee wellbeing and productivity is the driving factor this market.

The Sleeping Pods market vendors should focus on grabbing business opportunities from the End-user segment as it accounted for the largest market share in the base year.