Smart Education Software Market Analysis North America, APAC, Europe, South America, Middle East and Africa - US, China, Canada, Germany, UK - Size and Forecast 2024-2028

Smart Education Software Market Analysis North America, APAC, Europe, South America, Middle East and Africa - US, China, Canada, Germany, UK - Size and Forecast 2024-2028

Published: Jul 2024 155 Pages SKU: IRTNTR73627

Market Overview at a Glance

$34183.5 B
Market Opportunity
16.6%
CAGR
13.86
YoY growth 2023-2024(%)

Smart Education Software Market Size 2024-2028 

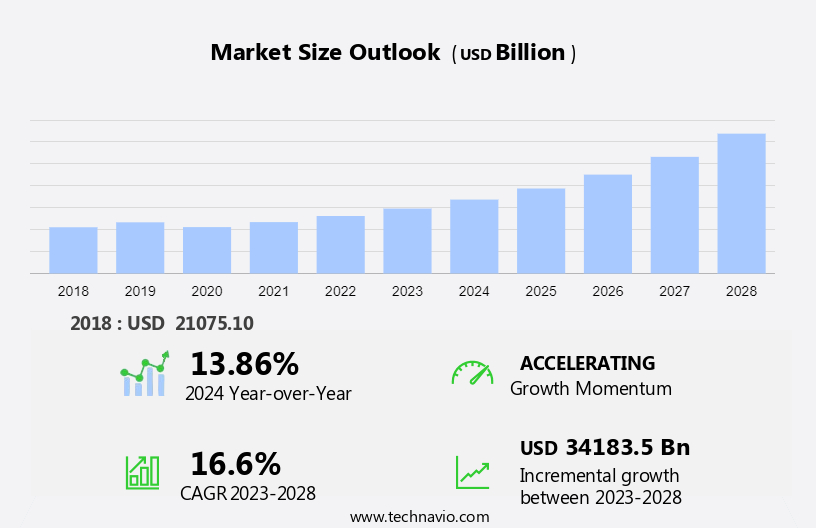
The smart education software market size is forecast to increase by USD 34,183.5 billion, at a CAGR of 16.6% between 2023 and 2028.

  • The market is experiencing significant growth due to several key trends. The increasing adoption of e-learning is driving market growth, as students and educators seek flexible and convenient learning solutions. Another trend is the rising acceptance of cloud-based software, which offers cost savings and accessibility. However, the high implementation cost of smart infrastructure remains a challenge for market growth. The smart education market, a segment of educational technology (EdTech) and e-learning, is experiencing significant growth due to the increasing adoption of gamification and IoT-enabled smart devices in teaching and learning environments. Schools and universities must invest in modern technology to provide students with an effective and engaging learning experience. Despite this challenge, the benefits of smart education software, such as personalized learning and improved student engagement, make it a worthwhile investment for educational institutions.

What will be the Size of the Smart Education Software Market During the Forecast Period?

Smart Education Software Market Size

 Request Free Sample

  • Gamification, utilizing the Octalysis Framework, enhances student engagement and motivation by integrating game elements into educational content. Transnational education (TNE) institutions are leveraging digital infrastructure, including high-speed internet and interactive whiteboards, to deliver individualized instruction and adaptive evaluations. However, challenges persist with the rise of viruses, cyberattacks, and the need for VPNs to secure data. Technology advancements, such as artificial intelligence and machine learning, are revolutionizing the delivery of smart learning solutions for colleges and institutions. Hardware suppliers, software developers, and content providers collaborate to cater to the evolving needs of corporate professionals and educators.

How is this Smart Education Software Industry segmented and which is the largest segment?

The smart education software industry research report provides comprehensive data (region-wise segment analysis), with forecasts and estimates in "USD billion" for the period 2024-2028, as well as historical data from 2018-2022 for the following segments.

  • Product
    • Content
    • Learning
    • Assessment
  • Geography
    • North America
      • Canada
      • US
    • APAC
      • China
    • Europe
      • Germany
      • UK
    • South America
    • Middle East and Africa

By Product Insights

  • The content segment is estimated to witness significant growth during the forecast period.

The market is experiencing significant growth due to the advantages it offers, such as content flexibility, increased accessibility, and interactive content like video-based learning. The proliferation of high-speed internet, smartphones, and tablets has further fueled market expansion. The market is divided into two primary content categories: packaged and customized. Packaged content, which consists of pre-determined and standardized material, dominates the market, particularly In the K-12 sector, where government-regulated course content is prevalent. Customized content, on the other hand, can be tailored to individual user requirements. The market's growth is driven by the increasing adoption of technology in educational institutions and the need for personalized learning experiences.

Smart Education Software Market Size

Get a glance at the  Smart Education Software Industry report of share of various segments Request Free Sample

The content segment was valued at USD 10,285.20 billion in 2018 and showed a gradual increase during the forecast period.

Regional Analysis

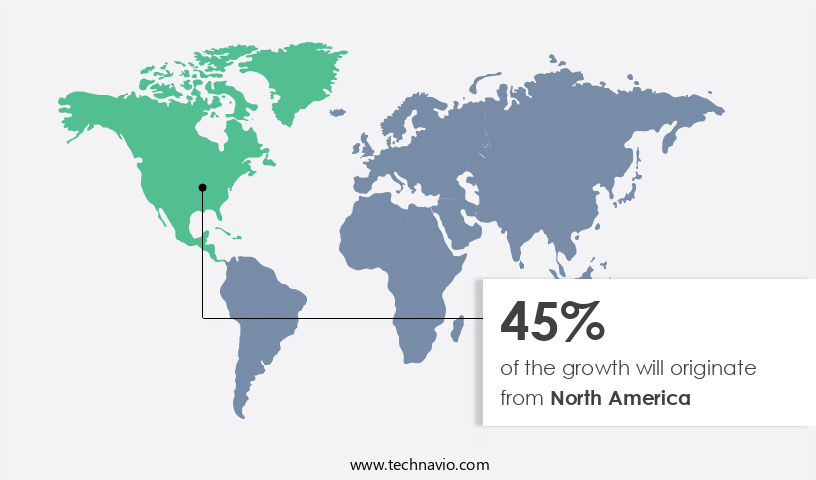
  • North America is estimated to contribute 45% to the growth of the global market during the forecast period.

Technavio's analysts have elaborately explained the regional trends and drivers that shape the market during the forecast period.

Smart Education Software Market Share by Geography

For more insights on the market share of various regions, Request Free Sample

The North American region led The market in 2023 due to the early adoption of online education, driven by increased internet penetration and advanced EdTech technologies. The US and Canada are the primary contributors to this region, with a digitally savvy population and a strong focus on technology integration in education. Government initiatives, such as the National Education Technology Plan (NETP), further encourage the use of education software in schools and colleges. These factors contribute to the significant growth of the market in North America.

Market Dynamics

Our smart education software market researchers analyzed the data with 2023 as the base year, along with the key drivers, trends, and challenges. A holistic analysis of drivers will help companies refine their marketing strategies to gain a competitive advantage.

What are the key market drivers leading to the rise In the adoption of Smart Education Software Industry?

The growing adoption of E-learning is the key driver of the market.

  • The smart learning market, a segment of Educational Technology (EdTech), is experiencing significant growth due to the integration of Gamification in education. The Octalysis Framework, a gamification system, enhances learner engagement and motivation. IoT-enabled smart devices, such as smart wearables and mobile phones, are increasingly used in K-12 and Higher Education for interactive learning. Cloud technologies and mobile technologies have transformed traditional classrooms into digital learning environments, with platforms like Google Classrooms and Blackboard Learn leading the way. The global e-learning market is driven by improved digital infrastructure, high-speed internet, and the increasing preference for individualised instruction and adaptive evaluations.
  • Artificial intelligence and machine learning are revolutionising education by providing personalised learning experiences. Transnational education (TNE) and corporate professionals are also adopting e-learning for its flexibility and convenience. However, cybersecurity concerns, including viruses and cyberattacks, are a significant challenge for the e-learning industry. VPNs and secure educational platforms are essential to ensure data security. Policies and regulations are being implemented to address these concerns and ensure the protection of student data. Hardware suppliers, software developers, and content providers are collaborating to create comprehensive e-learning solutions. Interactive displays, virtual classrooms, and interactive whiteboards are becoming increasingly popular tools for delivering engaging educational content.

What are the market trends shaping the Smart Education Software Industry?

Increasing adoption of cloud based software is the upcoming market trend.

  • The market is witnessing significant growth due to the integration of gamification techniques using frameworks like Octalysis. This trend is driving the demand for gamified learning solutions, including IoT-enabled smart devices, interactive displays, and mobile phones, in both K-12 and higher education. Cloud technologies and mobile technologies are essential components of this digital infrastructure, enabling individualized instruction, adaptive evaluations, and artificial intelligence. Transnational education (TNE) and corporate professionals are increasingly utilizing these smart learning solutions for flexible and convenient education. However, concerns around viruses and cyberattacks necessitate the use of Virtual Private Networks (VPNs) and secure educational content providers.
  • Policies and regulations are being put in place to ensure the security and privacy of student data. Hardware suppliers, software developers, and content providers are collaborating to offer comprehensive smart learning solutions. Google Classrooms and Blackboard Learn are popular platforms for K-12 education, while colleges and institutions are adopting interactive whiteboards and VPNs for secure remote learning. The adoption of high-speed internet and e-learning infrastructure is also crucial for the effective implementation of these solutions.

What challenges does the Smart Education Software Industry face during its growth?

The high implementation cost of smart infrastructure is a key challenge affecting the industry growth.

  • The market faces challenges, particularly in developing regions, due to the high costs associated with digital infrastructure and software development. The use of Gamification Octalysis Framework, IoT-enabled smart devices, and wearables in education is increasing, but the recurring costs of software upgrades can be a deterrent for adoption. Transnational education (TNE) and corporate professionals are embracing cloud technologies and mobile learning solutions, including Google Classrooms and Blackboard Learn, for individualised instruction and adaptive evaluations.
  • High-speed internet and e-learning infrastructure are essential for effective implementation, but concerns over cyberattacks and viruses persist. Hardware suppliers, software developers, and content providers are collaborating to offer comprehensive solutions. Policymakers and institutions are investing in technology to enhance K-12 and higher education, while mobile phones and interactive displays are becoming common tools In the classroom. Despite these advancements, the market growth is hindered by the ongoing costs and infrastructure challenges.

Exclusive Customer Landscape

The smart education software market forecasting report includes the adoption lifecycle of the market, covering from the innovator's stage to the laggard's stage. It focuses on adoption rates in different regions based on penetration. Furthermore, the smart education software market report also includes key purchase criteria and drivers of price sensitivity to help companies evaluate and develop their market growth analysis strategies.
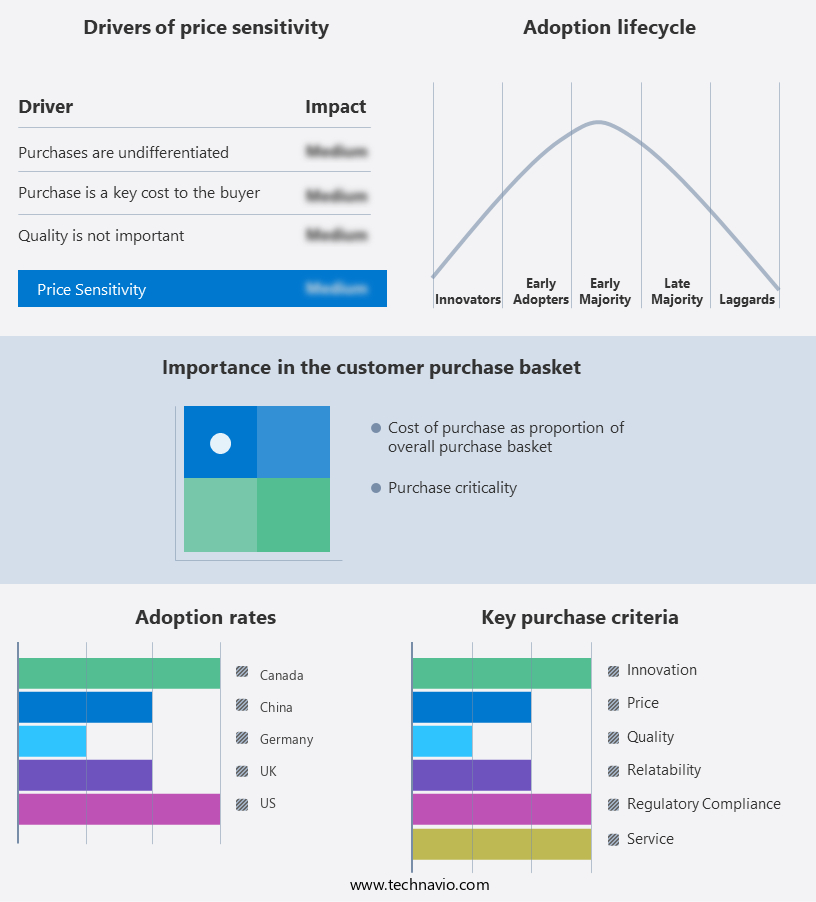
Smart Education Software Market Share by Geography

 Customer Landscape

Key Companies & Market Insights

Companies are implementing various strategies, such as strategic alliances, smart education software market forecast, partnerships, mergers and acquisitions, geographical expansion, and product/service launches, to enhance their presence In the industry.

The industry research and growth report includes detailed analyses of the competitive landscape of the market and information about key companies, including:

  • Adobe Inc.
  • Anthology Inc.
  • Apollo Asset Management Inc.
  • Cisco Systems Inc.
  • Cornerstone OnDemand Inc.
  • D2L Inc.
  • Educomp Solutions Ltd.
  • Ellucian Co.
  • Hon Hai Precision Industry Co. Ltd.
  • John Wiley and Sons Inc.
  • MPS Ltd.
  • NetDragon Websoft Holdings Ltd
  • NIIT Ltd.
  • Oracle Corp.
  • Pearson Plc
  • Promethean World Ltd.
  • SAP SE
  • Scholastic Corp.
  • Skillsoft Corp.
  • Thoma Bravo LP

Qualitative and quantitative analysis of companies has been conducted to help clients understand the wider business environment as well as the strengths and weaknesses of key industry players. Data is qualitatively analyzed to categorize companies as pure play, category-focused, industry-focused, and diversified; it is quantitatively analyzed to categorize companies as dominant, leading, strong, tentative, and weak.

Research Analyst Overview

The market is witnessing significant growth as technology continues to revolutionize the education sector. This evolution is driven by several factors, including the increasing demand for personalized learning experiences, the proliferation of digital infrastructure, and the integration of advanced technologies such as artificial intelligence and machine learning. One of the key trends shaping the market is gamification. Gamification is the application of game design elements to non-game contexts, such as education. It has been shown to increase student engagement, motivation, and learning outcomes. The Octalysis Framework, a comprehensive gamification framework, identifies eight core drives that motivate human behavior, providing a solid foundation for designing effective gamified learning experiences.

Further, another significant trend is the integration of IoT-enabled smart devices and wearables into the education system. These devices offer numerous benefits, including real-time data collection, personalized learning, and improved accessibility. For instance, smart wearables can be used to monitor students' progress, provide instant feedback, and even detect health issues that may impact learning. The increasing adoption of cloud technologies and mobile technologies in education is another major trend. Cloud technologies enable the delivery of educational content and services over the Internet, making learning more accessible and flexible. Mobile technologies, on the other hand, offer the convenience of learning on-the-go, allowing students to access educational resources from anywhere, at any time.

Despite the numerous benefits of smart education software, there are challenges that need to be addressed. One of the most significant challenges is ensuring the security of digital infrastructure. With the increasing use of technology in education, there is a growing risk of cyberattacks and viruses. Institutions must invest in strong cybersecurity measures to protect their e-learning infrastructure and the sensitive data it contains. Another challenge is the need for high-speed internet access in educational institutions. While many schools and colleges have made significant progress in this area, there are still many that lack the necessary infrastructure to support effective e-learning.

Smart Education Software Market Scope

Report Coverage

Details

Page number

155

Base year

2023

Historic period

2018-2022

Forecast period

2024-2028

Growth momentum & CAGR

Accelerate at a CAGR of 16.6%

Market Growth 2024-2028

USD 34,183.5 billion

Market structure

Fragmented

YoY growth 2023-2024(%)

13.86

Key countries

US, China, Canada, Germany, and UK

Competitive landscape

Leading Companies, Market Positioning of Companies, Competitive Strategies, and Industry Risks

Request Free Sample

What are the Key Data Covered in this Smart Education Software Market Research and Growth Report?

  • CAGR of the Smart Education Software industry during the forecast period
  • Detailed information on factors that will drive the Smart Education Software Market growth and forecasting between 2024 and 2028
  • Precise estimation of the size of the market and its contribution of the industry in focus to the parent market
  • Accurate predictions about upcoming growth and trends and changes in consumer behaviour
  • Growth of the market across North America, APAC, Europe, South America, and Middle East and Africa
  • Thorough analysis of the market's competitive landscape and detailed information about companies
  • Comprehensive analysis of factors that will challenge the smart education software market growth of industry companies

We can help! Our analysts can customize this smart education software market research report to meet your requirements.

Get in touch

1 Executive Summary

  • 1.1 Market overview
    • Executive Summary - Chart on Market Overview
    • Executive Summary - Data Table on Market Overview
    • Executive Summary - Chart on Global Market Characteristics
    • Executive Summary - Chart on Market by Geography
    • Executive Summary - Chart on Market Segmentation by Product
    • Executive Summary - Chart on Incremental Growth
    • Executive Summary - Data Table on Incremental Growth
    • Executive Summary - Chart on Company Market Positioning

2 Market Landscape

  • 2.1 Market ecosystem
    • Parent Market
    • Data Table on - Parent Market
  • 2.2 Market characteristics
    • Market characteristics analysis
  • 2.3 Value chain analysis
    • Value Chain Analysis

3 Market Sizing

  • 3.1 Market definition
    • Offerings of companies included in the market definition
  • 3.2 Market segment analysis
    • Market segments
  • 3.3 Market size 2023
    • 3.4 Market outlook: Forecast for 2023-2028
      • Chart on Global - Market size and forecast 2023-2028 ($ billion)
      • Data Table on Global - Market size and forecast 2023-2028 ($ billion)
      • Chart on Global Market: Year-over-year growth 2023-2028 (%)
      • Data Table on Global Market: Year-over-year growth 2023-2028 (%)

    4 Historic Market Size

    • 4.1 Global Smart Education Software Market 2018 - 2022
      • Historic Market Size - Data Table on Global Smart Education Software Market 2018 - 2022 ($ billion)
    • 4.2 Product segment analysis 2018 - 2022
      • Historic Market Size - Product Segment 2018 - 2022 ($ billion)
    • 4.3 Geography segment analysis 2018 - 2022
      • Historic Market Size - Geography Segment 2018 - 2022 ($ billion)
    • 4.4 Country segment analysis 2018 - 2022
      • Historic Market Size - Country Segment 2018 - 2022 ($ billion)

    5 Five Forces Analysis

    • 5.1 Five forces summary
      • Five forces analysis - Comparison between 2023 and 2028
    • 5.2 Bargaining power of buyers
      • Bargaining power of buyers - Impact of key factors 2023 and 2028
    • 5.3 Bargaining power of suppliers
      • Bargaining power of suppliers - Impact of key factors in 2023 and 2028
    • 5.4 Threat of new entrants
      • Threat of new entrants - Impact of key factors in 2023 and 2028
    • 5.5 Threat of substitutes
      • Threat of substitutes - Impact of key factors in 2023 and 2028
    • 5.6 Threat of rivalry
      • Threat of rivalry - Impact of key factors in 2023 and 2028
    • 5.7 Market condition
      • Chart on Market condition - Five forces 2023 and 2028

    6 Market Segmentation by Product

    • 6.1 Market segments
      • Chart on Product - Market share 2023-2028 (%)
      • Data Table on Product - Market share 2023-2028 (%)
    • 6.2 Comparison by Product
      • Chart on Comparison by Product
      • Data Table on Comparison by Product
    • 6.3 Content - Market size and forecast 2023-2028
      • Chart on Content - Market size and forecast 2023-2028 ($ billion)
      • Data Table on Content - Market size and forecast 2023-2028 ($ billion)
      • Chart on Content - Year-over-year growth 2023-2028 (%)
      • Data Table on Content - Year-over-year growth 2023-2028 (%)
    • 6.4 Learning - Market size and forecast 2023-2028
      • Chart on Learning - Market size and forecast 2023-2028 ($ billion)
      • Data Table on Learning - Market size and forecast 2023-2028 ($ billion)
      • Chart on Learning - Year-over-year growth 2023-2028 (%)
      • Data Table on Learning - Year-over-year growth 2023-2028 (%)
    • 6.5 Assessment - Market size and forecast 2023-2028
      • Chart on Assessment - Market size and forecast 2023-2028 ($ billion)
      • Data Table on Assessment - Market size and forecast 2023-2028 ($ billion)
      • Chart on Assessment - Year-over-year growth 2023-2028 (%)
      • Data Table on Assessment - Year-over-year growth 2023-2028 (%)
    • 6.6 Market opportunity by Product
      • Market opportunity by Product ($ billion)
      • Data Table on Market opportunity by Product ($ billion)

    7 Customer Landscape

    • 7.1 Customer landscape overview
      • Analysis of price sensitivity, lifecycle, customer purchase basket, adoption rates, and purchase criteria

    8 Geographic Landscape

    • 8.1 Geographic segmentation
      • Chart on Market share by geography 2023-2028 (%)
      • Data Table on Market share by geography 2023-2028 (%)
    • 8.2 Geographic comparison
      • Chart on Geographic comparison
      • Data Table on Geographic comparison
    • 8.3 North America - Market size and forecast 2023-2028
      • Chart on North America - Market size and forecast 2023-2028 ($ billion)
      • Data Table on North America - Market size and forecast 2023-2028 ($ billion)
      • Chart on North America - Year-over-year growth 2023-2028 (%)
      • Data Table on North America - Year-over-year growth 2023-2028 (%)
    • 8.4 APAC - Market size and forecast 2023-2028
      • Chart on APAC - Market size and forecast 2023-2028 ($ billion)
      • Data Table on APAC - Market size and forecast 2023-2028 ($ billion)
      • Chart on APAC - Year-over-year growth 2023-2028 (%)
      • Data Table on APAC - Year-over-year growth 2023-2028 (%)
    • 8.5 Europe - Market size and forecast 2023-2028
      • Chart on Europe - Market size and forecast 2023-2028 ($ billion)
      • Data Table on Europe - Market size and forecast 2023-2028 ($ billion)
      • Chart on Europe - Year-over-year growth 2023-2028 (%)
      • Data Table on Europe - Year-over-year growth 2023-2028 (%)
    • 8.6 South America - Market size and forecast 2023-2028
      • Chart on South America - Market size and forecast 2023-2028 ($ billion)
      • Data Table on South America - Market size and forecast 2023-2028 ($ billion)
      • Chart on South America - Year-over-year growth 2023-2028 (%)
      • Data Table on South America - Year-over-year growth 2023-2028 (%)
    • 8.7 Middle East and Africa - Market size and forecast 2023-2028
      • Chart on Middle East and Africa - Market size and forecast 2023-2028 ($ billion)
      • Data Table on Middle East and Africa - Market size and forecast 2023-2028 ($ billion)
      • Chart on Middle East and Africa - Year-over-year growth 2023-2028 (%)
      • Data Table on Middle East and Africa - Year-over-year growth 2023-2028 (%)
    • 8.8 US - Market size and forecast 2023-2028
      • Chart on US - Market size and forecast 2023-2028 ($ billion)
      • Data Table on US - Market size and forecast 2023-2028 ($ billion)
      • Chart on US - Year-over-year growth 2023-2028 (%)
      • Data Table on US - Year-over-year growth 2023-2028 (%)
    • 8.9 China - Market size and forecast 2023-2028
      • Chart on China - Market size and forecast 2023-2028 ($ billion)
      • Data Table on China - Market size and forecast 2023-2028 ($ billion)
      • Chart on China - Year-over-year growth 2023-2028 (%)
      • Data Table on China - Year-over-year growth 2023-2028 (%)
    • 8.10 Canada - Market size and forecast 2023-2028
      • Chart on Canada - Market size and forecast 2023-2028 ($ billion)
      • Data Table on Canada - Market size and forecast 2023-2028 ($ billion)
      • Chart on Canada - Year-over-year growth 2023-2028 (%)
      • Data Table on Canada - Year-over-year growth 2023-2028 (%)
    • 8.11 Germany - Market size and forecast 2023-2028
      • Chart on Germany - Market size and forecast 2023-2028 ($ billion)
      • Data Table on Germany - Market size and forecast 2023-2028 ($ billion)
      • Chart on Germany - Year-over-year growth 2023-2028 (%)
      • Data Table on Germany - Year-over-year growth 2023-2028 (%)
    • 8.12 UK - Market size and forecast 2023-2028
      • Chart on UK - Market size and forecast 2023-2028 ($ billion)
      • Data Table on UK - Market size and forecast 2023-2028 ($ billion)
      • Chart on UK - Year-over-year growth 2023-2028 (%)
      • Data Table on UK - Year-over-year growth 2023-2028 (%)
    • 8.13 Market opportunity by geography
      • Market opportunity by geography ($ billion)
      • Data Tables on Market opportunity by geography ($ billion)

    9 Drivers, Challenges, and Opportunity/Restraints

    • 9.1 Market drivers
      • 9.2 Market challenges
        • 9.3 Impact of drivers and challenges
          • Impact of drivers and challenges in 2023 and 2028
        • 9.4 Market opportunities/restraints

          10 Competitive Landscape

          • 10.1 Overview
            • 10.2 Competitive Landscape
              • Overview on criticality of inputs and factors of differentiation
            • 10.3 Landscape disruption
              • Overview on factors of disruption
            • 10.4 Industry risks
              • Impact of key risks on business

            11 Competitive Analysis

            • 11.1 Companies profiled
              • Companies covered
            • 11.2 Market positioning of companies
              • Matrix on companies position and classification
            • 11.3 Adobe Inc.
              • Adobe Inc. - Overview
              • Adobe Inc. - Business segments
              • Adobe Inc. - Key news
              • Adobe Inc. - Key offerings
              • Adobe Inc. - Segment focus
            • 11.4 Anthology Inc.
              • Anthology Inc. - Overview
              • Anthology Inc. - Product / Service
              • Anthology Inc. - Key news
              • Anthology Inc. - Key offerings
            • 11.5 Cisco Systems Inc.
              • Cisco Systems Inc. - Overview
              • Cisco Systems Inc. - Business segments
              • Cisco Systems Inc. - Key news
              • Cisco Systems Inc. - Key offerings
              • Cisco Systems Inc. - Segment focus
            • 11.6 Cornerstone OnDemand Inc.
              • Cornerstone OnDemand Inc. - Overview
              • Cornerstone OnDemand Inc. - Product / Service
              • Cornerstone OnDemand Inc. - Key news
              • Cornerstone OnDemand Inc. - Key offerings
            • 11.7 D2L Inc.
              • D2L Inc. - Overview
              • D2L Inc. - Product / Service
              • D2L Inc. - Key news
              • D2L Inc. - Key offerings
            • 11.8 Hon Hai Precision Industry Co. Ltd.
              • Hon Hai Precision Industry Co. Ltd. - Overview
              • Hon Hai Precision Industry Co. Ltd. - Product / Service
              • Hon Hai Precision Industry Co. Ltd. - Key offerings
            • 11.9 John Wiley and Sons Inc.
              • John Wiley and Sons Inc. - Overview
              • John Wiley and Sons Inc. - Business segments
              • John Wiley and Sons Inc. - Key news
              • John Wiley and Sons Inc. - Key offerings
              • John Wiley and Sons Inc. - Segment focus
            • 11.10 NetDragon Websoft Holdings Ltd
              • NetDragon Websoft Holdings Ltd - Overview
              • NetDragon Websoft Holdings Ltd - Business segments
              • NetDragon Websoft Holdings Ltd - Key offerings
              • NetDragon Websoft Holdings Ltd - Segment focus
            • 11.11 Pearson Plc
              • Pearson Plc - Overview
              • Pearson Plc - Business segments
              • Pearson Plc - Key news
              • Pearson Plc - Key offerings
              • Pearson Plc - Segment focus
            • 11.12 Thoma Bravo LP
              • Thoma Bravo LP - Overview
              • Thoma Bravo LP - Product / Service
              • Thoma Bravo LP - Key offerings

            12 Appendix

            • 12.1 Scope of the report
              • 12.2 Inclusions and exclusions checklist
                • Inclusions checklist
                • Exclusions checklist
              • 12.3 Currency conversion rates for US$
                • Currency conversion rates for US$
              • 12.4 Research methodology
                • Research methodology
              • 12.5 Data procurement
                • Information sources
              • 12.6 Data validation
                • Data validation
              • 12.7 Validation techniques employed for market sizing
                • Validation techniques employed for market sizing
              • 12.8 Data synthesis
                • Data synthesis
              • 12.9 360 degree market analysis
                • 360 degree market analysis
              • 12.10 List of abbreviations
                • List of abbreviations

              Research Methodology

              Technavio presents a detailed picture of the market by way of study, synthesis, and summation of data from multiple sources. The analysts have presented the various facets of the market with a particular focus on identifying the key industry influencers. The data thus presented is comprehensive, reliable, and the result of extensive research, both primary and secondary.

              INFORMATION SOURCES

              Primary sources

              • Manufacturers and suppliers
              • Channel partners
              • Industry experts
              • Strategic decision makers

              Secondary sources

              • Industry journals and periodicals
              • Government data
              • Financial reports of key industry players
              • Historical data
              • Press releases

              DATA ANALYSIS

              Data Synthesis

              • Collation of data
              • Estimation of key figures
              • Analysis of derived insights

              Data Validation

              • Triangulation with data models
              • Reference against proprietary databases
              • Corroboration with industry experts

              REPORT WRITING

              Qualitative

              • Market drivers
              • Market challenges
              • Market trends
              • Five forces analysis

              Quantitative

              • Market size and forecast
              • Market segmentation
              • Geographical insights
              • Competitive landscape

              Interested in this report?

              Get your sample now to see our research methodology and insights!

              Download Now

              Frequently Asked Questions

              Smart Education Software market growth will increase by $ 34183.5 bn during 2024-2028.

              The Smart Education Software market is expected to grow at a CAGR of 16.6% during 2024-2028.

              Smart Education Software market is segmented by Product( Content, Learning, Assessment)

              Adobe Inc., Anthology Inc., Apollo Asset Management Inc., Cisco Systems Inc., Cornerstone OnDemand Inc., D2L Inc., Educomp Solutions Ltd., Ellucian Co., Hon Hai Precision Industry Co. Ltd., John Wiley and Sons Inc., MPS Ltd., NetDragon Websoft Holdings Ltd, NIIT Ltd., Oracle Corp., Pearson Plc, Promethean World Ltd., SAP SE, Scholastic Corp., Skillsoft Corp., Thoma Bravo LP are a few of the key vendors in the Smart Education Software market.

              North America will register the highest growth rate of 45% among the other regions. Therefore, the Smart Education Software market in North America is expected to garner significant business opportunities for the vendors during the forecast period.

              US, China, Canada, Germany, UK

              • Growing adoption of E-learningImproved digital infrastructure and high penetration of the Internet have increased the preference for e-learning over traditional education because of the benefits it provides in terms of flexibility of time and place in content accessibility and scope for customization is the driving factor this market.
              • of course.Currently is the driving factor this market.
              • more than 50% of the worldwide population uses the Internet is the driving factor this market.
              • with significant penetration in the past few years. North America has the highest Internet penetration worldwide is the driving factor this market.
              • and APAC has the highest number of Internet users worldwide. This kind of Internet penetration has increased accessibility to e-learning and is fueling the growth of the global online education market. Furthermore is the driving factor this market.
              • e-learning is an advantage for working professionals; they are one of the prominent users of e-learning for skill development. With the kind of schedule is the driving factor this market.
              • these professionals have is the driving factor this market.
              • traditional skill development classroom sessions are not possible. The increased availability of skill development courses in an online format has made it easy for them to include them in their schedule. Therefore is the driving factor this market.
              • increased Internet penetration and a huge demand for e-learning are fueling the growth of the online education market. Further is the driving factor this market.
              • users prefer online education that is more interactive to achieve the desired results is the driving factor this market.
              • which is driving the demand for smart education software solutions and bringing about market growth during the forecast period. is the driving factor this market.

              The Smart Education Software market vendors should focus on grabbing business opportunities from the Content segment as it accounted for the largest market share in the base year.