Smart Elevator Market Analysis North America, Europe, APAC, Middle East and Africa, South America - US, UK, China, Germany, Japan - Size and Forecast 2024-2028

Smart Elevator Market Analysis North America, Europe, APAC, Middle East and Africa, South America - US, UK, China, Germany, Japan - Size and Forecast 2024-2028

Published: Aug 2024 178 Pages SKU: IRTNTR70819

Market Overview at a Glance

$4.92 B
Market Opportunity
6.78%
CAGR
6.23
YoY growth 2023-2024(%)

Smart Elevator Market Size 2024-2028 

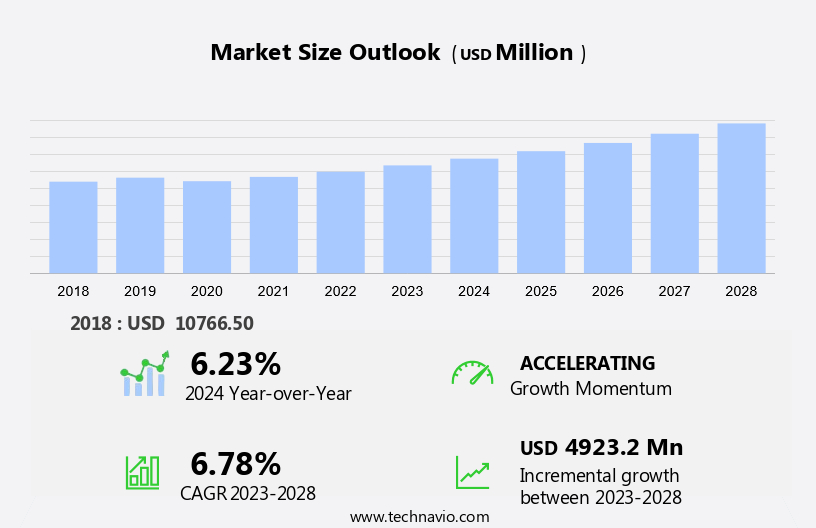
The smart elevator market size is forecast to increase by USD 4.92 million at a CAGR of 6.78% between 2023 and 2028. The market is experiencing significant growth due to the increasing demand for energy-efficient solutions in freight carriage and elevator systems. With the rise of green buildings, there is a heightened focus on reducing energy consumption, making energy-efficient elevators a priority. Cloud predictive maintenance is also gaining traction, enabling real-time monitoring and predictive analysis, thereby enhancing system performance and reducing downtime. Intense competition among market players is driving innovation and the integration of advanced technologies such as IoT, AI, and machine learning to offer more efficient and cost-effective solutions. Key hardware components, including sensors, controllers, and actuators, are becoming more sophisticated, enabling seamless integration and improved system functionality. These trends are shaping the future of the market, offering numerous opportunities for growth.

Smart Elevator Market Size

 Request Free Sample

The market is experiencing significant growth in the building sector, particularly in high-rise buildings, as urbanization and the development of smart cities continue to gain momentum. This trend is driven by the need for energy efficiency, advanced control systems, and the integration of various technologies such as artificial intelligence (AI), cloud computing, and the Internet of Things (IoT). Energy consumption is a major concern in buildings, and smart elevators are playing a crucial role in reducing energy waste. These systems use destination-oriented technology, which optimizes elevator routes based on passenger demand, thereby reducing the number of stops and the amount of energy consumed.

Moreover, the integration of AI and cloud predictive maintenance enables real-time monitoring and analysis of elevator performance, allowing for proactive maintenance and further energy savings. Smart technology, including AI, sensors, and infotainment systems, is also being integrated into passenger and freight elevator systems. These features enhance the user experience, provide real-time information, and enable remote monitoring and management. Green buildings, which prioritize energy efficiency and sustainability, are particularly adopting smart elevator systems to meet their sustainability goals. The construction industry is also embracing smart elevators as part of the building process. Elevator manufacturers are developing hardware and software solutions to streamline the installation and integration of these systems into new buildings.

Further, virtual reality diagnostics are being used to simulate elevator performance and optimize design, reducing the need for physical testing and minimizing construction time. The integration of smart technology in elevators is not limited to high-rise buildings. Low and mid-rise buildings are also adopting these systems to improve energy efficiency and enhance the user experience. The use of cloud computing and AI enables remote monitoring and management of these systems, reducing maintenance costs and increasing reliability.

In conclusion, the market is a key component of the building sector, particularly in the context of urbanization and the development of smart cities. The integration of advanced technologies such as AI, cloud computing, and the IoT is driving innovation and improving energy efficiency in both passenger and freight elevator systems. The construction industry is also embracing these systems to streamline the building process and enhance the user experience. Smart elevators are an essential element of green buildings and are expected to continue gaining popularity in the building sector.

Market Segmentation

The market research report provides comprehensive data (region-wise segment analysis), with forecasts and estimates in "USD million" for the period 2024-2028, as well as historical data from 2018-2022 for the following segments.

  • Service
    • Modernization
    • New deployment
    • Maintenance
  • Application
    • Commercial
    • Residential
    • Industrial
  • Geography
    • North America
      • US
    • Europe
      • Germany
      • UK
    • APAC
      • China
      • Japan
    • Middle East and Africa
    • South America

By Service Insights

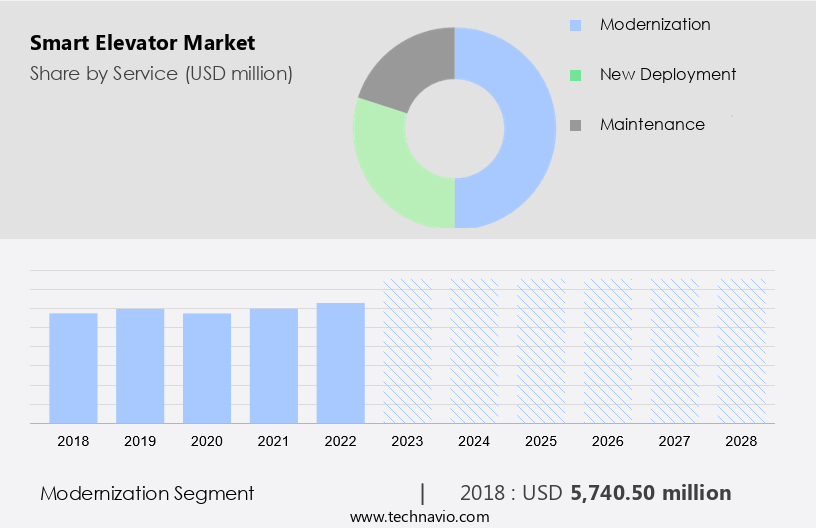
The modernization segment is estimated to witness significant growth during the forecast period. In the realm of modern building infrastructure, elevators play a pivotal role, particularly in high-rise structures. With a typical service life spanning three to four decades, these systems require consistent maintenance to ensure optimal performance. However, as elevators age, sourcing essential components and spare parts for older models becomes increasingly challenging. Consequently, the demand for upgrading to smart elevators arises. Modernization, the process of upgrading elevator systems, is gaining traction as technology advances. This transformation involves integrating Internet of Things (IoT) capabilities and infotainment systems to enhance efficiency and user experience. In the context of energy conservation, deploying smart elevators is a crucial step towards increased building efficiency.

Also, as the construction industry shifts towards more sustainable and technologically advanced designs, the adoption of energy-efficient elevator systems becomes a priority. By upgrading to smart elevators, buildings can benefit from improved performance, reduced energy consumption, and a more seamless user experience. The integration of IoT and infotainment systems enables real-time monitoring, predictive maintenance, and personalized services for occupants. In conclusion, the need for modernization and upgrading to smart elevators is a response to the challenges posed by aging infrastructure and the demand for more efficient and technologically advanced building systems. The integration of IoT and infotainment systems in elevators is a significant step towards enhancing the overall performance and user experience in both high-rise and low/mid-rise buildings.

Smart Elevator Market Size

Get a glance at the market share of various segments Request Free Sample

The modernization segment was valued at USD 5.74 billion in 2018 and showed a gradual increase during the forecast period.

Regional Insights

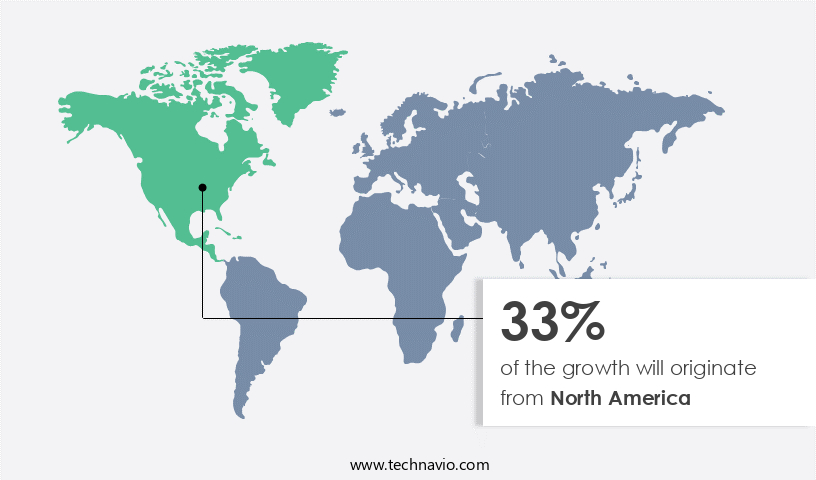
North America is estimated to contribute 33% to the growth of the global market during the forecast period. Technavio's analysts have elaborately explained the regional trends and drivers that shape the market during the forecast period.

Smart Elevator Market Share by Geography

For more insights on the market share of various regions Request Free Sample

In North America, the market is primarily driven by the United States due to the prevalence of numerous high-rise buildings in the country. The aging fleet of elevators in the US and Canada has led to an increased demand for modernizing existing elevators. Furthermore, the construction of new high-rise projects will fuel the need for advanced smart elevators.

For instance, in Canada, Frank Gehry's plans to construct two towering buildings, measuring 298 meters and 262 meters high, in Toronto, are expected to be completed during the forecast period. Urbanization and the subsequent increase in high-rise structures are key factors contributing to the growth of the market in North America. Virtual reality diagnostics and spatial technologies are also gaining popularity in the elevator industry, providing maintenance teams with real-time data to enhance elevator performance and prevent potential breakdowns. These advancements are expected to further boost the market growth in the region.

Our researchers analyzed the data with 2023 as the base year, along with the key drivers, trends, and challenges. A holistic analysis of drivers will help companies refine their marketing strategies to gain a competitive advantage.

Market Driver

The growing number of construction activities is the key driver of the market. In the realm of building construction, Artificial Intelligence (AI) is increasingly being integrated to enhance efficiency and productivity. Developed countries like the US and Canada, along with the European Union (EU), are focusing on upgrading their existing infrastructure, creating a significant demand for smart solutions in the construction industry.

The residential sector has experienced a notable uptick in spending, fueled by the economic recovery in the US since the 2008 recession. This optimism among homebuyers has led to an increased demand for new single- and multi-family homes. In this context, AI-driven technologies, such as cloud computing and advanced cameras, are playing a pivotal role in streamlining construction processes, reducing costs, and improving overall project outcomes. These innovations are expected to revolutionize the construction sector in the US and beyond.

Market Trends

Cloud predictive maintenance is the upcoming trend in the market. In the modern era of energy-conscious construction, the significance of energy-efficient freight elevator systems in green buildings has escalated. IoT-enabled smart elevators play a pivotal role in minimizing energy consumption and ensuring optimal performance.

Moreover, these systems collect data on elevator operations and analyze it against historical data to predict potential component failures. By alerting service engineers in advance, these elevators reduce downtime and save costs on repairs. 

Market Challenge

The intense competition is a key challenge affecting the market growth. The market in the United States is witnessing significant growth, driven by the adoption of advanced technologies such as cloud predictive maintenance and destination-oriented technology. New entrants, such as Hitachi Elevators, are also entering the market due to its expansion. The increasing competition has led to price wars among companies, resulting in reduced profit margins.

However, elevator control technology is a crucial aspect of this market, with companies focusing on developing innovative solutions to meet the evolving needs of commercial applications. The companies must stay competitive by offering cost-effective solutions while maintaining high-quality control systems.

Exclusive Customer Landscape

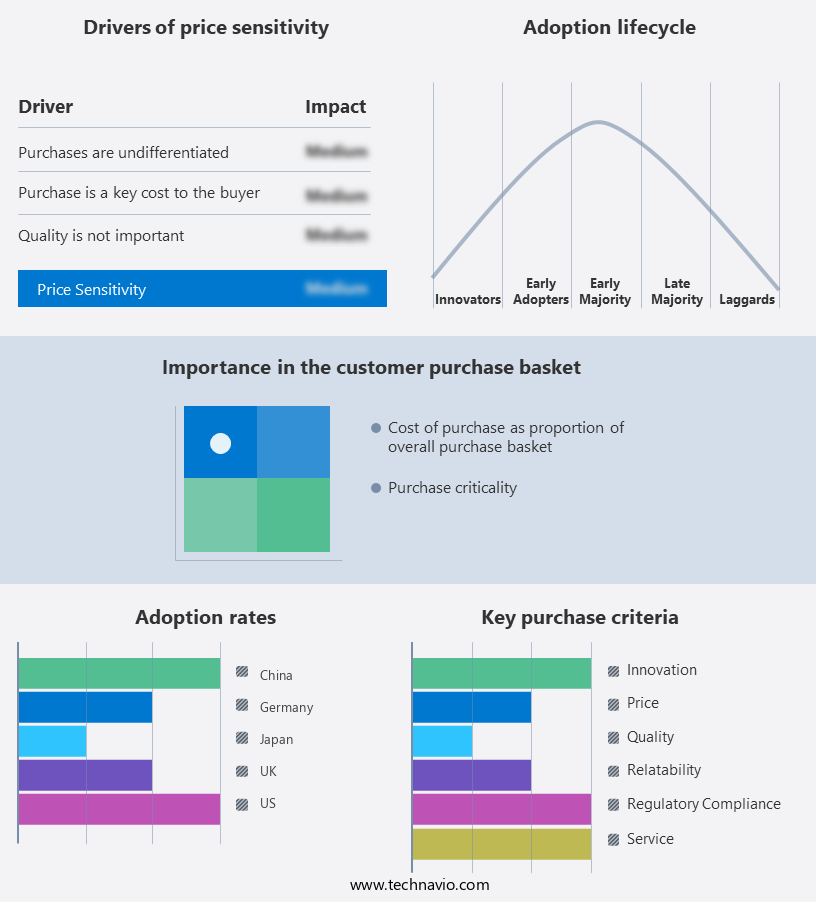
The market forecasting report includes the adoption lifecycle of the market, covering from the innovator's stage to the laggard's stage. It focuses on adoption rates in different regions based on penetration. Furthermore, the report also includes key purchase criteria and drivers of price sensitivity to help companies evaluate and develop their market growth analysis strategies.

Smart Elevator Market Share by Geography

 Customer Landscape

Key Companies & Market Insights

Companies are implementing various strategies, such as strategic alliances, partnerships, mergers and acquisitions, geographical expansion, and product/service launches, to enhance their presence in the market.

Hyundai Elevator Co. Ltd. - The company offers smart elevators such as i-XEL and THE EL. They manufacture, install, sell, and service elevators, escalators, moving walkways, automated parking systems, and material handling systems.

The market research and growth report includes detailed analyses of the competitive landscape of the market and information about key companies, including:

  • Express Lifts Ltd.
  • Fujitec Co. Ltd.
  • Halma Plc
  • Hitachi Ltd.
  • Honeywell International Inc.
  • Huawei Technologies Co. Ltd.
  • Johnson Lifts Pvt. Ltd.
  • KONE Corp.
  • Mitsubishi Electric Corp.
  • Nidec Corp.
  • Otis Worldwide Corp.
  • Robert Bosch GmbH
  • Robustel
  • Schindler Holding Ltd.
  • Sigma Elevator Co.
  • thyssenkrupp AG
  • TK Elevator GmbH
  • Toshiba Corp.
  • Vantage Elevation LLC

Qualitative and quantitative analysis of companies has been conducted to help clients understand the wider business environment as well as the strengths and weaknesses of key market players. Data is qualitatively analyzed to categorize companies as pure play, category-focused, industry-focused, and diversified; it is quantitatively analyzed to categorize companies as dominant, leading, strong, tentative, and weak.

Research Analyst Overview

The market is experiencing significant growth due to the integration of artificial intelligence (AI) and IoT technologies in elevator control systems. These advanced technologies enable destination-oriented technology, cloud predictive maintenance, and energy efficiency features, making elevators an essential component of green buildings and smart cities. In the building construction sector, both high-rise and low & mid-rise structures are adopting smart elevator systems for commercial applications. These systems offer infotainment systems, virtual reality diagnostics, and regenerative drive features, enhancing the user experience and reducing energy consumption. Manufacturers provide new installation services, modernization, and renovation services to cater to the increasing demand for smart elevator systems.

In conclusion, control systems in these elevators use sensors and cameras for safety and security purposes. The integration of AI and spatial technologies enables virtual diagnostics and real-time maintenance, reducing downtime and improving overall efficiency. Freight elevator systems also benefit from smart technology, offering energy-efficient solutions for urbanization and the logistics sector. Overall, the market is poised for growth, with cloud computing and software solutions playing a crucial role in optimizing elevator performance and reducing energy consumption.

Market Scope

Report Coverage

Details

Page number

178

Base year

2023

Historic period

2018-2022

Forecast period

2024-2028

Growth momentum & CAGR

Accelerate at a CAGR of 6.78%

Market growth 2024-2028

USD 4.92 billion

Market structure

Fragmented

YoY growth 2023-2024(%)

6.23

Regional analysis

North America, Europe, APAC, Middle East and Africa, and South America

Performing market contribution

North America at 33%

Key countries

US, UK, China, Germany, and Japan

Competitive landscape

Leading Companies, Market Positioning of Companies, Competitive Strategies, and Industry Risks

Key companies profiled

Express Lifts Ltd., Fujitec Co. Ltd., Halma Plc, Hitachi Ltd., Honeywell International Inc., Huawei Technologies Co. Ltd., Hyundai Elevator Co. Ltd., Johnson Lifts Pvt. Ltd., KONE Corp., Mitsubishi Electric Corp., Nidec Corp., Otis Worldwide Corp., Robert Bosch GmbH, Robustel, Schindler Holding Ltd., Sigma Elevator Co., thyssenkrupp AG, TK Elevator GmbH, Toshiba Corp., and Vantage Elevation LLC

Market dynamics

Parent market analysis, market growth inducers and obstacles, market forecast, fast-growing and slow-growing segment analysis, COVID-19 impact and recovery analysis and future consumer dynamics, market condition analysis for the forecast period

Customization purview

If our market report has not included the data that you are looking for, you can reach out to our analysts and get segments customized.

Request Free Sample

What are the Key Data Covered in this Market Research and Growth Report?

  • CAGR of the market during the forecast period
  • Detailed information on factors that will drive the market growth and forecasting between 2024 and 2028
  • Precise estimation of the size of the market  and its contribution of the market in focus to the parent market
  • Accurate predictions about upcoming market growth and trends and changes in consumer behaviour
  • Growth of the market across North America, Europe, APAC, Middle East and Africa, and South America
  • Thorough analysis of the market's competitive landscape and detailed information about companies
  • Comprehensive analysis of factors that will challenge the growth of market companies

We can help! Our analysts can customize this market research report to meet your requirements. Get in touch

1 Executive Summary

  • 1.1 Market overview
    • Executive Summary - Chart on Market Overview
    • Executive Summary - Data Table on Market Overview
    • Executive Summary - Chart on Global Market Characteristics
    • Executive Summary - Chart on Market by Geography
    • Executive Summary - Chart on Market Segmentation by Service
    • Executive Summary - Chart on Market Segmentation by Application
    • Executive Summary - Chart on Incremental Growth
    • Executive Summary - Data Table on Incremental Growth
    • Executive Summary - Chart on Company Market Positioning

2 Market Landscape

  • 2.1 Market ecosystem
    • Parent Market
    • Data Table on - Parent Market
  • 2.2 Market characteristics
    • Market characteristics analysis
  • 2.3 Value chain analysis
    • Value Chain Analysis

3 Market Sizing

  • 3.1 Market definition
    • Offerings of companies included in the market definition
  • 3.2 Market segment analysis
    • Market segments
  • 3.3 Market size 2023
    • 3.4 Market outlook: Forecast for 2023-2028
      • Chart on Global - Market size and forecast 2023-2028 ($ million)
      • Data Table on Global - Market size and forecast 2023-2028 ($ million)
      • Chart on Global Market: Year-over-year growth 2023-2028 (%)
      • Data Table on Global Market: Year-over-year growth 2023-2028 (%)

    4 Historic Market Size

    • 4.1 Global Smart Elevator Market 2018 - 2022
      • Historic Market Size - Data Table on Global Smart Elevator Market 2018 - 2022 ($ million)
    • 4.2 Service segment analysis 2018 - 2022
      • Historic Market Size - Service Segment 2018 - 2022 ($ million)
    • 4.3 Application segment analysis 2018 - 2022
      • Historic Market Size - Application Segment 2018 - 2022 ($ million)
    • 4.4 Geography segment analysis 2018 - 2022
      • Historic Market Size - Geography Segment 2018 - 2022 ($ million)
    • 4.5 Country segment analysis 2018 - 2022
      • Historic Market Size - Country Segment 2018 - 2022 ($ million)

    5 Five Forces Analysis

    • 5.1 Five forces summary
      • Five forces analysis - Comparison between 2023 and 2028
    • 5.2 Bargaining power of buyers
      • Bargaining power of buyers - Impact of key factors 2023 and 2028
    • 5.3 Bargaining power of suppliers
      • Bargaining power of suppliers - Impact of key factors in 2023 and 2028
    • 5.4 Threat of new entrants
      • Threat of new entrants - Impact of key factors in 2023 and 2028
    • 5.5 Threat of substitutes
      • Threat of substitutes - Impact of key factors in 2023 and 2028
    • 5.6 Threat of rivalry
      • Threat of rivalry - Impact of key factors in 2023 and 2028
    • 5.7 Market condition
      • Chart on Market condition - Five forces 2023 and 2028

    6 Market Segmentation by Service

    • 6.1 Market segments
      • Chart on Service - Market share 2023-2028 (%)
      • Data Table on Service - Market share 2023-2028 (%)
    • 6.2 Comparison by Service
      • Chart on Comparison by Service
      • Data Table on Comparison by Service
    • 6.3 Modernization - Market size and forecast 2023-2028
      • Chart on Modernization - Market size and forecast 2023-2028 ($ million)
      • Data Table on Modernization - Market size and forecast 2023-2028 ($ million)
      • Chart on Modernization - Year-over-year growth 2023-2028 (%)
      • Data Table on Modernization - Year-over-year growth 2023-2028 (%)
    • 6.4 New deployment - Market size and forecast 2023-2028
      • Chart on New deployment - Market size and forecast 2023-2028 ($ million)
      • Data Table on New deployment - Market size and forecast 2023-2028 ($ million)
      • Chart on New deployment - Year-over-year growth 2023-2028 (%)
      • Data Table on New deployment - Year-over-year growth 2023-2028 (%)
    • 6.5 Maintenance - Market size and forecast 2023-2028
      • Chart on Maintenance - Market size and forecast 2023-2028 ($ million)
      • Data Table on Maintenance - Market size and forecast 2023-2028 ($ million)
      • Chart on Maintenance - Year-over-year growth 2023-2028 (%)
      • Data Table on Maintenance - Year-over-year growth 2023-2028 (%)
    • 6.6 Market opportunity by Service
      • Market opportunity by Service ($ million)
      • Data Table on Market opportunity by Service ($ million)

    7 Market Segmentation by Application

    • 7.1 Market segments
      • Chart on Application - Market share 2023-2028 (%)
      • Data Table on Application - Market share 2023-2028 (%)
    • 7.2 Comparison by Application
      • Chart on Comparison by Application
      • Data Table on Comparison by Application
    • 7.3 Commercial - Market size and forecast 2023-2028
      • Chart on Commercial - Market size and forecast 2023-2028 ($ million)
      • Data Table on Commercial - Market size and forecast 2023-2028 ($ million)
      • Chart on Commercial - Year-over-year growth 2023-2028 (%)
      • Data Table on Commercial - Year-over-year growth 2023-2028 (%)
    • 7.4 Residential - Market size and forecast 2023-2028
      • Chart on Residential - Market size and forecast 2023-2028 ($ million)
      • Data Table on Residential - Market size and forecast 2023-2028 ($ million)
      • Chart on Residential - Year-over-year growth 2023-2028 (%)
      • Data Table on Residential - Year-over-year growth 2023-2028 (%)
    • 7.5 Industrial - Market size and forecast 2023-2028
      • Chart on Industrial - Market size and forecast 2023-2028 ($ million)
      • Data Table on Industrial - Market size and forecast 2023-2028 ($ million)
      • Chart on Industrial - Year-over-year growth 2023-2028 (%)
      • Data Table on Industrial - Year-over-year growth 2023-2028 (%)
    • 7.6 Market opportunity by Application
      • Market opportunity by Application ($ million)
      • Data Table on Market opportunity by Application ($ million)

    8 Customer Landscape

    • 8.1 Customer landscape overview
      • Analysis of price sensitivity, lifecycle, customer purchase basket, adoption rates, and purchase criteria

    9 Geographic Landscape

    • 9.1 Geographic segmentation
      • Chart on Market share by geography 2023-2028 (%)
      • Data Table on Market share by geography 2023-2028 (%)
    • 9.2 Geographic comparison
      • Chart on Geographic comparison
      • Data Table on Geographic comparison
    • 9.3 North America - Market size and forecast 2023-2028
      • Chart on North America - Market size and forecast 2023-2028 ($ million)
      • Data Table on North America - Market size and forecast 2023-2028 ($ million)
      • Chart on North America - Year-over-year growth 2023-2028 (%)
      • Data Table on North America - Year-over-year growth 2023-2028 (%)
    • 9.4 Europe - Market size and forecast 2023-2028
      • Chart on Europe - Market size and forecast 2023-2028 ($ million)
      • Data Table on Europe - Market size and forecast 2023-2028 ($ million)
      • Chart on Europe - Year-over-year growth 2023-2028 (%)
      • Data Table on Europe - Year-over-year growth 2023-2028 (%)
    • 9.5 APAC - Market size and forecast 2023-2028
      • Chart on APAC - Market size and forecast 2023-2028 ($ million)
      • Data Table on APAC - Market size and forecast 2023-2028 ($ million)
      • Chart on APAC - Year-over-year growth 2023-2028 (%)
      • Data Table on APAC - Year-over-year growth 2023-2028 (%)
    • 9.6 Middle East and Africa - Market size and forecast 2023-2028
      • Chart on Middle East and Africa - Market size and forecast 2023-2028 ($ million)
      • Data Table on Middle East and Africa - Market size and forecast 2023-2028 ($ million)
      • Chart on Middle East and Africa - Year-over-year growth 2023-2028 (%)
      • Data Table on Middle East and Africa - Year-over-year growth 2023-2028 (%)
    • 9.7 South America - Market size and forecast 2023-2028
      • Chart on South America - Market size and forecast 2023-2028 ($ million)
      • Data Table on South America - Market size and forecast 2023-2028 ($ million)
      • Chart on South America - Year-over-year growth 2023-2028 (%)
      • Data Table on South America - Year-over-year growth 2023-2028 (%)
    • 9.8 US - Market size and forecast 2023-2028
      • Chart on US - Market size and forecast 2023-2028 ($ million)
      • Data Table on US - Market size and forecast 2023-2028 ($ million)
      • Chart on US - Year-over-year growth 2023-2028 (%)
      • Data Table on US - Year-over-year growth 2023-2028 (%)
    • 9.9 UK - Market size and forecast 2023-2028
      • Chart on UK - Market size and forecast 2023-2028 ($ million)
      • Data Table on UK - Market size and forecast 2023-2028 ($ million)
      • Chart on UK - Year-over-year growth 2023-2028 (%)
      • Data Table on UK - Year-over-year growth 2023-2028 (%)
    • 9.10 China - Market size and forecast 2023-2028
      • Chart on China - Market size and forecast 2023-2028 ($ million)
      • Data Table on China - Market size and forecast 2023-2028 ($ million)
      • Chart on China - Year-over-year growth 2023-2028 (%)
      • Data Table on China - Year-over-year growth 2023-2028 (%)
    • 9.11 Germany - Market size and forecast 2023-2028
      • Chart on Germany - Market size and forecast 2023-2028 ($ million)
      • Data Table on Germany - Market size and forecast 2023-2028 ($ million)
      • Chart on Germany - Year-over-year growth 2023-2028 (%)
      • Data Table on Germany - Year-over-year growth 2023-2028 (%)
    • 9.12 Japan - Market size and forecast 2023-2028
      • Chart on Japan - Market size and forecast 2023-2028 ($ million)
      • Data Table on Japan - Market size and forecast 2023-2028 ($ million)
      • Chart on Japan - Year-over-year growth 2023-2028 (%)
      • Data Table on Japan - Year-over-year growth 2023-2028 (%)
    • 9.13 Market opportunity by geography
      • Market opportunity by geography ($ million)
      • Data Tables on Market opportunity by geography ($ million)

    10 Drivers, Challenges, and Opportunity/Restraints

    • 10.1 Market drivers
      • 10.2 Market challenges
        • 10.3 Impact of drivers and challenges
          • Impact of drivers and challenges in 2023 and 2028
        • 10.4 Market opportunities/restraints

          11 Competitive Landscape

          • 11.1 Overview
            • 11.2 Competitive Landscape
              • Overview on criticality of inputs and factors of differentiation
            • 11.3 Landscape disruption
              • Overview on factors of disruption
            • 11.4 Industry risks
              • Impact of key risks on business

            12 Competitive Analysis

            • 12.1 Companies profiled
              • Companies covered
            • 12.2 Market positioning of companies
              • Matrix on companies position and classification
            • 12.3 Fujitec Co. Ltd.
              • Fujitec Co. Ltd. - Overview
              • Fujitec Co. Ltd. - Business segments
              • Fujitec Co. Ltd. - Key news
              • Fujitec Co. Ltd. - Key offerings
              • Fujitec Co. Ltd. - Segment focus
            • 12.4 Hitachi Ltd.
              • Hitachi Ltd. - Overview
              • Hitachi Ltd. - Business segments
              • Hitachi Ltd. - Key news
              • Hitachi Ltd. - Key offerings
              • Hitachi Ltd. - Segment focus
            • 12.5 Huawei Technologies Co. Ltd.
              • Huawei Technologies Co. Ltd. - Overview
              • Huawei Technologies Co. Ltd. - Product / Service
              • Huawei Technologies Co. Ltd. - Key news
              • Huawei Technologies Co. Ltd. - Key offerings
            • 12.6 Hyundai Elevator Co. Ltd.
              • Hyundai Elevator Co. Ltd. - Overview
              • Hyundai Elevator Co. Ltd. - Product / Service
              • Hyundai Elevator Co. Ltd. - Key news
              • Hyundai Elevator Co. Ltd. - Key offerings
            • 12.7 KONE Corp.
              • KONE Corp. - Overview
              • KONE Corp. - Product / Service
              • KONE Corp. - Key news
              • KONE Corp. - Key offerings
            • 12.8 Mitsubishi Electric Corp.
              • Mitsubishi Electric Corp. - Overview
              • Mitsubishi Electric Corp. - Business segments
              • Mitsubishi Electric Corp. - Key news
              • Mitsubishi Electric Corp. - Key offerings
              • Mitsubishi Electric Corp. - Segment focus
            • 12.9 Nidec Corp.
              • Nidec Corp. - Overview
              • Nidec Corp. - Business segments
              • Nidec Corp. - Key news
              • Nidec Corp. - Key offerings
              • Nidec Corp. - Segment focus
            • 12.10 Otis Worldwide Corp.
              • Otis Worldwide Corp. - Overview
              • Otis Worldwide Corp. - Business segments
              • Otis Worldwide Corp. - Key offerings
              • Otis Worldwide Corp. - Segment focus
            • 12.11 Robert Bosch GmbH
              • Robert Bosch GmbH - Overview
              • Robert Bosch GmbH - Product / Service
              • Robert Bosch GmbH - Key news
              • Robert Bosch GmbH - Key offerings
            • 12.12 Robustel
              • Robustel - Overview
              • Robustel - Product / Service
              • Robustel - Key offerings
            • 12.13 Schindler Holding Ltd.
              • Schindler Holding Ltd. - Overview
              • Schindler Holding Ltd. - Product / Service
              • Schindler Holding Ltd. - Key offerings
            • 12.14 thyssenkrupp AG
              • thyssenkrupp AG - Overview
              • thyssenkrupp AG - Business segments
              • thyssenkrupp AG - Key news
              • thyssenkrupp AG - Key offerings
              • thyssenkrupp AG - Segment focus
            • 12.15 TK Elevator GmbH
              • TK Elevator GmbH - Overview
              • TK Elevator GmbH - Product / Service
              • TK Elevator GmbH - Key offerings
            • 12.16 Toshiba Corp.
              • Toshiba Corp. - Overview
              • Toshiba Corp. - Business segments
              • Toshiba Corp. - Key news
              • Toshiba Corp. - Key offerings
              • Toshiba Corp. - Segment focus
            • 12.17 Vantage Elevation LLC
              • Vantage Elevation LLC - Overview
              • Vantage Elevation LLC - Product / Service
              • Vantage Elevation LLC - Key offerings

            13 Appendix

            • 13.1 Scope of the report
              • 13.2 Inclusions and exclusions checklist
                • Inclusions checklist
                • Exclusions checklist
              • 13.3 Currency conversion rates for US$
                • Currency conversion rates for US$
              • 13.4 Research methodology
                • Research methodology
              • 13.5 Data procurement
                • Information sources
              • 13.6 Data validation
                • Data validation
              • 13.7 Validation techniques employed for market sizing
                • Validation techniques employed for market sizing
              • 13.8 Data synthesis
                • Data synthesis
              • 360 degree market analysis
                • 360 degree market analysis
              • 13.10 List of abbreviations
                • List of abbreviations

              Research Methodology

              Technavio presents a detailed picture of the market by way of study, synthesis, and summation of data from multiple sources. The analysts have presented the various facets of the market with a particular focus on identifying the key industry influencers. The data thus presented is comprehensive, reliable, and the result of extensive research, both primary and secondary.

              INFORMATION SOURCES

              Primary sources

              • Manufacturers and suppliers
              • Channel partners
              • Industry experts
              • Strategic decision makers

              Secondary sources

              • Industry journals and periodicals
              • Government data
              • Financial reports of key industry players
              • Historical data
              • Press releases

              DATA ANALYSIS

              Data Synthesis

              • Collation of data
              • Estimation of key figures
              • Analysis of derived insights

              Data Validation

              • Triangulation with data models
              • Reference against proprietary databases
              • Corroboration with industry experts

              REPORT WRITING

              Qualitative

              • Market drivers
              • Market challenges
              • Market trends
              • Five forces analysis

              Quantitative

              • Market size and forecast
              • Market segmentation
              • Geographical insights
              • Competitive landscape

              Interested in this report?

              Get your sample now to see our research methodology and insights!

              Download Now

              Frequently Asked Questions

              Smart Elevator market growth will increase by $ 4923.2 mn during 2024-2028 .

              The Smart Elevator market is expected to grow at a CAGR of 6.78% during 2024-2028 .

              Smart Elevator market is segmented by Service( Modernization, New deployment, Maintenance) Application( Commercial, Residential, Industrial, MEA, South America)

              Express Lifts Ltd., Fujitec Co. Ltd., Halma Plc, Hitachi Ltd., Honeywell International Inc., Huawei Technologies Co. Ltd., Hyundai Elevator Co. Ltd., Johnson Lifts Pvt. Ltd., KONE Corp., Mitsubishi Electric Corp., Nidec Corp., Otis Worldwide Corp., Robert Bosch GmbH, Robustel, Schindler Holding Ltd., Sigma Elevator Co., thyssenkrupp AG, TK Elevator GmbH, Toshiba Corp., Vantage Elevation LLC are a few of the key vendors in the Smart Elevator market.

              North America will register the highest growth rate of 33% among the other regions. Therefore, the Smart Elevator market in North America is expected to garner significant business opportunities for the vendors during the forecast period.

              US, UK, China, Germany, Japan

              • Growing number of construction activitiesConstruction activities are increasing globally due to the increasing focus on infrastructure development. Developed economies is the driving factor this market.
              • such as US and Canada is the driving factor this market.
              • and countries in the European Union (EU) are focusing on improving their existing infrastructure. Moreover is the driving factor this market.
              • developing countries is the driving factor this market.
              • such as China and India is the driving factor this market.
              • are also experiencing growth in opportunities in the building construction industry.The total construction spending in the US was recorded to be around $1 is the driving factor this market.
              • 794.9 billion during October 2022 and around $1 is the driving factor this market.
              • 800.1 billion in September 2022. Construction spending has increased in the residential sector. The recovery in the US economy since the recession of 2008 has created optimism among homebuyers is the driving factor this market.
              • leading to increased demand for new single- and multi-family homes. Also is the driving factor this market.
              • the rising rate of urbanization in developing countries such as China and India is driving construction activities. Thus is the driving factor this market.
              • an increase in the number of construction activities will drive the demand for smart elevators during the forecast period. is the driving factor this market.

              The Smart Elevator market vendors should focus on grabbing business opportunities from the Modernization segment as it accounted for the largest market share in the base year.