Electrochromic Materials Market Analysis North America, Europe, APAC, South America, Middle East and Africa - US, Germany, France, China, Japan, UK, Canada, South Korea, Brazil, Argentina - Size and Forecast 2024-2028

Electrochromic Materials Market Analysis North America, Europe, APAC, South America, Middle East and Africa - US, Germany, France, China, Japan, UK, Canada, South Korea, Brazil, Argentina - Size and Forecast 2024-2028

Published: Nov 2024 159 Pages SKU: IRTNTR72199

Market Overview at a Glance

$8.20 B
Market Opportunity
31.9%
CAGR
22.2
YoY growth 2023-2024(%)

Electrochromic Materials Market Size 2024-2028 

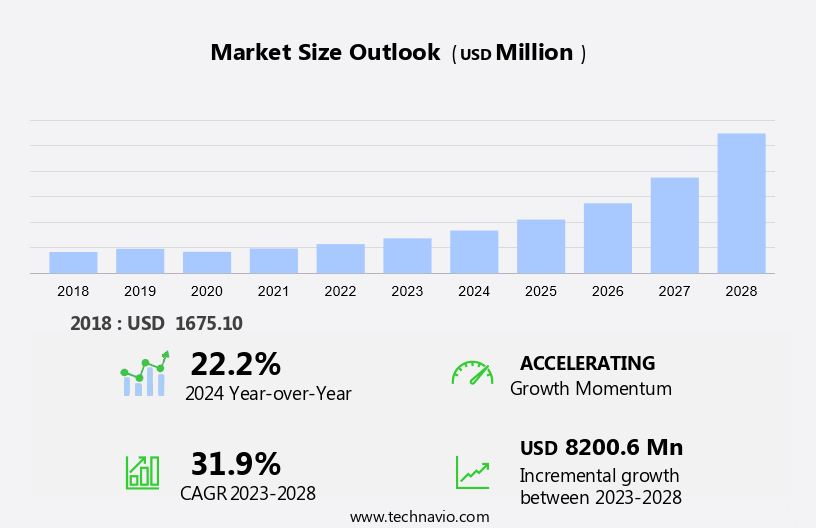
The electrochromic materials market size is forecast to increase by USD 8.2 billion at a CAGR of 31.9% between 2023 and 2028.

  • Electrochromic materials have gained significant traction in various industries due to their unique properties, including the ability to change color upon application of an electric voltage. Prussian Blue, a popular electrochromic material, is extensively used in smart windows and displays. In the automotive and transportation sector, these materials are increasingly being adopted for use in automotive production, offering advantages such as improved energy efficiency and enhanced driver comfort. The electrical and electronics industry also leverages various applications, including energy storage and display technologies. In the building and construction sector, these are used for dynamic facade applications, enabling energy savings and improved indoor environmental quality. The aerospace and defense industry is another significant end-user, utilizing these materials for cockpit windows and solar control applications. The increasing adoption of nanoparticles is a key trend, offering enhanced performance and cost savings. However, the high processing cost of conventional types remains a challenge, necessitating the development of cost-effective alternatives. Overall, the market is poised for growth, driven by the increasing demand for energy efficiency, improved comfort, and advanced functionality across various industries.

What will be the Size of the Market During the Forecast Period?

Electrochromic Materials Market Size

 Request Free Sample

  • Electrochromic materials have gained significant attention in various industries due to their unique ability to change color or transparency in response to an applied electric field. These materials offer numerous benefits, including energy efficiency, UV protection, and privacy, making them an attractive alternative to conventional materials. The market is driven by several factors. One of the primary factors is the increasing demand for energy-efficient solutions in various applications. The use in smart windows, for instance, can help regulate indoor temperatures and reduce energy consumption for heating and cooling. Another factor contributing to the growth of the market is the stringent regulations regarding CO2 emissions and the need for lightweight vehicles. The integration in automotive applications, such as sunroofs and rearview mirrors, can help reduce the overall weight of vehicles, thereby contributing to lower carbon emissions. Moreover, the aerospace industry is also adopting applications in windows and cockpit displays. The use of these materials can help improve the energy performance of commercial aircraft and provide pilots with better visibility, especially during low-light conditions.
  • The market also finds applications in consumer electronics, such as sunglasses and displays. These applications offer users the ability to adjust the level of light transmission, providing enhanced comfort and privacy. The market comprises various materials, including metal oxides, viologens, conducting polymers, and Prussian blue. These materials offer different properties, such as fast response times, high color stability, and broad light absorption ranges, making them suitable for various applications. Thin-film devices, such as electrochromic glass, are a key technology driving the growth of the market. These devices offer high optical contrast, low power consumption, and long lifespan, making them an attractive alternative to conventional materials. In conclusion, the market is poised for growth due to the increasing demand for energy efficiency, lightweight materials, and smart applications across various industries. The use of these materials in architectural glazing, automotive applications, aerospace, consumer electronics, and smart glass windows offers numerous benefits and presents significant opportunities for innovation and growth.

How is this market segmented and which is the largest segment?

The market research report provides comprehensive data (region-wise segment analysis), with forecasts and estimates in "USD million" for the period 2024-2028, as well as historical data from 2018-2022 for the following segments.
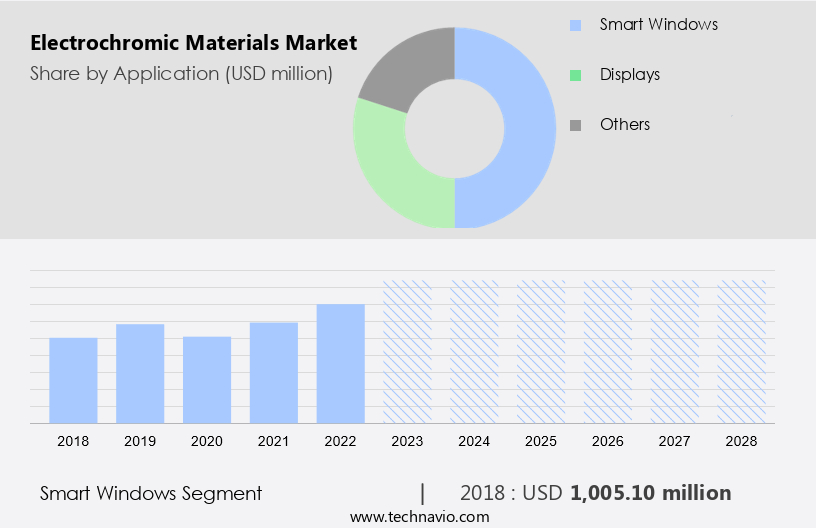
  • Application
    • Smart windows
    • Displays
    • Others
  • Geography
    • North America
      • Canada
      • US
    • Europe
      • Germany
      • UK
      • France
    • APAC
      • China
      • Japan
      • South Korea
    • South America
      • Brazil
      • Argentina
    • Middle East and Africa

By Application Insights

  • The smart windows segment is estimated to witness significant growth during the forecast period.

Electrochromic materials are a type of advanced technology used to create smart windows, also known as switchable glass. These windows offer the ability to regulate light and heat transmission by applying an electric current. Prussian Blue, a common electrochromic material, plays a significant role in this technology. The application of electrochromic materials allows for the glass to transition from translucent to transparent, providing control over the amount of light and heat that enters a building or vehicle. Smart glass windows are becoming increasingly popular in various industries, including Automotive and Transportation, Electrical and Electronics, Building and Construction, Aerospace and Defense, and Construction.

In the Automotive industry, electrochromic windows offer privacy, glare reduction, and energy efficiency. In the building and construction sector, they provide temperature control and natural light regulation, leading to energy savings and improved occupant comfort. Electrochromic materials are also used in displays, offering the potential for dynamic, adjustable screens. Their versatility and efficiency make them a valuable addition to various industries, providing innovative solutions for managing light and heat transmission while maintaining a sleek, modern design. In summary, electrochromic materials, specifically Prussian Blue, are revolutionizing the way we manage light and heat transmission in various industries. From smart windows in buildings and vehicles to dynamic displays, their versatility and efficiency make them an essential technology for the future.

Electrochromic Materials Market Size

Get a glance at the market report of share of various segments Request Free Sample

The smart windows segment was valued at USD 1.01 billion in 2018 and showed a gradual increase during the forecast period.

Regional Analysis

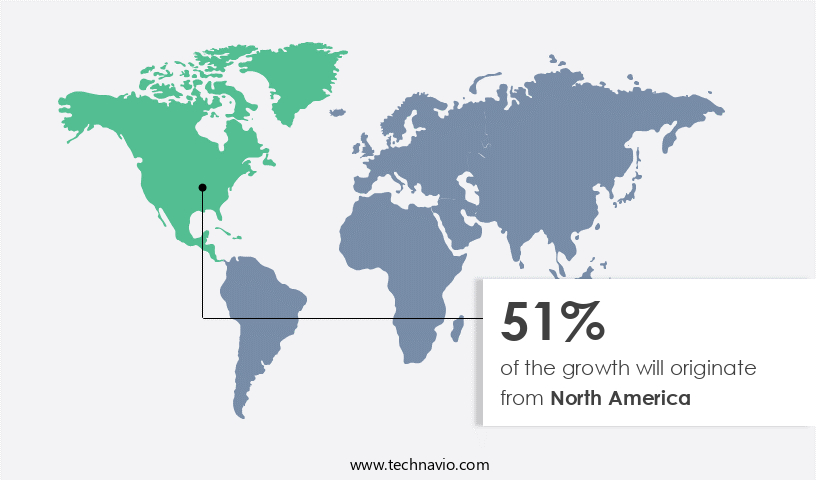
  • North America is estimated to contribute 51% to the growth of the global market during the forecast period.

Technavio's analysts have elaborately explained the regional trends and drivers that shape the market during the forecast period.

Electrochromic Materials Market Share by Geography

For more insights on the market share of various regions Request Free Sample

The market is expected to witness significant growth in North America due to the region's strong economy, particularly in the US. According to the World Bank, the US had the largest GDP in North America in 2023. The country's manufacturing sector is a major contributor to its economy, making it an attractive market for electrochromic materials. Electrochromic materials undergo a reversible color change when an electrical charge is applied. These materials find extensive applications in various industries, including aerospace and automotive. In the automotive sector, electrochromic materials are used in smart windows, sunroofs, and rearview mirrors to control light transmission, enhancing comfort and energy efficiency.

In the aerospace industry, they are used in thin-film devices to regulate ultraviolet and infrared light, providing temperature control and enhancing passenger comfort. Smart windows, a significant application of electrochromic materials, are gaining popularity in the US due to their ability to control light transmission, reducing the need for air conditioning and heating, and improving energy efficiency. The automotive industry in the US is also adopting electrochromic materials in sunroofs and rearview mirrors to provide drivers with better visibility and comfort.

Market Dynamics

Our researchers analyzed the data with 2023 as the base year, along with the key drivers, trends, and challenges. A holistic analysis of drivers will help companies refine their marketing strategies to gain a competitive advantage.

What are the key market drivers leading to the rise in adoption of Electrochromic Materials Market?

Increased usage of electrochromic materials in the automobile industry is the key driver of the market.

  • Electrochromic materials have gained significant attention in various industries due to their ability to change color in response to an electric current. These materials are finding extensive applications in sectors such as aerospace, consumer electronics, and automotive. In the consumer electronics industry, electrochromic materials are used in color display technology for various devices. In the aerospace sector, they are used to create smart glass windows that offer control over light and temperature, enhancing passenger comfort. Moreover, the automotive industry is witnessing a growing trend towards the adoption of electrochromic glass and films. These materials are increasingly being used in sunroofs, doors, windows, and rearview mirrors to regulate light and heat emission. By controlling the amount of light and heat entering the vehicle, these smart glass solutions help reduce the need for air-conditioning and heating systems, leading to cost savings and improved energy efficiency.
  • The automotive industry's focus on sustainability and eco-friendliness is also driving the demand for electrochromic materials. With the increasing popularity of electric vehicles, the market for these materials is expected to grow significantly in the coming years. In the US, Europe, and China, governments are implementing initiatives to promote the adoption of electric vehicles, creating a favorable environment for the growth of the market. In conclusion, electrochromic materials offer numerous benefits in terms of energy efficiency, comfort, and sustainability, making them a valuable addition to various industries. Thus, such factors are driving the growth of the market during the forecast period.

What are the market trends shaping the Electrochromic Materials Market?

Increasing adoption of nanoparticles in electrochromic materials is the upcoming trend in the market.

  • Electrochromic materials, specifically those at the nanoscale, offer enhanced efficiency, chromatic contrast, and quick switching times. The nanoscale dimension provides a broad color tuning range for these materials. However, the heterogeneity of nanoparticles, including their size, shape, and surface imperfections, can impact their electrochromic characteristics. To address these challenges, manufacturers are integrating electrochromic materials with nano properties.
  • For instance, zinc oxide (ZnO), nanowire arrays modified by violanthrone and tungstic anhydride (WO3), crystalline WO3 nanoparticles and nanotubes, mesoporous WO3, titanium dioxide (TiO2), and poly(3,4-ethylenedioxythiophene) nanotubes are among the materials being used. These nanomaterials improve the aesthetics and functionality of electrochromic smart windows. Additionally, they contribute to energy performance and UV-light radiation reduction, making them suitable for lightweight vehicles and buildings under CO2 regulations. Thus, such trends will shape the growth of the market during the forecast period.

What challenges does Electrochromic Materials Market face during its growth?

The drawback in conventional materials and their high processing cost is a key challenge affecting the market growth.

  • Electrochromic materials, specifically smart glass and electrochromic glass, have yet to reach their full potential in the market due to the high cost and limitations in durability and functionality of traditional materials. These materials are typically made from thin sheets of transition metal oxides, which are expensive to produce using techniques such as sputtering and evaporation.
  • The films, which are the active component in commercial electrochromic windows, can degrade over time due to repeated ion intercalation and assume distinct, dark hues when tinted. They also block both visible and near-infrared light. These shortcomings prevent electrochromic windows from meeting the requirements of an ideal smart window and have hindered their widespread adoption. This is anticipated to negatively impact the growth of the market during the forecast period.

Exclusive Customer Landscape

The market forecasting report includes the adoption lifecycle of the market, covering from the innovator's stage to the laggard's stage. It focuses on adoption rates in different regions based on penetration. Furthermore, the market report also includes key purchase criteria and drivers of price sensitivity to help companies evaluate and develop their market growth analysis strategies.
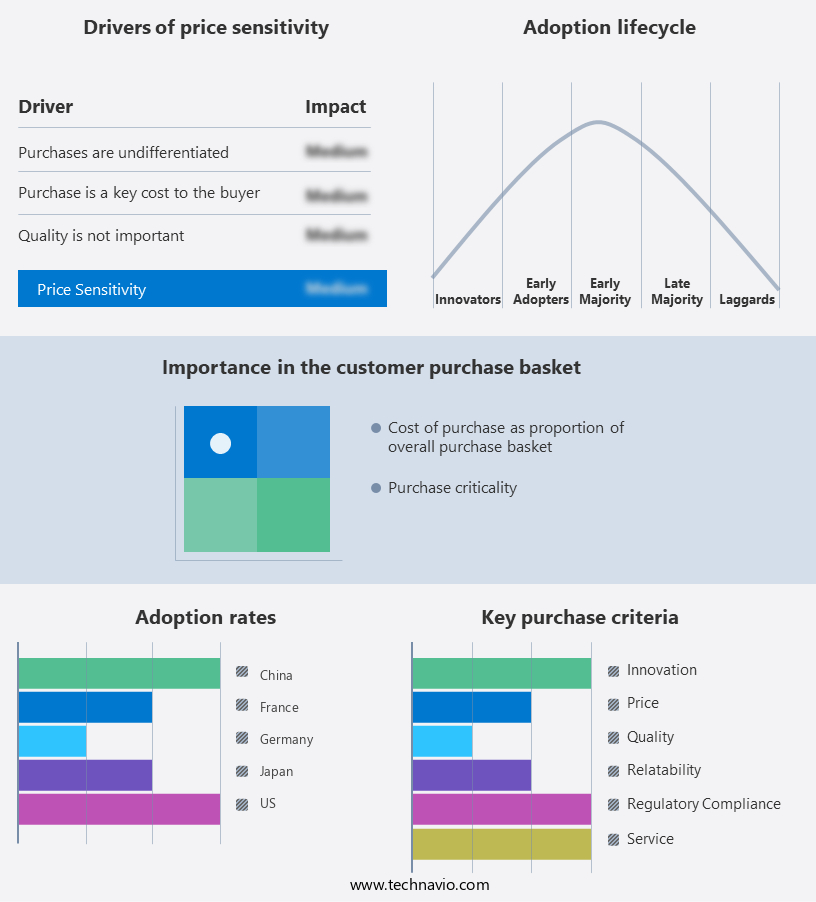
Electrochromic Materials Market Share by Geography

 Customer Landscape

Key Companies & Market Insights

Companies are implementing various strategies, such as strategic alliances, market forecast, partnerships, mergers and acquisitions, geographical expansion, and product/service launches, to enhance their presence in the market.

The market research and growth report includes detailed analyses of the competitive landscape of the market and information about key companies, including:

  • Ashwin Ushas Corp.
  • Changzhou Spectrum New Material Co. Ltd.
  • ChromoGenics AB
  • Compagnie de Saint-Gobain SA
  • e Chromic Technologies Inc.
  • Gentex Corp.
  • Giner Inc.
  • Heliotrope Technologies
  • iGlass Technology Inc.
  • PPG Industries Inc.
  • Ricoh Co. Ltd.
  • SAGE Electrochromics
  • View Inc
  • Ynvisible Interactive Inc
  • Zhuhai Kaivo Optoelectronic Technology Co. Ltd.

Qualitative and quantitative analysis of companies has been conducted to help clients understand the wider business environment as well as the strengths and weaknesses of key market players. Data is qualitatively analyzed to categorize companies as pure play, category-focused, industry-focused, and diversified; it is quantitatively analyzed to categorize companies as dominant, leading, strong, tentative, and weak.

Research Analyst Overview

Electrochromic materials have gained significant attention in various industries due to their ability to change color in response to an electric current. These materials are primarily used in the production of smart glass windows, displays, and photonic devices. The market for electrochromic materials is driven by the increasing demand for energy efficiency and lightweight vehicles in the automotive and transportation sector. Additionally, the construction industry is also adopting electrochromic materials for architectural glazing to reduce energy consumption and improve building insulation. Metal oxides, viologens, conducting polymers, and Prussian blue are commonly used electrochromic materials. Transition metal oxides, nanoparticles, and nanoscale materials are also being explored for their potential in electrochromism.

Furthermore, the use of electrochromic materials in smart glass windows offers benefits such as ultraviolet and infrared light protection, energy efficiency, and color tuning. The electrical and electronics industry uses electrochromic materials in displays, while the automotive industry incorporates them in automotive mirrors, sunroofs, and rearview mirrors. The aerospace industry utilizes electrochromic materials in commercial aircraft for energy efficiency and to reduce weight. The defense sector also invests in electrochromic materials for advanced military applications. Electrochromic materials are increasingly being used in electric vehicles to improve energy efficiency and reduce the need for air-conditioning units. Consumer electronics, such as sunglasses, also use electrochromic materials for color display technology. The market for electrochromic materials is expected to grow significantly due to the increasing focus on reducing CO2 emissions and improving energy performance.

Market Scope

Report Coverage

Details

Page number

159

Base year

2023

Historic period

2018-2022

Forecast period

2024-2028

Growth momentum & CAGR

Accelerate at a CAGR of 31.9%

Market Growth 2024-2028

USD 8.21 billion

Market structure

Fragmented

YoY growth 2023-2024(%)

22.2

Key countries

US, Germany, France, China, Japan, UK, Canada, South Korea, Brazil, and Argentina

Competitive landscape

Leading Companies, Market Positioning of Companies, Competitive Strategies, and Industry Risks

Request Free Sample

What are the Key Data Covered in this Market Research and Growth Report?

  • CAGR of the market during the forecast period
  • Detailed information on factors that will drive the market growth and forecasting between 2024 and 2028
  • Precise estimation of the size of the market  and its contribution of the market in focus to the parent market
  • Accurate predictions about upcoming market growth and trends and changes in consumer behaviour
  • Growth of the market across North America, Europe, APAC, South America, and Middle East and Africa
  • Thorough analysis of the market's competitive landscape and detailed information about companies
  • Comprehensive analysis of factors that will challenge the growth of market companies

We can help! Our analysts can customize this market research report to meet your requirements. Get in touch

1 Executive Summary

  • 1.1 Market overview
    • Executive Summary - Chart on Market Overview
    • Executive Summary - Data Table on Market Overview
    • Executive Summary - Chart on Global Market Characteristics
    • Executive Summary - Chart on Market by Geography
    • Executive Summary - Chart on Market Segmentation by Application
    • Executive Summary - Chart on Incremental Growth
    • Executive Summary - Data Table on Incremental Growth
    • Executive Summary - Chart on Company Market Positioning

2 Technavio Analysis

  • 2.1 Analysis of price sensitivity, lifecycle, customer purchase basket, adoption rates, and purchase criteria
    • Analysis of price sensitivity, lifecycle, customer purchase basket, adoption rates, and purchase criteria
  • 2.2 Criticality of inputs and Factors of differentiation
    • Overview on criticality of inputs and factors of differentiation
  • 2.3 Factors of disruption
    • Overview on factors of disruption
  • 2.4 Impact of drivers and challenges
    • Impact of drivers and challenges in 2023 and 2028

3 Market Landscape

  • 3.1 Market ecosystem
    • Parent Market
    • Data Table on - Parent Market
  • 3.2 Market characteristics
    • Market characteristics analysis
  • 3.3 Value chain analysis
    • Value Chain Analysis

4 Market Sizing

  • 4.1 Market definition
    • Offerings of companies included in the market definition
  • 4.2 Market segment analysis
    • Market segments
  • 4.3 Market size 2023
    • 4.4 Market outlook: Forecast for 2023-2028
      • Chart on Global - Market size and forecast 2023-2028 ($ million)
      • Data Table on Global - Market size and forecast 2023-2028 ($ million)
      • Chart on Global Market: Year-over-year growth 2023-2028 (%)
      • Data Table on Global Market: Year-over-year growth 2023-2028 (%)

    5 Historic Market Size

    • 5.1 Global Electrochromic Materials Market 2018 - 2022
      • Historic Market Size - Data Table on Global Electrochromic Materials Market 2018 - 2022 ($ million)
    • 5.2 Application segment analysis 2018 - 2022
      • Historic Market Size - Application Segment 2018 - 2022 ($ million)
    • 5.3 Geography segment analysis 2018 - 2022
      • Historic Market Size - Geography Segment 2018 - 2022 ($ million)
    • 5.4 Country segment analysis 2018 - 2022
      • Historic Market Size - Country Segment 2018 - 2022 ($ million)

    6 Five Forces Analysis

    • 6.1 Five forces summary
      • Five forces analysis - Comparison between 2023 and 2028
    • 6.2 Bargaining power of buyers
      • Bargaining power of buyers - Impact of key factors 2023 and 2028
    • 6.3 Bargaining power of suppliers
      • Bargaining power of suppliers - Impact of key factors in 2023 and 2028
    • 6.4 Threat of new entrants
      • Threat of new entrants - Impact of key factors in 2023 and 2028
    • 6.5 Threat of substitutes
      • Threat of substitutes - Impact of key factors in 2023 and 2028
    • 6.6 Threat of rivalry
      • Threat of rivalry - Impact of key factors in 2023 and 2028
    • 6.7 Market condition
      • Chart on Market condition - Five forces 2023 and 2028

    7 Market Segmentation by Application

    • 7.1 Market segments
      • Chart on Application - Market share 2023-2028 (%)
      • Data Table on Application - Market share 2023-2028 (%)
    • 7.2 Comparison by Application
      • Chart on Comparison by Application
      • Data Table on Comparison by Application
    • 7.3 Smart windows - Market size and forecast 2023-2028
      • Chart on Smart windows - Market size and forecast 2023-2028 ($ million)
      • Data Table on Smart windows - Market size and forecast 2023-2028 ($ million)
      • Chart on Smart windows - Year-over-year growth 2023-2028 (%)
      • Data Table on Smart windows - Year-over-year growth 2023-2028 (%)
    • 7.4 Displays - Market size and forecast 2023-2028
      • Chart on Displays - Market size and forecast 2023-2028 ($ million)
      • Data Table on Displays - Market size and forecast 2023-2028 ($ million)
      • Chart on Displays - Year-over-year growth 2023-2028 (%)
      • Data Table on Displays - Year-over-year growth 2023-2028 (%)
    • 7.5 Others - Market size and forecast 2023-2028
      • Chart on Others - Market size and forecast 2023-2028 ($ million)
      • Data Table on Others - Market size and forecast 2023-2028 ($ million)
      • Chart on Others - Year-over-year growth 2023-2028 (%)
      • Data Table on Others - Year-over-year growth 2023-2028 (%)
    • 7.6 Market opportunity by Application
      • Market opportunity by Application ($ million)
      • Data Table on Market opportunity by Application ($ million)

    8 Customer Landscape

    • 8.1 Customer landscape overview
      • Analysis of price sensitivity, lifecycle, customer purchase basket, adoption rates, and purchase criteria

    9 Geographic Landscape

    • 9.1 Geographic segmentation
      • Chart on Market share by geography 2023-2028 (%)
      • Data Table on Market share by geography 2023-2028 (%)
    • 9.2 Geographic comparison
      • Chart on Geographic comparison
      • Data Table on Geographic comparison
    • 9.3 North America - Market size and forecast 2023-2028
      • Chart on North America - Market size and forecast 2023-2028 ($ million)
      • Data Table on North America - Market size and forecast 2023-2028 ($ million)
      • Chart on North America - Year-over-year growth 2023-2028 (%)
      • Data Table on North America - Year-over-year growth 2023-2028 (%)
    • 9.4 Europe - Market size and forecast 2023-2028
      • Chart on Europe - Market size and forecast 2023-2028 ($ million)
      • Data Table on Europe - Market size and forecast 2023-2028 ($ million)
      • Chart on Europe - Year-over-year growth 2023-2028 (%)
      • Data Table on Europe - Year-over-year growth 2023-2028 (%)
    • 9.5 APAC - Market size and forecast 2023-2028
      • Chart on APAC - Market size and forecast 2023-2028 ($ million)
      • Data Table on APAC - Market size and forecast 2023-2028 ($ million)
      • Chart on APAC - Year-over-year growth 2023-2028 (%)
      • Data Table on APAC - Year-over-year growth 2023-2028 (%)
    • 9.6 South America - Market size and forecast 2023-2028
      • Chart on South America - Market size and forecast 2023-2028 ($ million)
      • Data Table on South America - Market size and forecast 2023-2028 ($ million)
      • Chart on South America - Year-over-year growth 2023-2028 (%)
      • Data Table on South America - Year-over-year growth 2023-2028 (%)
    • 9.7 Middle East and Africa - Market size and forecast 2023-2028
      • Chart on Middle East and Africa - Market size and forecast 2023-2028 ($ million)
      • Data Table on Middle East and Africa - Market size and forecast 2023-2028 ($ million)
      • Chart on Middle East and Africa - Year-over-year growth 2023-2028 (%)
      • Data Table on Middle East and Africa - Year-over-year growth 2023-2028 (%)
    • 9.8 US - Market size and forecast 2023-2028
      • Chart on US - Market size and forecast 2023-2028 ($ million)
      • Data Table on US - Market size and forecast 2023-2028 ($ million)
      • Chart on US - Year-over-year growth 2023-2028 (%)
      • Data Table on US - Year-over-year growth 2023-2028 (%)
    • 9.9 Germany - Market size and forecast 2023-2028
      • Chart on Germany - Market size and forecast 2023-2028 ($ million)
      • Data Table on Germany - Market size and forecast 2023-2028 ($ million)
      • Chart on Germany - Year-over-year growth 2023-2028 (%)
      • Data Table on Germany - Year-over-year growth 2023-2028 (%)
    • 9.10 France - Market size and forecast 2023-2028
      • Chart on France - Market size and forecast 2023-2028 ($ million)
      • Data Table on France - Market size and forecast 2023-2028 ($ million)
      • Chart on France - Year-over-year growth 2023-2028 (%)
      • Data Table on France - Year-over-year growth 2023-2028 (%)
    • 9.11 China - Market size and forecast 2023-2028
      • Chart on China - Market size and forecast 2023-2028 ($ million)
      • Data Table on China - Market size and forecast 2023-2028 ($ million)
      • Chart on China - Year-over-year growth 2023-2028 (%)
      • Data Table on China - Year-over-year growth 2023-2028 (%)
    • 9.12 Japan - Market size and forecast 2023-2028
      • Chart on Japan - Market size and forecast 2023-2028 ($ million)
      • Data Table on Japan - Market size and forecast 2023-2028 ($ million)
      • Chart on Japan - Year-over-year growth 2023-2028 (%)
      • Data Table on Japan - Year-over-year growth 2023-2028 (%)
    • 9.13 UK - Market size and forecast 2023-2028
      • Chart on UK - Market size and forecast 2023-2028 ($ million)
      • Data Table on UK - Market size and forecast 2023-2028 ($ million)
      • Chart on UK - Year-over-year growth 2023-2028 (%)
      • Data Table on UK - Year-over-year growth 2023-2028 (%)
    • 9.14 South Korea - Market size and forecast 2023-2028
      • Chart on South Korea - Market size and forecast 2023-2028 ($ million)
      • Data Table on South Korea - Market size and forecast 2023-2028 ($ million)
      • Chart on South Korea - Year-over-year growth 2023-2028 (%)
      • Data Table on South Korea - Year-over-year growth 2023-2028 (%)
    • 9.15 Canada - Market size and forecast 2023-2028
      • Chart on Canada - Market size and forecast 2023-2028 ($ million)
      • Data Table on Canada - Market size and forecast 2023-2028 ($ million)
      • Chart on Canada - Year-over-year growth 2023-2028 (%)
      • Data Table on Canada - Year-over-year growth 2023-2028 (%)
    • 9.16 Brazil - Market size and forecast 2023-2028
      • Chart on Brazil - Market size and forecast 2023-2028 ($ million)
      • Data Table on Brazil - Market size and forecast 2023-2028 ($ million)
      • Chart on Brazil - Year-over-year growth 2023-2028 (%)
      • Data Table on Brazil - Year-over-year growth 2023-2028 (%)
    • 9.17 Argentina - Market size and forecast 2023-2028
      • Chart on Argentina - Market size and forecast 2023-2028 ($ million)
      • Data Table on Argentina - Market size and forecast 2023-2028 ($ million)
      • Chart on Argentina - Year-over-year growth 2023-2028 (%)
      • Data Table on Argentina - Year-over-year growth 2023-2028 (%)
    • 9.18 Market opportunity by geography
      • Market opportunity by geography ($ million)
      • Data Tables on Market opportunity by geography ($ million)

    10 Drivers, Challenges, and Opportunity/Restraints

    • 10.1 Market drivers
      • 10.2 Market challenges
        • 10.3 Impact of drivers and challenges
          • Impact of drivers and challenges in 2023 and 2028
        • 10.4 Market opportunities/restraints

          11 Competitive Landscape

          • 11.1 Overview
            • 11.2 Competitive Landscape
              • Overview on criticality of inputs and factors of differentiation
            • 11.3 Landscape disruption
              • Overview on factors of disruption
            • 11.4 Industry risks
              • Impact of key risks on business

            12 Competitive Analysis

            • 12.1 Companies profiled
              • Companies covered
            • 12.2 Company ranking index
              • Company ranking index
            • 12.3 Market positioning of companies
              • Matrix on companies position and classification
            • 12.4 Ashwin Ushas Corp.
              • Ashwin Ushas Corp. - Overview
              • Ashwin Ushas Corp. - Product / Service
              • Ashwin Ushas Corp. - Key offerings
              • SWOT
            • 12.5 Changzhou Spectrum New Material Co. Ltd.
              • Changzhou Spectrum New Material Co. Ltd. - Overview
              • Changzhou Spectrum New Material Co. Ltd. - Product / Service
              • Changzhou Spectrum New Material Co. Ltd. - Key offerings
              • SWOT
            • 12.6 ChromoGenics AB
              • ChromoGenics AB - Overview
              • ChromoGenics AB - Product / Service
              • ChromoGenics AB - Key offerings
              • SWOT
            • 12.7 Compagnie de Saint-Gobain SA
              • Compagnie de Saint-Gobain SA - Overview
              • Compagnie de Saint-Gobain SA - Business segments
              • Compagnie de Saint-Gobain SA - Key news
              • Compagnie de Saint-Gobain SA - Key offerings
              • Compagnie de Saint-Gobain SA - Segment focus
              • SWOT
            • 12.8 Gentex Corp.
              • Gentex Corp. - Overview
              • Gentex Corp. - Business segments
              • Gentex Corp. - Key news
              • Gentex Corp. - Key offerings
              • Gentex Corp. - Segment focus
              • SWOT
            • 12.9 Giner Inc.
              • Giner Inc. - Overview
              • Giner Inc. - Product / Service
              • Giner Inc. - Key offerings
              • SWOT
            • 12.10 iGlass Technology Inc.
              • iGlass Technology Inc. - Overview
              • iGlass Technology Inc. - Product / Service
              • iGlass Technology Inc. - Key offerings
              • SWOT
            • 12.11 Ricoh Co. Ltd.
              • Ricoh Co. Ltd. - Overview
              • Ricoh Co. Ltd. - Business segments
              • Ricoh Co. Ltd. - Key news
              • Ricoh Co. Ltd. - Key offerings
              • Ricoh Co. Ltd. - Segment focus
              • SWOT
            • 12.12 View Inc
              • View Inc - Overview
              • View Inc - Product / Service
              • View Inc - Key offerings
              • SWOT
            • 12.13 Ynvisible Interactive Inc
              • Ynvisible Interactive Inc - Overview
              • Ynvisible Interactive Inc - Product / Service
              • Ynvisible Interactive Inc - Key offerings
              • SWOT

            13 Appendix

            • 13.1 Scope of the report
              • 13.2 Inclusions and exclusions checklist
                • Inclusions checklist
                • Exclusions checklist
              • 13.3 Currency conversion rates for US$
                • Currency conversion rates for US$
              • 13.4 Research methodology
                • Research methodology
              • 13.5 Data procurement
                • Information sources
              • 13.6 Data validation
                • Data validation
              • 13.7 Validation techniques employed for market sizing
                • Validation techniques employed for market sizing
              • 13.8 Data synthesis
                • Data synthesis
              • 13.9 360 degree market analysis
                • 360 degree market analysis
              • 13.10 List of abbreviations
                • List of abbreviations

              Research Methodology

              Technavio presents a detailed picture of the market by way of study, synthesis, and summation of data from multiple sources. The analysts have presented the various facets of the market with a particular focus on identifying the key industry influencers. The data thus presented is comprehensive, reliable, and the result of extensive research, both primary and secondary.

              INFORMATION SOURCES

              Primary sources

              • Manufacturers and suppliers
              • Channel partners
              • Industry experts
              • Strategic decision makers

              Secondary sources

              • Industry journals and periodicals
              • Government data
              • Financial reports of key industry players
              • Historical data
              • Press releases

              DATA ANALYSIS

              Data Synthesis

              • Collation of data
              • Estimation of key figures
              • Analysis of derived insights

              Data Validation

              • Triangulation with data models
              • Reference against proprietary databases
              • Corroboration with industry experts

              REPORT WRITING

              Qualitative

              • Market drivers
              • Market challenges
              • Market trends
              • Five forces analysis

              Quantitative

              • Market size and forecast
              • Market segmentation
              • Geographical insights
              • Competitive landscape

              Interested in this report?

              Get your sample now to see our research methodology and insights!

              Download Now

              Frequently Asked Questions

              Electrochromic Materials market growth will increase by $ 8200.6 mn during 2024-2028.

              The Electrochromic Materials market is expected to grow at a CAGR of 31.9% during 2024-2028.

              Electrochromic Materials market is segmented by Application( Smart windows, Displays, Others)

              Ashwin Ushas Corp., Changzhou Spectrum New Material Co. Ltd., ChromoGenics AB, Compagnie de Saint-Gobain SA, e Chromic Technologies Inc., Gentex Corp., Giner Inc., Heliotrope Technologies, iGlass Technology Inc., PPG Industries Inc., Ricoh Co. Ltd., SAGE Electrochromics, View Inc, Ynvisible Interactive Inc, Zhuhai Kaivo Optoelectronic Technology Co. Ltd. are a few of the key vendors in the Electrochromic Materials market.

              North America will register the highest growth rate of 51% among the other regions. Therefore, the Electrochromic Materials market in North America is expected to garner significant business opportunities for the vendors during the forecast period.

              US, Germany, France, China, Japan, UK, Canada, South Korea, Brazil, Argentina

              • Increased usage of electrochromic materials in automobile industryThe automotive industry is a big market with great development potential in terms of the demand for electrochromic glass and films. Smart glass can be found in doors is the driving factor this market.
              • windows is the driving factor this market.
              • sunroofs is the driving factor this market.
              • and rearview mirrors. Smart glass is often used for sunroofs is the driving factor this market.
              • which give improved control over light and heat emission while decreasing air-conditioning unit use by controlling the cars cabin temperature. This lowers the vehicles cooling and lighting expenses.Furthermore is the driving factor this market.
              • the development of electric cars may gain traction in the next years is the driving factor this market.
              • particularly in Europe is the driving factor this market.
              • China is the driving factor this market.
              • and the US is the driving factor this market.
              • where several government initiatives are supporting a shift away from fossil fuels due to different environmental concerns. Such factors are expected to drive the global electrochromic materials market during the forecast period. is the driving factor this market.

              The Electrochromic Materials market vendors should focus on grabbing business opportunities from the Smart windows segment as it accounted for the largest market share in the base year.