Smart Indoor Garden Systems Market Size 2025-2029
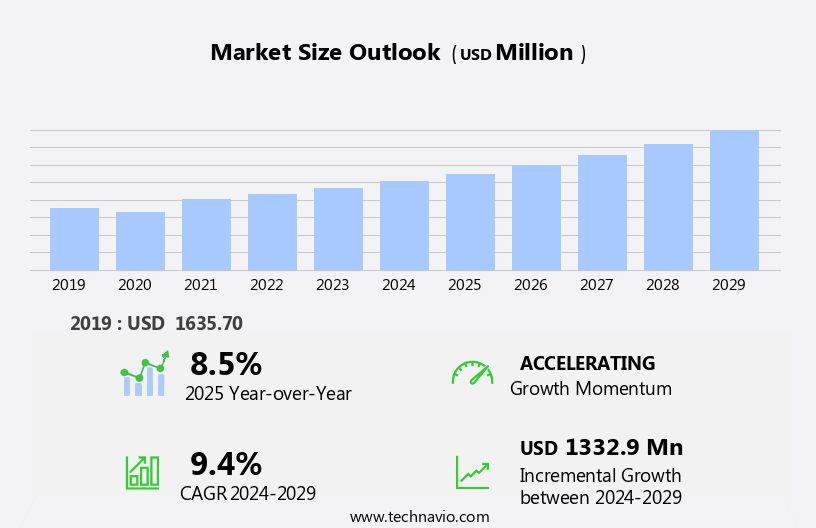
The smart indoor garden systems market size is forecast to increase by USD 1.33 billion at a CAGR of 9.4% between 2024 and 2029.
- The market is witnessing significant growth due to several key trends. One of the primary drivers is the increasing demand for wireless connectivity and IoT-enabled technologies in home gardening. This includes the use of artificial intelligence and machine learning for optimizing lighting, nutrition, and insecticides for indoor plants. Vertical gardens, a popular trend in indoor farming and construction, are also fueling market growth. Technologies like LED and aeroponics are gaining traction in smart indoor garden systems, offering benefits such as energy efficiency and water conservation. The integration of smart home technology is another trend, enabling users to remotely monitor and control their indoor gardens. Overall, the market for smart indoor garden systems is expected to continue its growth trajectory, offering numerous opportunities for stakeholders.
What will be the Size of the Smart Indoor Garden Systems Market During the Forecast Period?

Request Free Sample
- The smart indoor gardens market encompasses innovative systems that integrate digital technologies, such as the Internet of Things (IoT) and artificial intelligence (AI), into vertical farming, urban farming, hydroponics, and controlled environment agriculture. These advanced solutions optimize plant growth by automating processes like fertilization, watering, lighting, temperature control, and insect management. Sensors and automated devices monitor and adjust these factors in real-time, ensuring optimal growing conditions. Self-sufficient systems, including self-watering mechanisms and intelligent nutrition systems, are gaining popularity in urban areas, particularly in apartments and cities, where arable land is limited. Smart greenhouses, with their sleek interior design and eco-friendly credentials, are increasingly adopted for growing fresh fruits, herbs, and vegetables without the need for insecticides or excessive water usage. These digital advancements in agriculture contribute to the overall growth and sustainability of the market.
How is this Smart Indoor Garden Systems Industry segmented and which is the largest segment?
The smart indoor garden systems industry research report provides comprehensive data (region-wise segment analysis), with forecasts and estimates in "USD million" for the period 2025-2029, as well as historical data from 2019-2023 for the following segments.
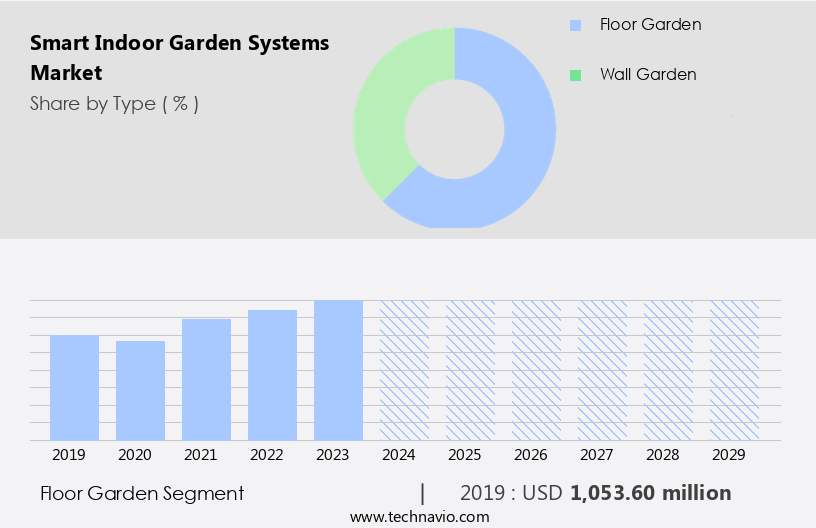
- Type
- Product
- LED grow lights
- Automated watering systems
- Nutrient delivery systems
- Environmental monitoring
- Product Type
- Hydroponics
- Soil-based
- Aquaponics
- Aeroponics
- End-user
- Distribution Channel
- Geography
- North America
- Europe
- APAC
- Middle East and Africa
- South America
By Type Insights
- The floor garden segment is estimated to witness significant growth during the forecast period. The floor garden segment in the market is projected to experience notable revenue growth compared to the wall segment, driven by the rising emphasis on mental and emotional health in urban areas. Floor gardens, which are commonly found in apartments and cities, enable the cultivation of herbs, fruits, and flowers using advanced technologies. These systems incorporate self-watering mechanisms, pest management, and intelligent soil to optimize water, oxygen, and nutrient intake for plants. Despite the need for occasional maintenance, such as fertilizer application and pest control, floor gardening offers several benefits, including better yields and improved interior design. Digital technologies, including sensors, LED grow lights, machine learning algorithms, cameras, and vision systems, are integral to these systems. Additionally, the integration of IoT, artificial intelligence, and digital monitoring systems enhances the overall efficiency and productivity of smart indoor garden systems.

Get a glance at the market report of share of various segments Request Free Sample
The Floor garden segment was valued at USD 1.05 billion in 2019 and showed a gradual increase during the forecast period.
Regional Analysis
- North America is estimated to contribute 39% to the growth of the global market during the forecast period.
Technavio's analysts have elaborately explained the regional trends and drivers that shape the market during the forecast period.

For more insights on the market size of various regions, Request Free Sample
The North American market held the largest share in The market in 2024, driven by the increasing adoption of IoT-based home gardening solutions and the growing trend of urban farming. The US, Canada, and Mexico are the primary contributors to the market's revenue growth in this region. The need for space-saving solutions and appealing aesthetics is fueling the demand for smart indoor garden systems. Additionally, rising investments in construction and infrastructure projects are further propelling the market's expansion in North America. Digital technologies, including sensors, LED grow lights, machine learning algorithms, cameras, and vision systems, are integral components of these systems.
They enable automated devices for fertilizer application, watering, temperature control, and pest management. Smart soil, nutrition systems, and self-watering mechanisms are other essential features. Urban areas, apartments, cities, and commercial segments, including outdoor restaurants, cafes, hotels, entertainment parks, corporate offices, and lawn & garden consumables, are the primary end-users. The market's growth is also attributed to the increasing popularity of organic foods and the integration of modern and innovative technologies such as artificial intelligence and digital monitoring systems. The market's future potential lies in wireless connectivity, sensor-based monitoring systems, and home gardens.
Market Dynamics
Our researchers analyzed the data with 2024 as the base year, along with the key drivers, trends, and challenges. A holistic analysis of drivers will help companies refine their marketing strategies to gain a competitive advantage.
What are the key market drivers leading to the rise in the adoption of Smart Indoor Garden Systems Industry?
- Rising demand for IoT-based smart home garden watering systems is the key driver of the market. The market witnessed notable expansion in 2024, fueled by the increasing preference for Internet of Things (IoT)-enabled home garden watering systems. These advanced systems cater to consumers' demand for convenient and efficient gardening solutions. IoT integration facilitates real-time monitoring and control of watering schedules, promoting optimal plant health and minimizing water wastage. This trend is particularly prominent in urban environments, where space constraints and busy lifestyles necessitate innovative gardening approaches. Furthermore, the growing awareness of sustainable living and the benefits of indoor gardening, including improved air quality and mental well-being, are driving market growth. Digital technologies, such as artificial intelligence, machine learning algorithms, cameras, and vision systems, are integrated into these systems to optimize lighting, temperature, and nutrient delivery.
- Smart hydroponic systems, LED lights, and self-watering mechanisms are essential components of these systems, catering to the commercial and residential segments. Urban areas, apartments, cities, outdoor restaurants, cafes, hotels, entertainment parks, corporate offices, and lawn & garden consumables are primary markets for these modern and innovative technologies. Smart indoor garden systems offer intelligent soil, nutrition systems, pest management, and self-watering mechanisms, ensuring better yields and reducing the need for fertilizers, pesticides, and insecticides.
What are the market trends shaping the Smart Indoor Garden Systems Industry?
- Growing popularity of vertical gardens is the upcoming market trend. Smart indoor gardens, driven by vertical farming and urban farming techniques, are gaining popularity due to the scarcity of arable land in urban areas. Hydroponics, controlled environment agriculture, and other modern and innovative technologies are being employed to grow fresh fruits, herbs, and flowers in limited spaces. The Internet of Things (IoT), artificial intelligence, digital technologies, sensors, LED grow lights, machine learning algorithms, cameras, and vision systems are integral components of these advanced gardening systems. Automated devices for fertilizer application, watering, lighting, temperature control, and pest management ensure optimal plant growth. Insecticides and self-watering mechanisms are also utilized for insect control and intelligent soil nutrition.
- Vertical gardens in apartments, cities, and commercial buildings offer numerous benefits, including improved air quality, energy efficiency, and mental and emotional health. Exports and imports of these gardening techniques are increasing, with many countries adopting these farming methods for better yields. Organizations in various parts of the world are investing in smart greenhouses, interior design, and green technology to expand their vertical garden spaces. AI-based home appliances and digital monitoring systems with wireless connectivity and sensor-based monitoring systems are being used to automate plant maintenance and watering. Home gardens, vertical gardens, and lawn & garden consumables are becoming essential for modern living, making these technologies a significant trend in the market.
What challenges does the Smart Indoor Garden Systems Industry face during its growth?
- Rising demand for artificial grass is a key challenge affecting the industry growth. Smart indoor gardens, driven by technologies such as vertical farming, urban farming, hydroponics, and controlled environment agriculture, are revolutionizing the way we grow organic foods. The Internet of Things (IoT), artificial intelligence (AI), digital technologies, sensors, LED grow lights, machine learning algorithms, cameras, and vision systems are transforming traditional farming techniques. These advanced technologies enable automated devices for fertilizer application, watering, lighting, temperature control, and pest management. In urban areas, apartments, cities, and commercial segments, smart indoor gardens are gaining popularity due to their ability to provide fresh fruits, herbs, and flowers. Modern and innovative technologies like self-watering systems, intelligent soil, nutrition systems, and AI-based home appliances offer better yields and digital monitoring systems with wireless connectivity and sensor-based monitoring systems.
- Smart indoor gardens are essential for mental and emotional health, and their integration with interior designing enhances the aesthetic appeal of modern homes, offices, restaurants, cafes, hotels, entertainment parks, and corporate offices. The export and import of these advanced gardening systems are on the rise, making them accessible to a global audience. In summary, smart indoor gardens represent a significant shift in farming techniques, offering numerous benefits, including convenience, sustainability, and improved yields. These systems integrate various digital technologies, making them an essential component of modern living.
Exclusive Customer Landscape
The smart indoor garden systems market forecasting report includes the adoption lifecycle of the market, covering from the innovator's stage to the laggard's stage. It focuses on adoption rates in different regions based on penetration. Furthermore, the smart indoor garden systems market report also includes key purchase criteria and drivers of price sensitivity to help companies evaluate and develop their market growth analysis strategies.
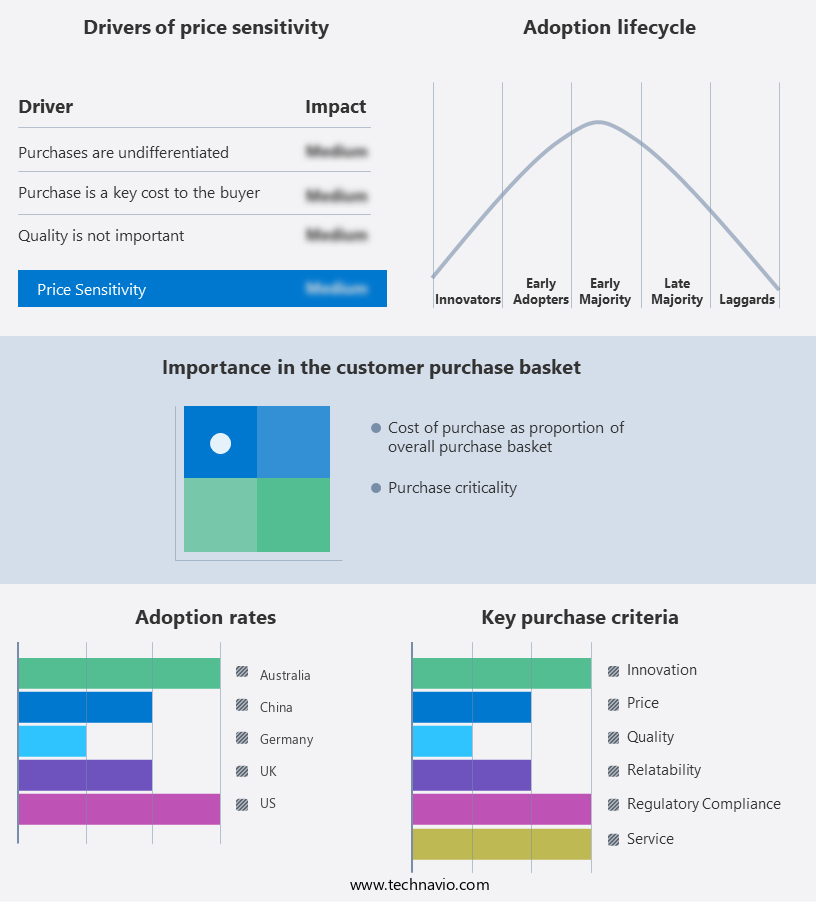
Customer Landscape
Key Companies & Market Insights
Companies are implementing various strategies, such as strategic alliances, smart indoor garden systems market forecast, partnerships, mergers and acquisitions, geographical expansion, and product/service launches, to enhance their presence in the industry.
AeroFarms LLC - The company offers a smart indoor garden system, such as fully connected indoor vertical farms with fully controlled environment, optimized plant biology and precision aeroponics.
The industry research and growth report includes detailed analyses of the competitive landscape of the market and information about key companies, including:
- AeroFarms LLC
- Agrilution Systems GmbH
- AVA Technologies Inc.
- Bowery Farming Inc.
- CityCrop Automated Indoor Farming P.C
- Click and Grow LLC
- EDN Inc.
- Gardyn Inc.
- iFarm
- ingarden Inc.
- JOICOM Corp.
- Metropolis Farms Canada
- Moistenland LLC
- Natufia Labs
- Plantui Oy
- Rise Gardens LLC
- Robert Bosch GmbH
- The Leaf Land Scape
- Tower Garden
Qualitative and quantitative analysis of companies has been conducted to help clients understand the wider business environment as well as the strengths and weaknesses of key industry players. Data is qualitatively analyzed to categorize companies as pure play, category-focused, industry-focused, and diversified; it is quantitatively analyzed to categorize companies as dominant, leading, strong, tentative, and weak.
Research Analyst Overview
The global market for smart indoor gardens is experiencing significant growth as the demand for locally grown, fresh produce and sustainable farming practices continues to rise. This market encompasses various advanced technologies such as vertical farming, hydroponics, and controlled environment agriculture, all of which are integral components of urban and indoor farming. The integration of digital technologies, including the Internet of Things (IoT) and artificial intelligence (AI), is revolutionizing the way these farming systems operate. Sensors, LED grow lights, and machine learning algorithms are being employed to optimize plant growth and maintain ideal environmental conditions. Cameras and vision systems are used for real-time monitoring and analysis, while robots automate various tasks such as fertilization, watering, and temperature control.
The use of smart indoor gardens is not limited to commercial farming operations. Residential applications, including apartments and urban areas, are also adopting these modern and innovative technologies. The integration of smart indoor gardens in homes not only provides access to fresh fruits, herbs, and flowers but also offers mental and emotional health benefits. The commercial segment of the smart indoor gardens market is witnessing substantial growth due to the demand for better yields and increased efficiency. Automated devices and self-watering systems are becoming increasingly popular in commercial farming operations, reducing the need for manual labor and minimizing the use of fertilizers and pesticides.
Smart indoor gardens are also gaining popularity in various industries such as hospitality, including outdoor restaurants, cafes, hotels, and entertainment parks. Corporate offices are also incorporating these systems to create a healthier work environment and promote sustainability. The integration of smart indoor gardens in interior designing is another emerging trend. These systems can be used to create stunning vertical gardens and home gardens, adding aesthetic value to both residential and commercial spaces. The market for smart indoor gardens is expected to grow significantly due to the increasing demand for organic foods and the need for sustainable farming practices.
The use of digital technologies in these systems offers numerous benefits, including improved yields, reduced water usage, and the ability to grow produce year-round. The market for smart indoor gardens is also witnessing the development of AI-based home appliances and digital monitoring systems, enabling wireless connectivity and sensor-based monitoring systems. These advancements are expected to further drive the growth of the market. The global market for smart indoor gardens is experiencing significant growth due to the increasing demand for locally grown, fresh produce and sustainable farming practices. The integration of digital technologies, including the Internet of Things and artificial intelligence, is revolutionizing the way these systems operate, offering numerous benefits such as improved yields, reduced water usage, and the ability to grow produce year-round. The market is expected to continue growing due to the increasing demand for organic foods and the need for sustainable farming practices.
Market Scope
|
Report Coverage
|
Details
|
Page number
|
230
|
Base year
|
2024
|
Historic period
|
2019-2023 |
Forecast period
|
2025-2029
|
Growth momentum & CAGR
|
Accelerate at a CAGR of 9.4%
|
Market growth 2025-2029
|
USD 1.33 Billion
|
Market structure
|
Fragmented
|
YoY growth 2024-2025(%)
|
8.5
|
Key countries
|
US, Canada, China, UK, Japan, Germany, India, France, Australia, and Italy
|
Competitive landscape
|
Leading Companies, Market Positioning of Companies, Competitive Strategies, and Industry Risks
|
Request Free Sample
What are the Key Data Covered in this Smart Indoor Garden Systems Market Research and Growth Report?
- CAGR of the Smart Indoor Garden Systems industry during the forecast period
- Detailed information on factors that will drive the growth and forecasting between 2025 and 2029
- Precise estimation of the size of the market and its contribution of the industry in focus to the parent market
- Accurate predictions about upcoming growth and trends and changes in consumer behaviour
- Growth of the market across North America, Europe, APAC, Middle East and Africa, and South America
- Thorough analysis of the market's competitive landscape and detailed information about companies
- Comprehensive analysis of factors that will challenge the smart indoor garden systems market growth of industry companies
We can help! Our analysts can customize this smart indoor garden systems market research report to meet your requirements.
Get in touch
1 Executive Summary
- 1.1 Market overview
- Executive Summary - Chart on Market Overview
- Executive Summary - Data Table on Market Overview
- Executive Summary - Chart on Global Market Characteristics
- Executive Summary - Chart on Market by Geography
- Executive Summary - Chart on Market Segmentation by Type
- Executive Summary - Chart on Market Segmentation by Product
- Executive Summary - Chart on Market Segmentation by Product Type
- Executive Summary - Chart on Market Segmentation by End-user
- Executive Summary - Chart on Market Segmentation by Distribution Channel
- Executive Summary - Chart on Incremental Growth
- Executive Summary - Data Table on Incremental Growth
- Executive Summary - Chart on Company Market Positioning
2 Technavio Analysis
- 2.1 Analysis of price sensitivity, lifecycle, customer purchase basket, adoption rates, and purchase criteria
- Analysis of price sensitivity, lifecycle, customer purchase basket, adoption rates, and purchase criteria
- 2.2 Criticality of inputs and Factors of differentiation
- Overview on criticality of inputs and factors of differentiation
- 2.3 Factors of disruption
- Overview on factors of disruption
- 2.4 Impact of drivers and challenges
- Impact of drivers and challenges in 2024 and 2029
3 Market Landscape
- 3.1 Market ecosystem
- Parent Market
- Data Table on - Parent Market
- 3.2 Market characteristics
- Market characteristics analysis
4 Market Sizing
- 4.1 Market definition
- Offerings of companies included in the market definition
- 4.2 Market segment analysis
- 4.4 Market outlook: Forecast for 2024-2029
- Chart on Global - Market size and forecast 2024-2029 ($ million)
- Data Table on Global - Market size and forecast 2024-2029 ($ million)
- Chart on Global Market: Year-over-year growth 2024-2029 (%)
- Data Table on Global Market: Year-over-year growth 2024-2029 (%)
5 Historic Market Size
- 5.1 Global Smart Indoor Garden Systems Market 2019 - 2023
- Historic Market Size - Data Table on Global Smart Indoor Garden Systems Market 2019 - 2023 ($ million)
- 5.2 Type segment analysis 2019 - 2023
- Historic Market Size - Type Segment 2019 - 2023 ($ million)
- 5.3 Product segment analysis 2019 - 2023
- Historic Market Size - Product Segment 2019 - 2023 ($ million)
- 5.4 Product Type segment analysis 2019 - 2023
- Historic Market Size - Product Type Segment 2019 - 2023 ($ million)
- 5.5 End-user segment analysis 2019 - 2023
- Historic Market Size - End-user Segment 2019 - 2023 ($ million)
- 5.6 Distribution Channel segment analysis 2019 - 2023
- Historic Market Size - Distribution Channel Segment 2019 - 2023 ($ million)
- 5.7 Geography segment analysis 2019 - 2023
- Historic Market Size - Geography Segment 2019 - 2023 ($ million)
- 5.8 Country segment analysis 2019 - 2023
- Historic Market Size - Country Segment 2019 - 2023 ($ million)
6 Qualitative Analysis
- 6.1 The AI impact on Global Smart Indoor Garden Systems Market
7 Five Forces Analysis
- 7.1 Five forces summary
- Five forces analysis - Comparison between 2024 and 2029
- 7.2 Bargaining power of buyers
- Bargaining power of buyers - Impact of key factors 2024 and 2029
- 7.3 Bargaining power of suppliers
- Bargaining power of suppliers - Impact of key factors in 2024 and 2029
- 7.4 Threat of new entrants
- Threat of new entrants - Impact of key factors in 2024 and 2029
- 7.5 Threat of substitutes
- Threat of substitutes - Impact of key factors in 2024 and 2029
- 7.6 Threat of rivalry
- Threat of rivalry - Impact of key factors in 2024 and 2029
- 7.7 Market condition
- Chart on Market condition - Five forces 2024 and 2029
8 Market Segmentation by Type
- 8.1 Market segments
- Chart on Type - Market share 2024-2029 (%)
- Data Table on Type - Market share 2024-2029 (%)
- 8.2 Comparison by Type
- Chart on Comparison by Type
- Data Table on Comparison by Type
- 8.3 Floor garden - Market size and forecast 2024-2029
- Chart on Floor garden - Market size and forecast 2024-2029 ($ million)
- Data Table on Floor garden - Market size and forecast 2024-2029 ($ million)
- Chart on Floor garden - Year-over-year growth 2024-2029 (%)
- Data Table on Floor garden - Year-over-year growth 2024-2029 (%)
- 8.4 Wall garden - Market size and forecast 2024-2029
- Chart on Wall garden - Market size and forecast 2024-2029 ($ million)
- Data Table on Wall garden - Market size and forecast 2024-2029 ($ million)
- Chart on Wall garden - Year-over-year growth 2024-2029 (%)
- Data Table on Wall garden - Year-over-year growth 2024-2029 (%)
- 8.5 Market opportunity by Type
- Market opportunity by Type ($ million)
- Data Table on Market opportunity by Type ($ million)
9 Market Segmentation by Product
- 9.1 Market segments
- Chart on Product - Market share 2024-2029 (%)
- Data Table on Product - Market share 2024-2029 (%)
- 9.2 Comparison by Product
- Chart on Comparison by Product
- Data Table on Comparison by Product
- 9.3 LED grow lights - Market size and forecast 2024-2029
- Chart on LED grow lights - Market size and forecast 2024-2029 ($ million)
- Data Table on LED grow lights - Market size and forecast 2024-2029 ($ million)
- Chart on LED grow lights - Year-over-year growth 2024-2029 (%)
- Data Table on LED grow lights - Year-over-year growth 2024-2029 (%)
- 9.4 Automated watering systems - Market size and forecast 2024-2029
- Chart on Automated watering systems - Market size and forecast 2024-2029 ($ million)
- Data Table on Automated watering systems - Market size and forecast 2024-2029 ($ million)
- Chart on Automated watering systems - Year-over-year growth 2024-2029 (%)
- Data Table on Automated watering systems - Year-over-year growth 2024-2029 (%)
- 9.5 Nutrient delivery systems - Market size and forecast 2024-2029
- Chart on Nutrient delivery systems - Market size and forecast 2024-2029 ($ million)
- Data Table on Nutrient delivery systems - Market size and forecast 2024-2029 ($ million)
- Chart on Nutrient delivery systems - Year-over-year growth 2024-2029 (%)
- Data Table on Nutrient delivery systems - Year-over-year growth 2024-2029 (%)
- 9.6 Environmental monitoring - Market size and forecast 2024-2029
- Chart on Environmental monitoring - Market size and forecast 2024-2029 ($ million)
- Data Table on Environmental monitoring - Market size and forecast 2024-2029 ($ million)
- Chart on Environmental monitoring - Year-over-year growth 2024-2029 (%)
- Data Table on Environmental monitoring - Year-over-year growth 2024-2029 (%)
- 9.7 Market opportunity by Product
- Market opportunity by Product ($ million)
- Data Table on Market opportunity by Product ($ million)
10 Market Segmentation by Product Type
- 10.1 Market segments
- Chart on Product Type - Market share 2024-2029 (%)
- Data Table on Product Type - Market share 2024-2029 (%)
- 10.2 Comparison by Product Type
- Chart on Comparison by Product Type
- Data Table on Comparison by Product Type
- 10.3 Hydroponics - Market size and forecast 2024-2029
- Chart on Hydroponics - Market size and forecast 2024-2029 ($ million)
- Data Table on Hydroponics - Market size and forecast 2024-2029 ($ million)
- Chart on Hydroponics - Year-over-year growth 2024-2029 (%)
- Data Table on Hydroponics - Year-over-year growth 2024-2029 (%)
- 10.4 Soil-based - Market size and forecast 2024-2029
- Chart on Soil-based - Market size and forecast 2024-2029 ($ million)
- Data Table on Soil-based - Market size and forecast 2024-2029 ($ million)
- Chart on Soil-based - Year-over-year growth 2024-2029 (%)
- Data Table on Soil-based - Year-over-year growth 2024-2029 (%)
- 10.5 Aquaponics - Market size and forecast 2024-2029
- Chart on Aquaponics - Market size and forecast 2024-2029 ($ million)
- Data Table on Aquaponics - Market size and forecast 2024-2029 ($ million)
- Chart on Aquaponics - Year-over-year growth 2024-2029 (%)
- Data Table on Aquaponics - Year-over-year growth 2024-2029 (%)
- 10.6 Aeroponics - Market size and forecast 2024-2029
- Chart on Aeroponics - Market size and forecast 2024-2029 ($ million)
- Data Table on Aeroponics - Market size and forecast 2024-2029 ($ million)
- Chart on Aeroponics - Year-over-year growth 2024-2029 (%)
- Data Table on Aeroponics - Year-over-year growth 2024-2029 (%)
- 10.7 Market opportunity by Product Type
- Market opportunity by Product Type ($ million)
- Data Table on Market opportunity by Product Type ($ million)
11 Market Segmentation by End-user
- 11.1 Market segments
- Chart on End-user - Market share 2024-2029 (%)
- Data Table on End-user - Market share 2024-2029 (%)
- 11.2 Comparison by End-user
- Chart on Comparison by End-user
- Data Table on Comparison by End-user
- 11.3 Residential - Market size and forecast 2024-2029
- Chart on Residential - Market size and forecast 2024-2029 ($ million)
- Data Table on Residential - Market size and forecast 2024-2029 ($ million)
- Chart on Residential - Year-over-year growth 2024-2029 (%)
- Data Table on Residential - Year-over-year growth 2024-2029 (%)
- 11.4 Commercial - Market size and forecast 2024-2029
- Chart on Commercial - Market size and forecast 2024-2029 ($ million)
- Data Table on Commercial - Market size and forecast 2024-2029 ($ million)
- Chart on Commercial - Year-over-year growth 2024-2029 (%)
- Data Table on Commercial - Year-over-year growth 2024-2029 (%)
- 11.5 Market opportunity by End-user
- Market opportunity by End-user ($ million)
- Data Table on Market opportunity by End-user ($ million)
12 Market Segmentation by Distribution Channel
- 12.1 Market segments
- Chart on Distribution Channel - Market share 2024-2029 (%)
- Data Table on Distribution Channel - Market share 2024-2029 (%)
- 12.2 Comparison by Distribution Channel
- Chart on Comparison by Distribution Channel
- Data Table on Comparison by Distribution Channel
- 12.3 Offline - Market size and forecast 2024-2029
- Chart on Offline - Market size and forecast 2024-2029 ($ million)
- Data Table on Offline - Market size and forecast 2024-2029 ($ million)
- Chart on Offline - Year-over-year growth 2024-2029 (%)
- Data Table on Offline - Year-over-year growth 2024-2029 (%)
- 12.4 Online - Market size and forecast 2024-2029
- Chart on Online - Market size and forecast 2024-2029 ($ million)
- Data Table on Online - Market size and forecast 2024-2029 ($ million)
- Chart on Online - Year-over-year growth 2024-2029 (%)
- Data Table on Online - Year-over-year growth 2024-2029 (%)
- 12.5 Market opportunity by Distribution Channel
- Market opportunity by Distribution Channel ($ million)
- Data Table on Market opportunity by Distribution Channel ($ million)
13 Customer Landscape
- 13.1 Customer landscape overview
- Analysis of price sensitivity, lifecycle, customer purchase basket, adoption rates, and purchase criteria
14 Geographic Landscape
- 14.1 Geographic segmentation
- Chart on Market share by geography 2024-2029 (%)
- Data Table on Market share by geography 2024-2029 (%)
- 14.2 Geographic comparison
- Chart on Geographic comparison
- Data Table on Geographic comparison
- 14.3 North America - Market size and forecast 2024-2029
- Chart on North America - Market size and forecast 2024-2029 ($ million)
- Data Table on North America - Market size and forecast 2024-2029 ($ million)
- Chart on North America - Year-over-year growth 2024-2029 (%)
- Data Table on North America - Year-over-year growth 2024-2029 (%)
- 14.4 Europe - Market size and forecast 2024-2029
- Chart on Europe - Market size and forecast 2024-2029 ($ million)
- Data Table on Europe - Market size and forecast 2024-2029 ($ million)
- Chart on Europe - Year-over-year growth 2024-2029 (%)
- Data Table on Europe - Year-over-year growth 2024-2029 (%)
- 14.5 APAC - Market size and forecast 2024-2029
- Chart on APAC - Market size and forecast 2024-2029 ($ million)
- Data Table on APAC - Market size and forecast 2024-2029 ($ million)
- Chart on APAC - Year-over-year growth 2024-2029 (%)
- Data Table on APAC - Year-over-year growth 2024-2029 (%)
- 14.6 Middle East and Africa - Market size and forecast 2024-2029
- Chart on Middle East and Africa - Market size and forecast 2024-2029 ($ million)
- Data Table on Middle East and Africa - Market size and forecast 2024-2029 ($ million)
- Chart on Middle East and Africa - Year-over-year growth 2024-2029 (%)
- Data Table on Middle East and Africa - Year-over-year growth 2024-2029 (%)
- 14.7 South America - Market size and forecast 2024-2029
- Chart on South America - Market size and forecast 2024-2029 ($ million)
- Data Table on South America - Market size and forecast 2024-2029 ($ million)
- Chart on South America - Year-over-year growth 2024-2029 (%)
- Data Table on South America - Year-over-year growth 2024-2029 (%)
- 14.8 US - Market size and forecast 2024-2029
- Chart on US - Market size and forecast 2024-2029 ($ million)
- Data Table on US - Market size and forecast 2024-2029 ($ million)
- Chart on US - Year-over-year growth 2024-2029 (%)
- Data Table on US - Year-over-year growth 2024-2029 (%)
- 14.9 Canada - Market size and forecast 2024-2029
- Chart on Canada - Market size and forecast 2024-2029 ($ million)
- Data Table on Canada - Market size and forecast 2024-2029 ($ million)
- Chart on Canada - Year-over-year growth 2024-2029 (%)
- Data Table on Canada - Year-over-year growth 2024-2029 (%)
- 14.10 China - Market size and forecast 2024-2029
- Chart on China - Market size and forecast 2024-2029 ($ million)
- Data Table on China - Market size and forecast 2024-2029 ($ million)
- Chart on China - Year-over-year growth 2024-2029 (%)
- Data Table on China - Year-over-year growth 2024-2029 (%)
- 14.11 UK - Market size and forecast 2024-2029
- Chart on UK - Market size and forecast 2024-2029 ($ million)
- Data Table on UK - Market size and forecast 2024-2029 ($ million)
- Chart on UK - Year-over-year growth 2024-2029 (%)
- Data Table on UK - Year-over-year growth 2024-2029 (%)
- 14.12 Japan - Market size and forecast 2024-2029
- Chart on Japan - Market size and forecast 2024-2029 ($ million)
- Data Table on Japan - Market size and forecast 2024-2029 ($ million)
- Chart on Japan - Year-over-year growth 2024-2029 (%)
- Data Table on Japan - Year-over-year growth 2024-2029 (%)
- 14.13 Germany - Market size and forecast 2024-2029
- Chart on Germany - Market size and forecast 2024-2029 ($ million)
- Data Table on Germany - Market size and forecast 2024-2029 ($ million)
- Chart on Germany - Year-over-year growth 2024-2029 (%)
- Data Table on Germany - Year-over-year growth 2024-2029 (%)
- 14.14 India - Market size and forecast 2024-2029
- Chart on India - Market size and forecast 2024-2029 ($ million)
- Data Table on India - Market size and forecast 2024-2029 ($ million)
- Chart on India - Year-over-year growth 2024-2029 (%)
- Data Table on India - Year-over-year growth 2024-2029 (%)
- 14.15 France - Market size and forecast 2024-2029
- Chart on France - Market size and forecast 2024-2029 ($ million)
- Data Table on France - Market size and forecast 2024-2029 ($ million)
- Chart on France - Year-over-year growth 2024-2029 (%)
- Data Table on France - Year-over-year growth 2024-2029 (%)
- 14.16 Italy - Market size and forecast 2024-2029
- Chart on Italy - Market size and forecast 2024-2029 ($ million)
- Data Table on Italy - Market size and forecast 2024-2029 ($ million)
- Chart on Italy - Year-over-year growth 2024-2029 (%)
- Data Table on Italy - Year-over-year growth 2024-2029 (%)
- 14.17 Australia - Market size and forecast 2024-2029
- Chart on Australia - Market size and forecast 2024-2029 ($ million)
- Data Table on Australia - Market size and forecast 2024-2029 ($ million)
- Chart on Australia - Year-over-year growth 2024-2029 (%)
- Data Table on Australia - Year-over-year growth 2024-2029 (%)
- 14.18 Market opportunity by geography
- Market opportunity by geography ($ million)
- Data Tables on Market opportunity by geography ($ million)
15 Drivers, Challenges, and Opportunity/Restraints
- 15.3 Impact of drivers and challenges
- Impact of drivers and challenges in 2024 and 2029
- 15.4 Market opportunities/restraints
16 Competitive Landscape
- 16.2 Competitive Landscape
- Overview on criticality of inputs and factors of differentiation
- 16.3 Landscape disruption
- Overview on factors of disruption
- 16.4 Industry risks
- Impact of key risks on business
17 Competitive Analysis
- 17.2 Company ranking index
- 17.3 Market positioning of companies
- Matrix on companies position and classification
- 17.4 AeroFarms LLC
- AeroFarms LLC - Overview
- AeroFarms LLC - Product / Service
- AeroFarms LLC - Key offerings
- SWOT
- 17.5 Agrilution Systems GmbH
- Agrilution Systems GmbH - Overview
- Agrilution Systems GmbH - Product / Service
- Agrilution Systems GmbH - Key offerings
- SWOT
- 17.6 AVA Technologies Inc.
- AVA Technologies Inc. - Overview
- AVA Technologies Inc. - Product / Service
- AVA Technologies Inc. - Key offerings
- SWOT
- 17.7 CityCrop Automated Indoor Farming P.C
- CityCrop Automated Indoor Farming P.C - Overview
- CityCrop Automated Indoor Farming P.C - Product / Service
- CityCrop Automated Indoor Farming P.C - Key offerings
- SWOT
- 17.8 Click and Grow LLC
- Click and Grow LLC - Overview
- Click and Grow LLC - Product / Service
- Click and Grow LLC - Key offerings
- SWOT
- 17.9 EDN Inc.
- EDN Inc. - Overview
- EDN Inc. - Product / Service
- EDN Inc. - Key offerings
- SWOT
- 17.10 Gardyn Inc.
- Gardyn Inc. - Overview
- Gardyn Inc. - Product / Service
- Gardyn Inc. - Key offerings
- SWOT
- 17.11 iFarm
- iFarm - Overview
- iFarm - Product / Service
- iFarm - Key offerings
- SWOT
- 17.12 ingarden Inc.
- ingarden Inc. - Overview
- ingarden Inc. - Product / Service
- ingarden Inc. - Key offerings
- SWOT
- 17.13 Metropolis Farms Canada
- Metropolis Farms Canada - Overview
- Metropolis Farms Canada - Product / Service
- Metropolis Farms Canada - Key offerings
- SWOT
- 17.14 Moistenland LLC
- Moistenland LLC - Overview
- Moistenland LLC - Product / Service
- Moistenland LLC - Key offerings
- SWOT
- 17.15 Plantui Oy
- Plantui Oy - Overview
- Plantui Oy - Product / Service
- Plantui Oy - Key offerings
- SWOT
- 17.16 Rise Gardens LLC
- Rise Gardens LLC - Overview
- Rise Gardens LLC - Product / Service
- Rise Gardens LLC - Key offerings
- SWOT
- 17.17 Robert Bosch GmbH
- Robert Bosch GmbH - Overview
- Robert Bosch GmbH - Product / Service
- Robert Bosch GmbH - Key news
- Robert Bosch GmbH - Key offerings
- SWOT
- 17.18 Tower Garden
- Tower Garden - Overview
- Tower Garden - Product / Service
- Tower Garden - Key offerings
- SWOT
18 Appendix
- 18.2 Inclusions and exclusions checklist
- Inclusions checklist
- Exclusions checklist
- 18.3 Currency conversion rates for US$
- Currency conversion rates for US$
- 18.4 Research methodology
- 18.7 Validation techniques employed for market sizing
- Validation techniques employed for market sizing
- 18.9 360 degree market analysis
- 360 degree market analysis
- 18.10 List of abbreviations