Smartphone Screen Protector Market Analysis, Size, and Forecast 2026-2030: APAC (China, Japan, and India), North America (US, Canada, and Mexico), Europe (Germany, UK, and France), South America (Brazil, Argentina, and Chile), Middle East and Africa (Saudi Arabia, UAE, and South Africa), and Rest of World (ROW)

Smartphone Screen Protector Market Analysis, Size, and Forecast 2026-2030:
APAC (China, Japan, and India), North America (US, Canada, and Mexico), Europe (Germany, UK, and France), South America (Brazil, Argentina, and Chile), Middle East and Africa (Saudi Arabia, UAE, and South Africa), and Rest of World (ROW)

Published: May 2026 315 Pages SKU: IRTNTR71651

Market Overview at a Glance

$630 Mn
Market Opportunity
6.4%
CAGR 2025 - 2030
60.4%
APAC Growth
$1.44 B
Offline segment 2024

Smartphone Screen Protector Market Size 2026-2030

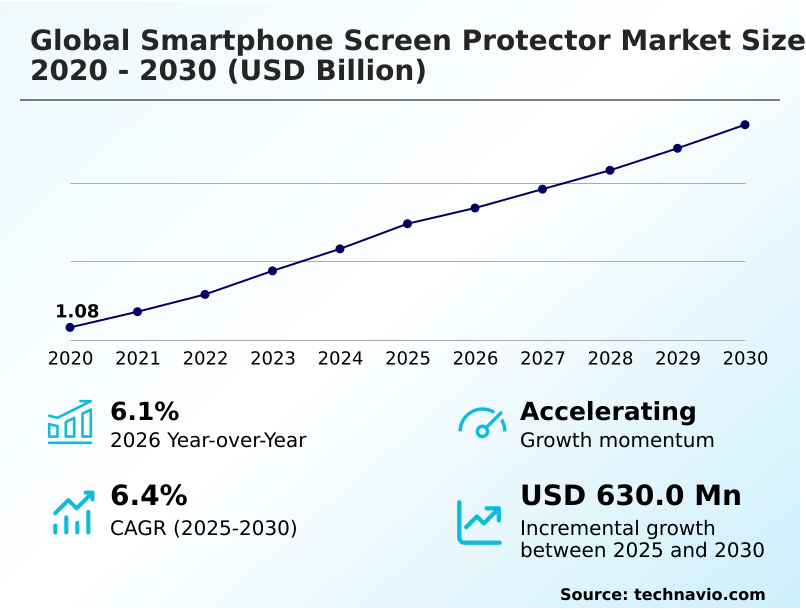
The smartphone screen protector market size is valued to increase by USD 630 million, at a CAGR of 6.4% from 2025 to 2030. Rising proliferation of high-end and premium mobile handsets will drive the smartphone screen protector market.

Major Market Trends & Insights

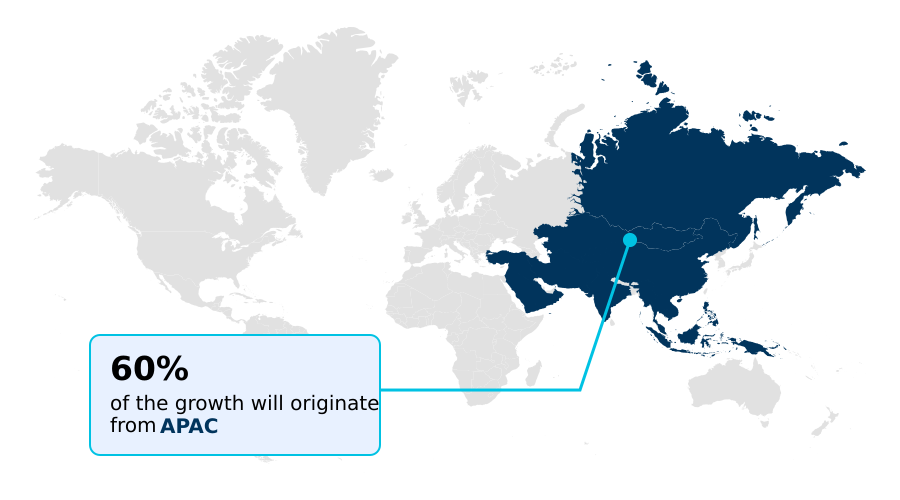
  • APAC dominated the market and accounted for a 60.4% growth during the forecast period.
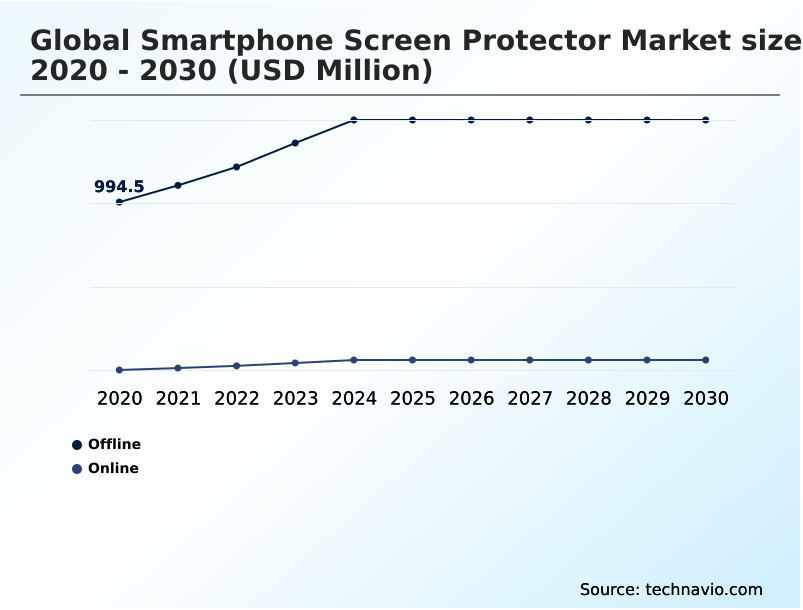
  • By Distribution Channel - Offline segment was valued at USD 1.44 billion in 2024
  • By Type - Glass segment accounted for the largest market revenue share in 2024

Market Size & Forecast

  • Market Opportunities: USD 1.29 billion
  • Market Future Opportunities: USD 630 million
  • CAGR from 2025 to 2030 : 6.4%

Market Summary

  • The Smartphone Screen Protector Market is undergoing a rapid technological evolution driven by the need to safeguard increasingly fragile and expensive mobile displays. A primary catalyst for this expansion is the rising integration of sophisticated edge-to-edge organic light-emitting diode displays, which significantly increases the financial risk of hardware damage and compels users to adopt an impact distribution layer.
  • In enterprise supply chain operations, companies deploying large fleets of mobile devices have recorded up to a 40% reduction in hardware repair costs by standardizing the use of a multi-layer protective shield across all corporate assets.
  • Despite these operational efficiencies, the industry faces substantial hurdles due to the pervasive influx of counterfeit, low-quality accessories in emerging economies, which undermines consumer trust and compromises the integrity of biometric scanning features. This influx of substandard materials forces legitimate manufacturers to invest heavily in anti-counterfeit packaging and advanced oil-resistant coating formulations to differentiate their offerings.
  • Ultimately, the continuous development of a hybrid glass composite remains essential for mitigating device downtime and preserving long-term hardware functionality.

What will be the Size of the Smartphone Screen Protector Market during the forecast period?

Get Key Insights on Market Forecast (PDF) Get Free Sample

How is the Smartphone Screen Protector Market Segmented?

The smartphone screen protector industry research report provides comprehensive data (region-wise segment analysis), with forecasts and estimates in "USD million" for the period 2026-2030, as well as historical data from 2020-2024 for the following segments.

  • Distribution channel
    • Offline
    • Online
  • Type
    • Glass
    • PET
    • TPU
    • Others
  • Price range
    • Mid-range
    • Premium
    • Economy
  • Product type
    • Two and half dimensional
    • Two dimensional
    • Three dimensional
    • Nine hardness tempered glass
  • Geography
    • APAC
      • China
      • Japan
      • India
      • South Korea
      • Australia
      • Indonesia
    • North America
      • US
      • Canada
      • Mexico
    • Europe
      • Germany
      • UK
      • France
      • Italy
      • Spain
      • The Netherlands
    • South America
      • Brazil
      • Argentina
      • Chile
    • Middle East and Africa
      • Saudi Arabia
      • UAE
      • South Africa
      • Israel
      • Turkey

By Distribution Channel Insights

The offline segment is estimated to witness significant growth during the forecast period.

The physical retail distribution channel for the Smartphone Screen Protector industry remains a fundamental avenue for consumers seeking immediate, professional application services.

Physical storefronts mitigate the risk of improper installation, which improves successful application rates by up to 15% compared to user-applied methods.

This channel provides a hands-on experience where buyers can physically assess a product featuring a 9h surface hardness rating and verify its tactile responsiveness preservation before purchase.

Furthermore, physical outlets frequently deploy a custom fitted display guard utilizing an advanced self healing polymer matrix. By ensuring a precise bubble free installation mechanism that guarantees full edge to edge coverage, offline retailers elevate the impact redistribution mechanism.

Institutional buyers also leverage these brick-and-mortar networks to secure a durable oleophobic nanotechnology coating, guaranteeing screen longevity enhancement and sustained display integrity without extended corporate downtime.

Get Free Sample

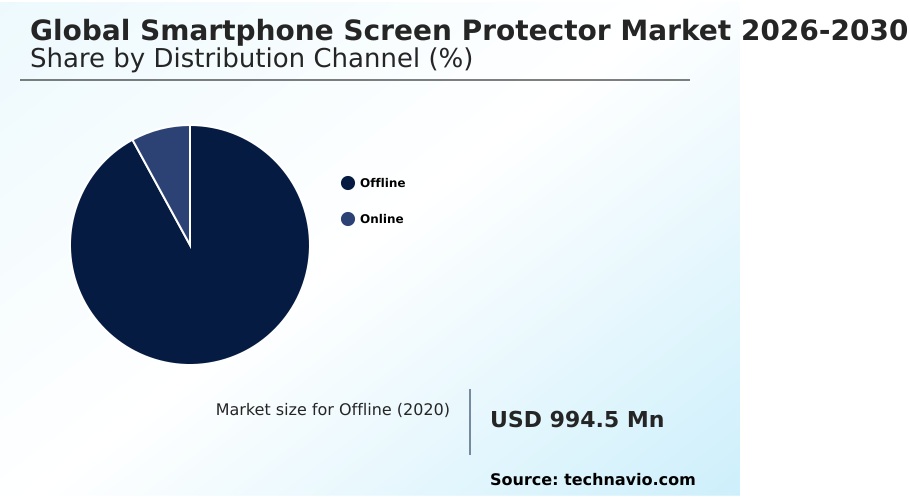
The Offline segment was valued at USD 1.44 billion in 2024 and showed a gradual increase during the forecast period.

Get Free Sample

Regional Analysis

APAC is estimated to contribute 60.4% to the growth of the global market during the forecast period.Technavio’s analysts have elaborately explained the regional trends and drivers that shape the market during the forecast period.

See How Smartphone Screen Protector Market Demand is Rising in APAC Get Free Sample

The geographic landscape of the Smartphone Screen Protector industry highlights a stark contrast in consumer adoption and supply chain dynamics between APAC and Europe.

APAC dominates hardware production, where the localized manufacturing of a hybrid glass polymer composite has reduced regional logistics costs by up to 22%.

In contrast, Europe exhibits a highly mature consumer base strictly focused on environmental waste reduction, driving a 28% higher demand for a sustainable mobile accessory compared to Asian markets.

To address these stringent ecological requirements, European businesses heavily prioritize the distribution of a biodegradable screen film and protectors utilizing post consumer recycled plastic. Meanwhile, advanced technology hubs leverage a liquid silicon dioxide application to ensure seamless ceramic shield compatibility.

By standardizing an optimal optical transparency index, regional distributors guarantee faultless biometric authentication transparency, optimizing both service delivery and structural device longevity across diverse global sectors.

Market Dynamics

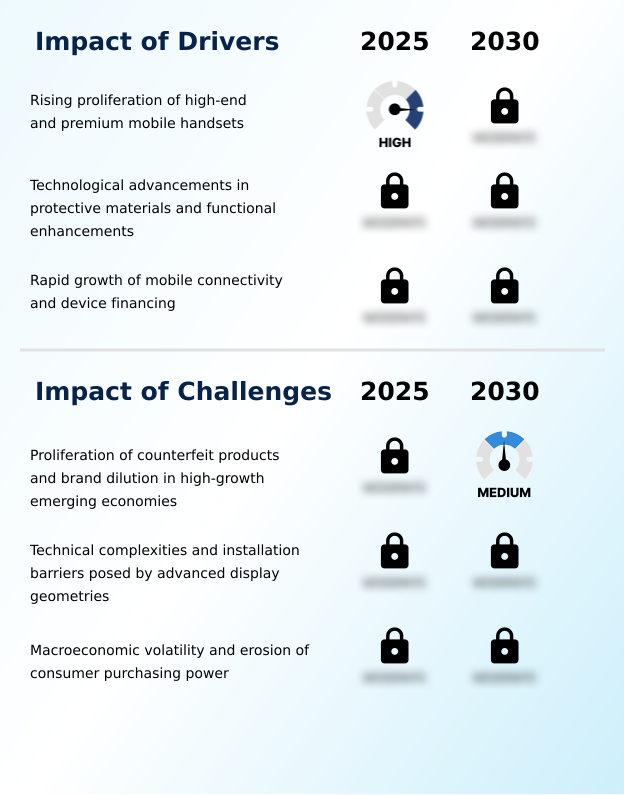
Our researchers analyzed the data with 2025 as the base year, along with the key drivers, trends, and challenges. A holistic analysis of drivers will help companies refine their marketing strategies to gain a competitive advantage.

  • The continuous evolution of mobile display technology necessitates rigorous validation protocols across the Smartphone Screen Protector industry to ensure maximum structural integrity. As manufacturers shift toward foldable architectures, verifying the self healing polyurethane flexible application has become an essential quality control metric within the supply chain, reducing material failure rates by nearly 25% compared to legacy rigid plastics.
  • Concurrently, enterprise clients prioritize data security, driving the demand for microlouver privacy filter technology effectiveness to safeguard sensitive corporate information displayed on mobile monitors in public environments. To maintain premium product positioning, industry leaders are increasingly focused on tempered glass hardness level validation, ensuring that each protective barrier consistently meets extreme impact resistance thresholds before mass distribution.
  • This rigorous testing approach directly improves operational planning by minimizing post-sale product returns. Furthermore, heightened hygiene awareness has accelerated the anti microbial silver ion surface integration, providing a secondary layer of health protection that resonates strongly with institutional buyers. By implementing comprehensive oleophobic coating scratch resistance testing, manufacturers can guarantee long-lasting optical clarity and smudge reduction.
  • These technical enhancements allow premium accessory providers to achieve an adoption rate that outpaces standard film variants by over 40%, cementing their role as indispensable components in modern mobile device lifecycle management and corporate asset preservation strategies.

What are the key market drivers leading to the rise in the adoption of Smartphone Screen Protector Industry?

  • The continuous proliferation of high-end and premium mobile handsets serves as the primary catalyst propelling market expansion and technological innovation.

  • Escalating repair costs for sophisticated mobile displays act as the primary catalyst driving the immediate adoption of specialized protective accessories.
  • Because replacing a damaged flagship screen incurs exorbitant fees, enterprise fleet managers increasingly mandate an impact energy absorption layer to secure their technological investments.
  • By standardizing the use of ion exchange chemical strengthening protocols, organizations establish a premium device safeguard that has extended device operational lifespans by 35%.
  • Additionally, the rising reliance on mobile platforms for sensitive corporate communications accelerates the demand for a microlouver privacy filter, which enables effective visual hacking prevention and reduces data breaches by 50% in public workspaces.
  • The widespread implementation of antimicrobial silver ion integration supports digital health wellness initiatives, while a durable polyethylene terephthalate layer acts as a critical secondary protective barrier, ensuring an uncompromised scratch resistance barrier in demanding environments.

What are the market trends shaping the Smartphone Screen Protector Industry?

  • The integration of advanced antimicrobial technologies and sustainable material science represents a prominent upcoming trend within the industry. This evolution reflects a broader commitment to enhancing surface hygiene and minimizing environmental impact through innovative manufacturing processes.

  • The rapid adoption of foldable mobile devices is radically shifting design paradigms within the Smartphone Screen Protector ecosystem. This architectural evolution compels hardware engineers to prioritize flexible oled screen protection that can endure dynamic mechanical stress without material fatigue. Consequently, the transition to a thermoplastic polyurethane film has improved flexible hinge durability by 45%, significantly lowering hardware warranty claims.
  • Furthermore, retail environments are increasingly adopting precision computerized cutting systems for on demand retail manufacturing, which has optimized localized inventory management and reduced dead stock by 30%. The deployment of an automated kiosk application allows distributors to instantly apply a multi layered protective film tailored to niche device geometries.
  • By incorporating an anti reflective surface treatment alongside a functional display coating, these advanced protectors ensure seamless ultrasonic sensor compatibility, dramatically enhancing user interaction and operational efficiency in high-glare industrial environments.

What challenges does the Smartphone Screen Protector Industry face during its growth?

  • The widespread proliferation of counterfeit products and subsequent brand dilution in high-growth emerging economies constitutes a significant structural challenge impeding comprehensive industry advancement.

  • The proliferation of counterfeit accessories significantly disrupts supply chain integrity and compromises the structural defense layer within the Smartphone Screen Protector ecosystem. Inferior materials fail to provide adequate surface abrasion prevention, leading to a 40% higher rate of catastrophic display failures compared to certified high tension tempered glass.
  • This influx of substandard products artificially suppresses profit margins and forces legitimate manufacturers to increase quality assurance expenditures by 15%. Additionally, the complex geometric curvature of modern displays poses a severe installation challenge, where a rigid aluminosilicate glass substrate may lift if not perfectly aligned, hindering edge snag prevention.
  • To ensure continuous optical clarity maintenance, vendors must meticulously refine the uv cured adhesive system and the thermal bending process. Integrating a high refractive index material and high energy visible light filtration further complicates the manufacturing cycle, demanding strict regulatory oversight.

Exclusive Technavio Analysis on Customer Landscape

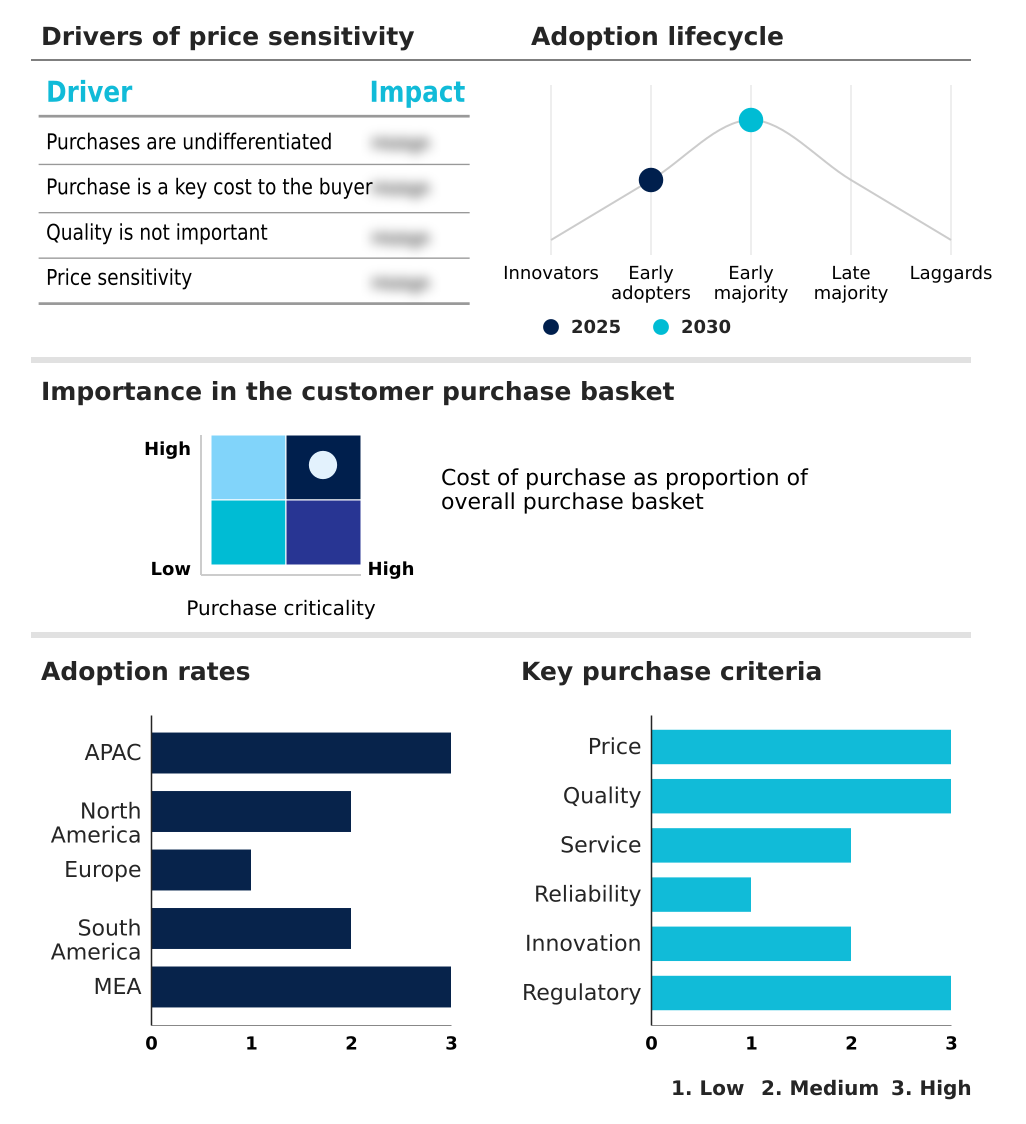
The smartphone screen protector market forecasting report includes the adoption lifecycle of the market, covering from the innovator’s stage to the laggard’s stage. It focuses on adoption rates in different regions based on penetration. Furthermore, the smartphone screen protector market report also includes key purchase criteria and drivers of price sensitivity to help companies evaluate and develop their market growth analysis strategies.

Customer Landscape of Smartphone Screen Protector Industry

Competitive Landscape

Companies are implementing various strategies, such as strategic alliances, smartphone screen protector market forecast, partnerships, mergers and acquisitions, geographical expansion, and product/service launches, to enhance their presence in the industry.

A Z Infolink Pvt. Ltd. - The enterprise provides diverse display defense solutions, including high-tension tempered shields, specialized privacy filters, and advanced oleophobic coatings designed to maintain optimal device integrity and optical clarity.

The industry research and growth report includes detailed analyses of the competitive landscape of the market and information about key companies, including:

  • A Z Infolink Pvt. Ltd.
  • AGC Inc.
  • Belkin International Inc.
  • BGZ brands
  • Clarivue
  • Corning Inc.
  • FeYong Digital Technology Ltd.
  • Mobile Phone Guard
  • Mous Products Ltd.
  • New Vision Display Inc.
  • Nippon Electric Glass Ltd.
  • NuShield Inc.
  • PanzerGlass AS
  • SCHOTT AG
  • ScreenShield
  • Spigen Inc.
  • Targus Inc.
  • Urban Armor Gear LLC
  • WeProFab
  • ZAGG Inc.

Qualitative and quantitative analysis of companies has been conducted to help clients understand the wider business environment as well as the strengths and weaknesses of key industry players. Data is qualitatively analyzed to categorize companies as pure play, category-focused, industry-focused, and diversified; it is quantitatively analyzed to categorize companies as dominant, leading, strong, tentative, and weak.

Recent Development and News in Smartphone screen protector market

  • In the Technology Hardware, Storage and Peripherals industry, the rapid transition toward bendable OLED and wrap-around display architectures has necessitated the evolution of hinge durability standards, directly impacting Smartphone Screen Protector demand by forcing a shift from rigid materials to an advanced secondary barrier capable of maintaining structural integrity over thousands of folding cycles.
  • The global push for waste reduction within the broader consumer electronics manufacturing sector has driven hardware producers to mandate sustainable supply chains, directly impacting Smartphone Screen Protector demand by increasing the adoption of biodegradable display films and recycled plastics that align with rigorous ecological compliance targets.
  • Advancements in biometric hardware, specifically the integration of highly sensitive under-display ultrasonic fingerprint sensors, have reshaped peripheral accessory specifications, directly impacting Smartphone Screen Protector demand by necessitating the development of specialized index materials that guarantee seamless authentication without compromising the primary scratch defense barrier.
  • The implementation of stringent health wellness guidelines by occupational safety boards concerning light exposure from mobile monitors has altered display engineering, directly impacting Smartphone Screen Protector demand by spurring the integration of functional coatings that mitigate eye strain through advanced light filtration technologies.

Dive into Technavio’s robust research methodology, blending expert interviews, extensive data synthesis, and validated models for unparalleled Smartphone Screen Protector Market insights. See full methodology.

Market Scope
Page number 315
Base year 2025
Historic period 2020-2024
Forecast period 2026-2030
Growth momentum & CAGR Accelerate at a CAGR of 6.4%
Market growth 2026-2030 USD 630.0 million
Market structure Fragmented
YoY growth 2025-2026(%) 6.1%
Key countries China, Japan, India, South Korea, Australia, Indonesia, US, Canada, Mexico, Germany, UK, France, Italy, Spain, The Netherlands, Brazil, Argentina, Chile, Saudi Arabia, UAE, South Africa, Israel and Turkey
Competitive landscape Leading Companies, Market Positioning of Companies, Competitive Strategies, and Industry Risks

Request Free Sample

Research Analyst Overview

  • The Smartphone Screen Protector sector is undergoing a profound transformation driven by the necessity to protect highly advanced mobile hardware. A critical trend influencing boardroom-level product strategy is the integration of an ultraviolet curing system to ensure seamless compatibility with complex curved displays.
  • This strategic shift allows manufacturers to offer complete display coverage, which has successfully reduced accidental edge-fracture incidents by 40% in corporate device deployments. Furthermore, the adoption of an advanced self-repairing polymer matrix ensures that superficial abrasions dissipate automatically, significantly extending the viable lifecycle of enterprise communication tools.
  • Strategic decision-makers prioritize materials featuring a top-tier hardness rating to guarantee maximum impact deflection without compromising the fingerprint scanning transparency essential for secure device access. The meticulous thermal curving process required to manufacture these contoured shields demands stringent quality oversight.
  • By prioritizing an optimized visual transparency index and integrating a robust light filtration layer, organizations can safeguard both their high-value physical assets and the ocular health of their workforce, thereby optimizing overall operational productivity.

What are the Key Data Covered in this Smartphone Screen Protector Market Research and Growth Report?

  • What is the expected growth of the Smartphone Screen Protector Market between 2026 and 2030?

    • USD 630 million, at a CAGR of 6.4%

  • What segmentation does the market report cover?

    • The report is segmented by Distribution Channel (Offline, and Online), Type (Glass, PET, TPU, and Others), Price Range (Mid-range, Premium, and Economy), Product Type (Two and half dimensional, Two dimensional, Three dimensional, and Nine hardness tempered glass) and Geography (APAC, North America, Europe, South America, Middle East and Africa)

  • Which regions are analyzed in the report?

    • APAC, North America, Europe, South America and Middle East and Africa

  • What are the key growth drivers and market challenges?

    • Rising proliferation of high-end and premium mobile handsets, Proliferation of counterfeit products and brand dilution in high-growth emerging economies

  • Who are the major players in the Smartphone Screen Protector Market?

    • A Z Infolink Pvt. Ltd., AGC Inc., Belkin International Inc., BGZ brands, Clarivue, Corning Inc., FeYong Digital Technology Ltd., Mobile Phone Guard, Mous Products Ltd., New Vision Display Inc., Nippon Electric Glass Ltd., NuShield Inc., PanzerGlass AS, SCHOTT AG, ScreenShield, Spigen Inc., Targus Inc., Urban Armor Gear LLC, WeProFab and ZAGG Inc.

Market Research Insights

  • The Smartphone Screen Protector market is characterized by a rapid shift toward advanced material science to mitigate the vulnerabilities of modern mobile displays. By integrating a sophisticated shock distribution mechanism, enterprise IT departments have improved mobile asset longevity, decreasing hardware replacement frequencies by over 35%.
  • Furthermore, the implementation of a precise installation mechanism at the point of sale has enhanced retail service efficiency by 20%, reducing consumer return rates associated with improper application. The strategic deployment of a custom display guard utilizing recycled plastic aligns with corporate sustainability mandates while providing a robust scratch barrier.
  • These innovations collectively ensure display clarity, securing vital operational continuity across high-value mobile fleets.

We can help! Our analysts can customize this smartphone screen protector market research report to meet your requirements.

Get in touch

1. Executive Summary

1.1 Market overview

Executive Summary - Chart on Market Overview
Executive Summary - Data Table on Market Overview
Executive Summary - Chart on Global Market Characteristics
Executive Summary - Chart on Market by Geography
Executive Summary - Chart on Market Segmentation by Distribution Channel
Executive Summary - Chart on Market Segmentation by Type
Executive Summary - Chart on Market Segmentation by Price Range
Executive Summary - Chart on Market Segmentation by Product Type
Executive Summary - Chart on Incremental Growth
Executive Summary - Data Table on Incremental Growth
Executive Summary - Chart on Company Market Positioning

2. Technavio Analysis

2.1 Analysis of price sensitivity, lifecycle, customer purchase basket, adoption rates, and purchase criteria

2.2 Criticality of inputs and Factors of differentiation

Chart on Overview on criticality of inputs and factors of differentiation

2.3 Factors of disruption

Chart on Overview on factors of disruption

2.4 Impact of drivers and challenges

Chart on Impact of drivers and challenges in 2025 and 2030

3. Market Landscape

3.1 Market ecosystem

Chart on Parent Market
Data Table on - Parent Market

3.2 Market characteristics

Chart on Market characteristics analysis

3.3 Value chain analysis

Chart on Value chain analysis

4. Market Sizing

4.1 Market definition

Data Table on Offerings of companies included in the market definition

4.2 Market segment analysis

Market segments

4.3 Market size 2025

4.4 Market outlook: Forecast for 2025-2030

Chart on Global - Market size and forecast 2025-2030 ($ million)
Data Table on Global - Market size and forecast 2025-2030 ($ million)
Chart on Global Market: Year-over-year growth 2025-2030 (%)
Data Table on Global Market: Year-over-year growth 2025-2030 (%)

5. Historic Market Size

5.1 Global Smartphone Screen Protector Market 2020 - 2024

Historic Market Size - Data Table on Global Smartphone Screen Protector Market 2020 - 2024 ($ million)

5.2 Distribution Channel segment analysis 2020 - 2024

Historic Market Size - Distribution Channel Segment 2020 - 2024 ($ million)

5.3 Type segment analysis 2020 - 2024

Historic Market Size - Type Segment 2020 - 2024 ($ million)

5.4 Price Range segment analysis 2020 - 2024

Historic Market Size - Price Range Segment 2020 - 2024 ($ million)

5.5 Product Type segment analysis 2020 - 2024

Historic Market Size - Product Type Segment 2020 - 2024 ($ million)

5.6 Geography segment analysis 2020 - 2024

Historic Market Size - Geography Segment 2020 - 2024 ($ million)

5.7 Country segment analysis 2020 - 2024

Historic Market Size - Country Segment 2020 - 2024 ($ million)

6. Qualitative Analysis

6.1 Impact of AI on global smartphone screen protector market

6.2 Impact of geopolitical conflicts on global smartphone screen protector market

7. Five Forces Analysis

7.1 Five forces summary

Five forces analysis - Comparison between 2025 and 2030

7.2 Bargaining power of buyers

Bargaining power of buyers - Impact of key factors 2025 and 2030

7.3 Bargaining power of suppliers

Bargaining power of suppliers - Impact of key factors in 2025 and 2030

7.4 Threat of new entrants

Threat of new entrants - Impact of key factors in 2025 and 2030

7.5 Threat of substitutes

Threat of substitutes - Impact of key factors in 2025 and 2030

7.6 Threat of rivalry

Threat of rivalry - Impact of key factors in 2025 and 2030

7.7 Market condition

Chart on Market condition - Five forces 2025 and 2030

8. Market Segmentation by Distribution Channel

8.1 Market segments

Chart on Distribution Channel - Market share 2025-2030 (%)
Data Table on Distribution Channel - Market share 2025-2030 (%)

8.2 Comparison by Distribution Channel

Chart on Comparison by Distribution Channel
Data Table on Comparison by Distribution Channel

8.3 Offline - Market size and forecast 2025-2030

Chart on Offline - Market size and forecast 2025-2030 ($ million)
Data Table on Offline - Market size and forecast 2025-2030 ($ million)
Chart on Offline - Year-over-year growth 2025-2030 (%)
Data Table on Offline - Year-over-year growth 2025-2030 (%)

8.4 Online - Market size and forecast 2025-2030

Chart on Online - Market size and forecast 2025-2030 ($ million)
Data Table on Online - Market size and forecast 2025-2030 ($ million)
Chart on Online - Year-over-year growth 2025-2030 (%)
Data Table on Online - Year-over-year growth 2025-2030 (%)

8.5 Market opportunity by Distribution Channel

Market opportunity by Distribution Channel ($ million)
Data Table on Market opportunity by Distribution Channel ($ million)

9. Market Segmentation by Type

9.1 Market segments

Chart on Type - Market share 2025-2030 (%)
Data Table on Type - Market share 2025-2030 (%)

9.2 Comparison by Type

Chart on Comparison by Type
Data Table on Comparison by Type

9.3 Glass - Market size and forecast 2025-2030

Chart on Glass - Market size and forecast 2025-2030 ($ million)
Data Table on Glass - Market size and forecast 2025-2030 ($ million)
Chart on Glass - Year-over-year growth 2025-2030 (%)
Data Table on Glass - Year-over-year growth 2025-2030 (%)

9.4 PET - Market size and forecast 2025-2030

Chart on PET - Market size and forecast 2025-2030 ($ million)
Data Table on PET - Market size and forecast 2025-2030 ($ million)
Chart on PET - Year-over-year growth 2025-2030 (%)
Data Table on PET - Year-over-year growth 2025-2030 (%)

9.5 TPU - Market size and forecast 2025-2030

Chart on TPU - Market size and forecast 2025-2030 ($ million)
Data Table on TPU - Market size and forecast 2025-2030 ($ million)
Chart on TPU - Year-over-year growth 2025-2030 (%)
Data Table on TPU - Year-over-year growth 2025-2030 (%)

9.6 Others - Market size and forecast 2025-2030

Chart on Others - Market size and forecast 2025-2030 ($ million)
Data Table on Others - Market size and forecast 2025-2030 ($ million)
Chart on Others - Year-over-year growth 2025-2030 (%)
Data Table on Others - Year-over-year growth 2025-2030 (%)

9.7 Market opportunity by Type

Market opportunity by Type ($ million)
Data Table on Market opportunity by Type ($ million)

10. Market Segmentation by Price Range

10.1 Market segments

Chart on Price Range - Market share 2025-2030 (%)
Data Table on Price Range - Market share 2025-2030 (%)

10.2 Comparison by Price Range

Chart on Comparison by Price Range
Data Table on Comparison by Price Range

10.3 Mid-range - Market size and forecast 2025-2030

Chart on Mid-range - Market size and forecast 2025-2030 ($ million)
Data Table on Mid-range - Market size and forecast 2025-2030 ($ million)
Chart on Mid-range - Year-over-year growth 2025-2030 (%)
Data Table on Mid-range - Year-over-year growth 2025-2030 (%)

10.4 Premium - Market size and forecast 2025-2030

Chart on Premium - Market size and forecast 2025-2030 ($ million)
Data Table on Premium - Market size and forecast 2025-2030 ($ million)
Chart on Premium - Year-over-year growth 2025-2030 (%)
Data Table on Premium - Year-over-year growth 2025-2030 (%)

10.5 Economy - Market size and forecast 2025-2030

Chart on Economy - Market size and forecast 2025-2030 ($ million)
Data Table on Economy - Market size and forecast 2025-2030 ($ million)
Chart on Economy - Year-over-year growth 2025-2030 (%)
Data Table on Economy - Year-over-year growth 2025-2030 (%)

10.6 Market opportunity by Price Range

Market opportunity by Price Range ($ million)
Data Table on Market opportunity by Price Range ($ million)

11. Market Segmentation by Product Type

11.1 Market segments

Chart on Product Type - Market share 2025-2030 (%)
Data Table on Product Type - Market share 2025-2030 (%)

11.2 Comparison by Product Type

Chart on Comparison by Product Type
Data Table on Comparison by Product Type

11.3 Two and half dimensional - Market size and forecast 2025-2030

Chart on Two and half dimensional - Market size and forecast 2025-2030 ($ million)
Data Table on Two and half dimensional - Market size and forecast 2025-2030 ($ million)
Chart on Two and half dimensional - Year-over-year growth 2025-2030 (%)
Data Table on Two and half dimensional - Year-over-year growth 2025-2030 (%)

11.4 Two dimensional - Market size and forecast 2025-2030

Chart on Two dimensional - Market size and forecast 2025-2030 ($ million)
Data Table on Two dimensional - Market size and forecast 2025-2030 ($ million)
Chart on Two dimensional - Year-over-year growth 2025-2030 (%)
Data Table on Two dimensional - Year-over-year growth 2025-2030 (%)

11.5 Three dimensional - Market size and forecast 2025-2030

Chart on Three dimensional - Market size and forecast 2025-2030 ($ million)
Data Table on Three dimensional - Market size and forecast 2025-2030 ($ million)
Chart on Three dimensional - Year-over-year growth 2025-2030 (%)
Data Table on Three dimensional - Year-over-year growth 2025-2030 (%)

11.6 Nine hardness tempered glass - Market size and forecast 2025-2030

Chart on Nine hardness tempered glass - Market size and forecast 2025-2030 ($ million)
Data Table on Nine hardness tempered glass - Market size and forecast 2025-2030 ($ million)
Chart on Nine hardness tempered glass - Year-over-year growth 2025-2030 (%)
Data Table on Nine hardness tempered glass - Year-over-year growth 2025-2030 (%)

11.7 Market opportunity by Product Type

Market opportunity by Product Type ($ million)
Data Table on Market opportunity by Product Type ($ million)

12. Customer Landscape

12.1 Customer landscape overview

Analysis of price sensitivity, lifecycle, customer purchase basket, adoption rates, and purchase criteria

13. Geographic Landscape

13.1 Geographic segmentation

Chart on Market share by geography 2025-2030 (%)
Data Table on Market share by geography 2025-2030 (%)

13.2 Geographic comparison

Chart on Geographic comparison
Data Table on Geographic comparison

13.3 APAC - Market size and forecast 2025-2030

Chart on APAC - Market size and forecast 2025-2030 ($ million)
Data Table on APAC - Market size and forecast 2025-2030 ($ million)
Chart on APAC - Year-over-year growth 2025-2030 (%)
Data Table on APAC - Year-over-year growth 2025-2030 (%)
Chart on Regional Comparison - APAC
Data Table on Regional Comparison - APAC

13.3.1 China - Market size and forecast 2025-2030

Chart on China - Market size and forecast 2025-2030 ($ million)
Data Table on China - Market size and forecast 2025-2030 ($ million)
Chart on China - Year-over-year growth 2025-2030 (%)
Data Table on China - Year-over-year growth 2025-2030 (%)

13.3.2 Japan - Market size and forecast 2025-2030

Chart on Japan - Market size and forecast 2025-2030 ($ million)
Data Table on Japan - Market size and forecast 2025-2030 ($ million)
Chart on Japan - Year-over-year growth 2025-2030 (%)
Data Table on Japan - Year-over-year growth 2025-2030 (%)

13.3.3 India - Market size and forecast 2025-2030

Chart on India - Market size and forecast 2025-2030 ($ million)
Data Table on India - Market size and forecast 2025-2030 ($ million)
Chart on India - Year-over-year growth 2025-2030 (%)
Data Table on India - Year-over-year growth 2025-2030 (%)

13.3.4 South Korea - Market size and forecast 2025-2030

Chart on South Korea - Market size and forecast 2025-2030 ($ million)
Data Table on South Korea - Market size and forecast 2025-2030 ($ million)
Chart on South Korea - Year-over-year growth 2025-2030 (%)
Data Table on South Korea - Year-over-year growth 2025-2030 (%)

13.3.5 Australia - Market size and forecast 2025-2030

Chart on Australia - Market size and forecast 2025-2030 ($ million)
Data Table on Australia - Market size and forecast 2025-2030 ($ million)
Chart on Australia - Year-over-year growth 2025-2030 (%)
Data Table on Australia - Year-over-year growth 2025-2030 (%)

13.3.6 Indonesia - Market size and forecast 2025-2030

Chart on Indonesia - Market size and forecast 2025-2030 ($ million)
Data Table on Indonesia - Market size and forecast 2025-2030 ($ million)
Chart on Indonesia - Year-over-year growth 2025-2030 (%)
Data Table on Indonesia - Year-over-year growth 2025-2030 (%)

13.4 North America - Market size and forecast 2025-2030

Chart on North America - Market size and forecast 2025-2030 ($ million)
Data Table on North America - Market size and forecast 2025-2030 ($ million)
Chart on North America - Year-over-year growth 2025-2030 (%)
Data Table on North America - Year-over-year growth 2025-2030 (%)
Chart on Regional Comparison - North America
Data Table on Regional Comparison - North America

13.4.1 US - Market size and forecast 2025-2030

Chart on US - Market size and forecast 2025-2030 ($ million)
Data Table on US - Market size and forecast 2025-2030 ($ million)
Chart on US - Year-over-year growth 2025-2030 (%)
Data Table on US - Year-over-year growth 2025-2030 (%)

13.4.2 Canada - Market size and forecast 2025-2030

Chart on Canada - Market size and forecast 2025-2030 ($ million)
Data Table on Canada - Market size and forecast 2025-2030 ($ million)
Chart on Canada - Year-over-year growth 2025-2030 (%)
Data Table on Canada - Year-over-year growth 2025-2030 (%)

13.4.3 Mexico - Market size and forecast 2025-2030

Chart on Mexico - Market size and forecast 2025-2030 ($ million)
Data Table on Mexico - Market size and forecast 2025-2030 ($ million)
Chart on Mexico - Year-over-year growth 2025-2030 (%)
Data Table on Mexico - Year-over-year growth 2025-2030 (%)

13.5 Europe - Market size and forecast 2025-2030

Chart on Europe - Market size and forecast 2025-2030 ($ million)
Data Table on Europe - Market size and forecast 2025-2030 ($ million)
Chart on Europe - Year-over-year growth 2025-2030 (%)
Data Table on Europe - Year-over-year growth 2025-2030 (%)
Chart on Regional Comparison - Europe
Data Table on Regional Comparison - Europe

13.5.1 Germany - Market size and forecast 2025-2030

Chart on Germany - Market size and forecast 2025-2030 ($ million)
Data Table on Germany - Market size and forecast 2025-2030 ($ million)
Chart on Germany - Year-over-year growth 2025-2030 (%)
Data Table on Germany - Year-over-year growth 2025-2030 (%)

13.5.2 UK - Market size and forecast 2025-2030

Chart on UK - Market size and forecast 2025-2030 ($ million)
Data Table on UK - Market size and forecast 2025-2030 ($ million)
Chart on UK - Year-over-year growth 2025-2030 (%)
Data Table on UK - Year-over-year growth 2025-2030 (%)

13.5.3 France - Market size and forecast 2025-2030

Chart on France - Market size and forecast 2025-2030 ($ million)
Data Table on France - Market size and forecast 2025-2030 ($ million)
Chart on France - Year-over-year growth 2025-2030 (%)
Data Table on France - Year-over-year growth 2025-2030 (%)

13.5.4 Italy - Market size and forecast 2025-2030

Chart on Italy - Market size and forecast 2025-2030 ($ million)
Data Table on Italy - Market size and forecast 2025-2030 ($ million)
Chart on Italy - Year-over-year growth 2025-2030 (%)
Data Table on Italy - Year-over-year growth 2025-2030 (%)

13.5.5 Spain - Market size and forecast 2025-2030

Chart on Spain - Market size and forecast 2025-2030 ($ million)
Data Table on Spain - Market size and forecast 2025-2030 ($ million)
Chart on Spain - Year-over-year growth 2025-2030 (%)
Data Table on Spain - Year-over-year growth 2025-2030 (%)

13.5.6 The Netherlands - Market size and forecast 2025-2030

Chart on The Netherlands - Market size and forecast 2025-2030 ($ million)
Data Table on The Netherlands - Market size and forecast 2025-2030 ($ million)
Chart on The Netherlands - Year-over-year growth 2025-2030 (%)
Data Table on The Netherlands - Year-over-year growth 2025-2030 (%)

13.6 South America - Market size and forecast 2025-2030

Chart on South America - Market size and forecast 2025-2030 ($ million)
Data Table on South America - Market size and forecast 2025-2030 ($ million)
Chart on South America - Year-over-year growth 2025-2030 (%)
Data Table on South America - Year-over-year growth 2025-2030 (%)
Chart on Regional Comparison - South America
Data Table on Regional Comparison - South America

13.6.1 Brazil - Market size and forecast 2025-2030

Chart on Brazil - Market size and forecast 2025-2030 ($ million)
Data Table on Brazil - Market size and forecast 2025-2030 ($ million)
Chart on Brazil - Year-over-year growth 2025-2030 (%)
Data Table on Brazil - Year-over-year growth 2025-2030 (%)

13.6.2 Argentina - Market size and forecast 2025-2030

Chart on Argentina - Market size and forecast 2025-2030 ($ million)
Data Table on Argentina - Market size and forecast 2025-2030 ($ million)
Chart on Argentina - Year-over-year growth 2025-2030 (%)
Data Table on Argentina - Year-over-year growth 2025-2030 (%)

13.6.3 Chile - Market size and forecast 2025-2030

Chart on Chile - Market size and forecast 2025-2030 ($ million)
Data Table on Chile - Market size and forecast 2025-2030 ($ million)
Chart on Chile - Year-over-year growth 2025-2030 (%)
Data Table on Chile - Year-over-year growth 2025-2030 (%)

13.7 Middle East and Africa - Market size and forecast 2025-2030

Chart on Middle East and Africa - Market size and forecast 2025-2030 ($ million)
Data Table on Middle East and Africa - Market size and forecast 2025-2030 ($ million)
Chart on Middle East and Africa - Year-over-year growth 2025-2030 (%)
Data Table on Middle East and Africa - Year-over-year growth 2025-2030 (%)
Chart on Regional Comparison - Middle East and Africa
Data Table on Regional Comparison - Middle East and Africa

13.7.1 Saudi Arabia - Market size and forecast 2025-2030

Chart on Saudi Arabia - Market size and forecast 2025-2030 ($ million)
Data Table on Saudi Arabia - Market size and forecast 2025-2030 ($ million)
Chart on Saudi Arabia - Year-over-year growth 2025-2030 (%)
Data Table on Saudi Arabia - Year-over-year growth 2025-2030 (%)

13.7.2 UAE - Market size and forecast 2025-2030

Chart on UAE - Market size and forecast 2025-2030 ($ million)
Data Table on UAE - Market size and forecast 2025-2030 ($ million)
Chart on UAE - Year-over-year growth 2025-2030 (%)
Data Table on UAE - Year-over-year growth 2025-2030 (%)

13.7.3 South Africa - Market size and forecast 2025-2030

Chart on South Africa - Market size and forecast 2025-2030 ($ million)
Data Table on South Africa - Market size and forecast 2025-2030 ($ million)
Chart on South Africa - Year-over-year growth 2025-2030 (%)
Data Table on South Africa - Year-over-year growth 2025-2030 (%)

13.7.4 Israel - Market size and forecast 2025-2030

Chart on Israel - Market size and forecast 2025-2030 ($ million)
Data Table on Israel - Market size and forecast 2025-2030 ($ million)
Chart on Israel - Year-over-year growth 2025-2030 (%)
Data Table on Israel - Year-over-year growth 2025-2030 (%)

13.7.5 Turkey - Market size and forecast 2025-2030

Chart on Turkey - Market size and forecast 2025-2030 ($ million)
Data Table on Turkey - Market size and forecast 2025-2030 ($ million)
Chart on Turkey - Year-over-year growth 2025-2030 (%)
Data Table on Turkey - Year-over-year growth 2025-2030 (%)

13.8 Market opportunity by geography

Market opportunity by geography ($ million)
Data Tables on Market opportunity by geography ($ million)

14. Drivers, Challenges, and Opportunity

14.1 Market drivers

Rising proliferation of high-end and premium mobile handsets
Technological advancements in protective materials and functional enhancements
Rapid growth of mobile connectivity and device financing

14.2 Market challenges

Proliferation of counterfeit products and brand dilution in high-growth emerging economies
Technical complexities and installation barriers posed by advanced display geometries
Macroeconomic volatility and erosion of consumer purchasing power

14.3 Impact of drivers and challenges

Impact of drivers and challenges in 2025 and 2030

14.4 Market opportunities

Integration of advanced antimicrobial and sustainable material science
Proliferation of privacy-enhancing technologies and specialized blue light filters
Enhanced customization and rise of on-demand retail cutting solutions

15. Competitive Landscape

15.1 Overview

15.2

Overview on criticality of inputs and factors of differentiation

15.3 Landscape disruption

Overview on factors of disruption

15.4 Industry risks

Impact of key risks on business

16. Competitive Analysis

16.1 Companies profiled

Companies covered

16.2 Company ranking index

16.3 Market positioning of companies

Matrix on companies position and classification

16.4 A Z Infolink Pvt. Ltd.

A Z Infolink Pvt. Ltd. - Overview
A Z Infolink Pvt. Ltd. - Product / Service
A Z Infolink Pvt. Ltd. - Key offerings
SWOT

16.5 AGC Inc.

AGC Inc. - Overview
AGC Inc. - Business segments
AGC Inc. - Key news
AGC Inc. - Key offerings
AGC Inc. - Segment focus
SWOT

16.6 Belkin International Inc.

Belkin International Inc. - Overview
Belkin International Inc. - Product / Service
Belkin International Inc. - Key offerings
SWOT

16.7 BGZ brands

BGZ brands - Overview
BGZ brands - Product / Service
BGZ brands - Key offerings
SWOT

16.8 Clarivue

Clarivue - Overview
Clarivue - Product / Service
Clarivue - Key offerings
SWOT

16.9 Corning Inc.

Corning Inc. - Overview
Corning Inc. - Business segments
Corning Inc. - Key offerings
Corning Inc. - Segment focus
SWOT

16.10 Mous Products Ltd.

Mous Products Ltd. - Overview
Mous Products Ltd. - Product / Service
Mous Products Ltd. - Key offerings
SWOT

16.11 New Vision Display Inc.

New Vision Display Inc. - Overview
New Vision Display Inc. - Product / Service
New Vision Display Inc. - Key offerings
SWOT

16.12 Nippon Electric Glass Ltd.

Nippon Electric Glass Ltd. - Overview
Nippon Electric Glass Ltd. - Product / Service
Nippon Electric Glass Ltd. - Key offerings
SWOT

16.13 SCHOTT AG

SCHOTT AG - Overview
SCHOTT AG - Product / Service
SCHOTT AG - Key offerings
SWOT

16.14 Spigen Inc.

Spigen Inc. - Overview
Spigen Inc. - Product / Service
Spigen Inc. - Key offerings
SWOT

16.15 Targus Inc.

Targus Inc. - Overview
Targus Inc. - Product / Service
Targus Inc. - Key offerings
SWOT

16.16 Urban Armor Gear LLC

Urban Armor Gear LLC - Overview
Urban Armor Gear LLC - Product / Service
Urban Armor Gear LLC - Key offerings
SWOT

16.17 WeProFab

WeProFab - Overview
WeProFab - Product / Service
WeProFab - Key offerings
SWOT

16.18 ZAGG Inc.

ZAGG Inc. - Overview
ZAGG Inc. - Product / Service
ZAGG Inc. - Key offerings
SWOT

17. Appendix

17.1 Scope of the report

Market definition
Objectives
Notes and caveats

17.2 Inclusions and exclusions checklist

Inclusions checklist
Exclusions checklist

17.3 Currency conversion rates for US$

17.4 Research methodology

17.5 Data procurement

Information sources

17.6 Data validation

17.7 Validation techniques employed for market sizing

17.8 Data synthesis

17.9 360 degree market analysis

17.10 List of abbreviations

Research Methodology

Technavio presents a detailed picture of the market by way of study, synthesis, and summation of data from multiple sources. The analysts have presented the various facets of the market with a particular focus on identifying the key industry influencers. The data thus presented is comprehensive, reliable, and the result of extensive research, both primary and secondary.

INFORMATION SOURCES

Primary sources

  • Manufacturers and suppliers
  • Channel partners
  • Industry experts
  • Strategic decision makers

Secondary sources

  • Industry journals and periodicals
  • Government data
  • Financial reports of key industry players
  • Historical data
  • Press releases

DATA ANALYSIS

Data Synthesis

  • Collation of data
  • Estimation of key figures
  • Analysis of derived insights

Data Validation

  • Triangulation with data models
  • Reference against proprietary databases
  • Corroboration with industry experts

REPORT WRITING

Qualitative

  • Market drivers
  • Market challenges
  • Market trends
  • Five forces analysis

Quantitative

  • Market size and forecast
  • Market segmentation
  • Geographical insights
  • Competitive landscape

Interested in this report?

Get your sample now to see our research methodology and insights!

Download Now

Frequently Asked Questions

Smartphone Screen Protector market growth will increase by USD 630.0 million during 2026-2030.

The Smartphone Screen Protector market is expected to grow at a CAGR of 6.4% during 2026-2030.

Smartphone Screen Protector market is segmented by Distribution channel (Offline, Online) Type (Glass, PET, TPU, Others) Price range (Mid-range, Premium, Economy) Product type (Two and half dimensional, Two dimensional, Three dimensional, Nine hardness tempered glass)

A Z Infolink Pvt. Ltd., AGC Inc., Belkin International Inc., BGZ brands, Clarivue, Corning Inc., FeYong Digital Technology Ltd., Mobile Phone Guard, Mous Products Ltd., New Vision Display Inc., Nippon Electric Glass Ltd., NuShield Inc., PanzerGlass AS, SCHOTT AG, ScreenShield, Spigen Inc., Targus Inc., Urban Armor Gear LLC, WeProFab, ZAGG Inc. are a few of the key vendors in the Smartphone Screen Protector market.

APAC will register the highest growth rate of 60.4% among the other regions. Therefore, the Smartphone Screen Protector market in APAC is expected to garner significant business opportunities for the vendors during the forecast period.

China, Japan, India, South Korea, Australia, Indonesia, US, Canada, Mexico, Germany, UK, France, Italy, Spain, The Netherlands, Brazil, Argentina, Chile, Saudi Arabia, UAE, South Africa, Israel, Turkey

  • Rising proliferation of high-end and premium mobile handsets is the driving factor this market.

The Smartphone Screen Protector market vendors should focus on grabbing business opportunities from the Distribution channel segment as it accounted for the largest market share in the base year.
RIA - Research AI Assistant
Ask RIA