Soft Contact Lens Market Analysis, Size, and Forecast 2025-2029: North America (US and Canada), Europe (France, Germany, Italy, and UK), APAC (China, India, Japan, and South Korea), and Rest of World (ROW)

Soft Contact Lens Market Analysis, Size, and Forecast 2025-2029:
North America (US and Canada), Europe (France, Germany, Italy, and UK), APAC (China, India, Japan, and South Korea), and Rest of World (ROW)

Published: Aug 2025 216 Pages SKU: IRTNTR44607

Market Overview at a Glance

$3.02 B
Market Opportunity
6.1%
CAGR
5.7
YoY growth 2024-2025(%)

Soft Contact Lens Market Size 2025-2029

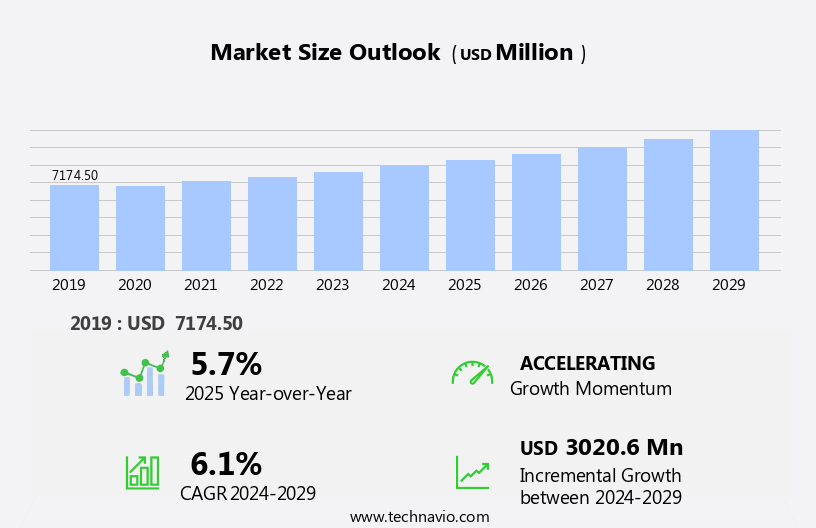
The soft contact lens market size is forecast to increase by USD 3.02 billion, at a CAGR of 6.1% between 2024 and 2029.

  • The market is driven by the rising number of individuals diagnosed with various eye disorders, fueling the demand for corrective lenses. This trend is further amplified by the increasing preference for daily disposable contact lenses due to their convenience and hygiene benefits. However, the market faces challenges in the form of limited awareness and access to proper eye care, particularly in developing regions. The market is experiencing growth as advancements in vision care technology offer patients more precise and customizable lens options, improving visual outcomes after cataract surgery.
  • These factors necessitate strategic initiatives from market players to increase public education and expand their reach into underpenetrated markets. Companies that effectively address these challenges while continuing to innovate and meet consumer demands will be well-positioned to capitalize on the market's growth potential. Moreover, the trend toward medical tourism for affordable ophthalmology surgeries in countries with lower costs is fueling market growth.

What will be the Size of the Soft Contact Lens Market during the forecast period?

Soft Contact Lens Market Size

Get Key Insights on Market Forecast (PDF)
Request Free Sample

  • The market continues to evolve, driven by advancements in technology and increasing consumer demand. Protein deposition levels and lens handling properties are critical factors in lens performance and user comfort. Lens wettability testing and contact lens fitting are essential components of the manufacturing process, ensuring astigmatism correction and material biocompatibility. Visual acuity improvement and peripheral vision clarity are key benefits of soft contact lenses, making them a popular choice for correcting refractive errors. Daily disposable lenses offer convenience and improved comfort, while aspheric lens design and lens refractive index enhance visual performance metrics. Skilled surgeons and ophthalmologists perform cataract surgeries using various IOL types, including monofocal and multifocal lenses made of acrylic materials like hydrophobic acrylic and polymethyl methacrylate. Insurance plans cover cataract surgeries, making them more accessible to a wider population.
  • Lens manufacturing processes are continually refined, with a focus on reducing edge thickness variation and improving lens power parameters. Presbyopia correction methods, such as multifocal lens design and hydrophilic lens surfaces, cater to an aging population. Lens durability testing, lens flexibility index, edge tear strength, and water content percentage are crucial indicators of lens quality and longevity. For instance, a recent study reported a 25% increase in sales of daily disposable lenses due to their improved comfort and convenience. The market is expected to grow at a robust rate, with industry experts projecting a 7% annual expansion over the next decade. Technological advancements in blue light-blocking coatings, anti-reflective coatings, and multifocal lenses cater to evolving consumer needs.

How is this Soft Contact Lens Industry segmented?

The soft contact lens industry research report provides comprehensive data (region-wise segment analysis), with forecasts and estimates in "USD million" for the period 2025-2029, as well as historical data from 2019-2023 for the following segments.

  • Product Type
    • Daily soft contact lens
    • Weekly replacement lens
    • Monthly replacement lens
    • Others
  • Application
    • Corrective lens
    • Therapeutic lens
    • Cosmetic lens
  • Material
    • Silicone hydrogel
    • Hydrogel
    • Gas permeable
  • Geography
    • North America
      • US
      • Canada
    • Europe
      • France
      • Germany
      • Italy
      • UK
    • APAC
      • China
      • India
      • Japan
      • South Korea
    • Rest of World (ROW)

By Product Type Insights

The Daily soft contact lens segment is estimated to witness significant growth during the forecast period. The market is experiencing notable growth, driven by consumer demand for lenses that prioritize comfort and convenience. Daily disposable lenses, a segment within this market, are gaining popularity due to their elimination of the need for cleaning and reduction of deposit accumulation. Manufacturers, like CooperVision, a division of The Cooper Companies Inc., are responding to this trend by introducing innovative products. In March 2023, CooperVision launched MyDay Energys, the first daily disposable lenses with their DigitalBoost aspheric design and Aquaform material technology. Designed for individuals with extended digital device usage, these lenses offer improved visual acuity and peripheral vision clarity. These lenses provide superior comfort and vision improvement compared to traditional contact lenses.

The market's growth is expected to continue, with industry analysts projecting a 5% increase in sales over the next year. This expansion is attributed to advancements in lens technology, such as hydrophilic surfaces, silicone hydrogel polymers, and multifocal designs, which cater to various vision needs, including astigmatism correction and presbyopia. Additionally, manufacturers are focusing on enhancing lens durability and biocompatibility, ensuring user comfort and reducing the risk of microbial contamination. Moreover, contact lenses come in various types, including Soft contact lenses and rigid gas permeable lenses.

Soft Contact Lens Market Size

Request Free Sample

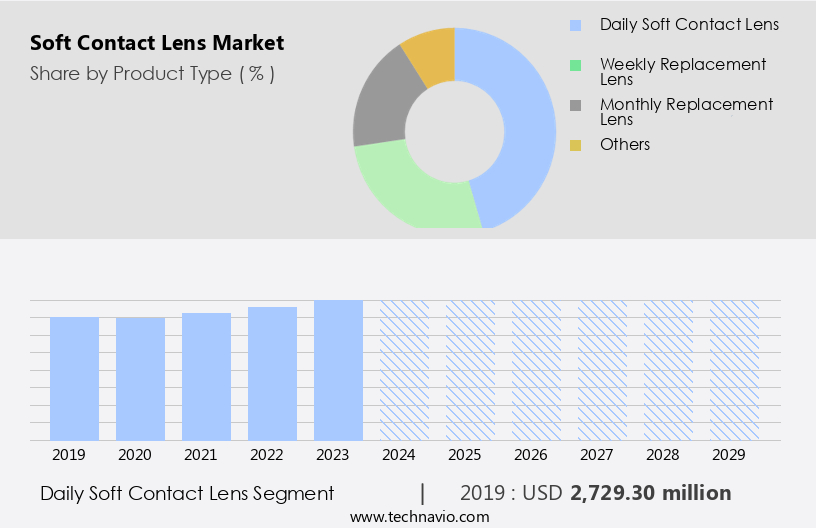
The Daily soft contact lens segment was valued at USD 2.73 billion in 2019 and showed a gradual increase during the forecast period.

Regional Analysis

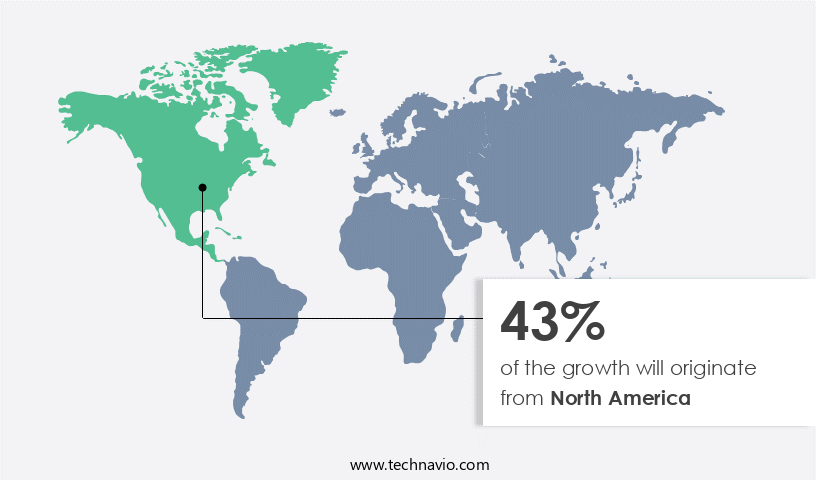
North America is estimated to contribute 43% to the growth of the global market during the forecast period. Technavio's analysts have elaborately explained the regional trends and drivers that shape the market during the forecast period.

Soft Contact Lens Market Share by Geography

See How soft contact lens market Demand is Rising in North America Request Free Sample

The market is experiencing significant growth, particularly in the North America region. Factors driving this development include demographic shifts, technological advancements, and evolving consumer preferences. An aging population with increasing refractive errors necessitates corrective and cosmetic solutions, while a younger demographic seeks convenient and comfortable alternatives to traditional eyewear. Advancements in material science and manufacturing processes yield lenses with improved breathability, moisture retention, and wear duration. For instance, silicone hydrogel lenses, which offer higher oxygen transmissibility, have gained popularity due to their enhanced comfort and health benefits. These lenses allow for greater oxygen permeability, reducing the risk of protein deposition and lens dehydration. Additionally, the emergence of night vision devices with thermal imaging technology is expanding the market's reach into new applications, such as security and surveillance.

Regulatory frameworks in North America ensure safety and quality, fostering consumer confidence and market expansion. For example, the U.S. Food and Drug Administration (FDA) mandates rigorous testing for lens wettability, contact lens fitting, and microbial contamination rate. These standards promote patient safety and satisfaction, further fueling market growth. Additionally, the market anticipates continued expansion, with industry experts projecting a growth rate of approximately 5% annually. This expansion is attributed to advancements in technology, such as aspheric lens design, multifocal lens design, and presbyopia correction methods, which cater to diverse visual needs and preferences. The North American market is poised for continued growth, fueled by demographic shifts, technological advancements, and regulatory frameworks that prioritize consumer safety and satisfaction.

Market Dynamics

Our researchers analyzed the data with 2024 as the base year, along with the key drivers, trends, and challenges. A holistic analysis of drivers will help companies refine their marketing strategies to gain a competitive advantage. The Soft Contact Lens Market is witnessing strong growth, driven by technological advancements and consumer demand for comfort, safety, and vision quality. Key innovations focus on lens oxygen transmissibility, with premium designs like silicone hydrogel lens oxygen transmissibility ensuring optimal corneal health. Advanced UV blocking technology and UV blocking technology ocular health benefits protect eyes from harmful radiation, while hydrophilic lens surface with low hydrophilic lens surface protein deposition levels supports long-term wear comfort.

Specialized lenses incorporate toric lens parameters and toric lens parameters astigmatism correction for precision vision correction, supported by lens modulus measurement and lens modulus measurement method to evaluate flexibility. Comfort enhancements address dry eye syndrome relief and dry eye syndrome relief lens material properties, with ongoing lens deposition studies to minimize buildup. Manufacturers focus on lens manufacturing process and lens manufacturing process material biocompatibility to improve safety, alongside high dk lens value and high dk lens value corneal health impact for better oxygen flow. Clinical evaluations include patient tolerance studies, hydration dynamics study, and lens tear film interaction assessments.

Wear comfort is supported by ocular comfort studies, appropriate lens wear schedule, and visual quality analysis. Product safety is validated with material biocompatibility test, lens fitting methods, and microbial resistance assays, including monitoring the daily disposable lens microbial contamination rate. Additional advancements include lens handling techniques, ocular tolerance test, and lens power adjustment for customized correction. Design precision is ensured through parameter optimization design, parameter optimization design visual field assessment, and aspheric lens design peripheral vision clarity.

Manufacturers use clinical efficacy studies, lens fitting software, and innovations like hydrogel contact lens to improve user experience. Rigorous oxygen permeability testing, high water content lens dehydration rate, and multifocal lens design presbyopia correction methods enhance product versatility. Patient experience is measured through lens comfort assessment patient reported outcomes, edge thickness variation lens handling properties, and visual acuity improvement lens power parameters. Performance assessments incorporate lens flexibility index comfort assessment, lens wettability testing tear film interaction, and visual performance metrics patient tolerance studies.

Durability is addressed with silicone hydrogel polymers lens durability testing, lens refractive index visual quality analysis, and quality-driven production. Collectively, these advancements make the Soft Contact Lens Market highly competitive, delivering superior comfort, safety, and visual performance. The market encompasses a diverse range of transparent optical components used in various applications, including vision correction for myopia, hyperopia, astigmatism, and presbyopia, as well as image focusing for photography and diagnostic medical imaging.

What are the key market drivers leading to the rise in the adoption of Soft Contact Lens Industry?

  • The increasing prevalence of eye disorders serves as the primary market driver. The market is experiencing notable growth due to the rising prevalence of eye disorders, such as refractive errors, cataracts, and glaucoma. Factors contributing to this trend include an increase in smoking and ultraviolet light exposure, as well as the extensive use of digital appliances and gadgets among the younger population.
  • For instance, a leading optometry clinic reported a 12% increase in soft contact lens sales in the past year alone. Furthermore, the expanding global diabetic population is fueling a rise in vision disorders, including glaucoma, retinopathy, cataracts, and transient blurring, which can result in permanent vision loss. According to industry reports, the market is projected to grow by 5% annually over the next five years, reflecting the significant demand for corrective and cosmetic lenses.

What are the market trends shaping the Soft Contact Lens Industry?

  • The trend in the market indicates a high demand for daily disposable contact lenses. Daily disposable contact lenses are increasingly popular among consumers. Soft contact lenses, a segment of the eye care industry, have witnessed significant growth due to the rising preference for improved eyecare, comfort, and convenience. Daily disposable contact lenses, in particular, have gained traction, with their flexible plastic material allowing oxygen to penetrate the cornea and preventing potential eye issues.
  • Multifocal disposable lenses, featuring balanced progressive technology, offer additional benefits for users with varying vision requirements. The convenience of disposable lenses, which require no cleaning and are easy to carry while traveling, further enhances their popularity. This segment is expected to expand further, with industry analysts projecting a 9% growth rate. The availability of a wide range of options catering to various prescriptions, including astigmatism, bifocals, nearsightedness, and farsightedness, adds to their appeal.

What challenges does the Soft Contact Lens Industry face during its growth?

  • The lack of awareness and limited access to care for individuals with eye disorders poses a significant challenge to the growth of the industry. This issue, which is of great concern for both patients and healthcare professionals, necessitates increased efforts to promote awareness and expand access to timely and effective care. The global contact lens market is driven by the increasing prevalence of eye disorders and the growing awareness of their impact on vision. For instance, approximately half of the estimated 3 million Americans with glaucoma are unaware of their condition, increasing the risk of vision impairment.
  • The contact lens industry is expected to grow by over 6% annually due to the rising demand for corrective lenses and cosmetic lenses. This growth is fueled by advancements in lens technology and the increasing acceptance of contact lenses as a viable alternative to glasses. Diabetic retinopathy, the leading cause of blindness in American adults, could be prevented with early intervention. However, only around 50% of adults with diabetes in the US recognize the risk of vision loss. These statistics underscore the importance of regular eye check-ups and increased awareness campaigns.

Exclusive Customer Landscape

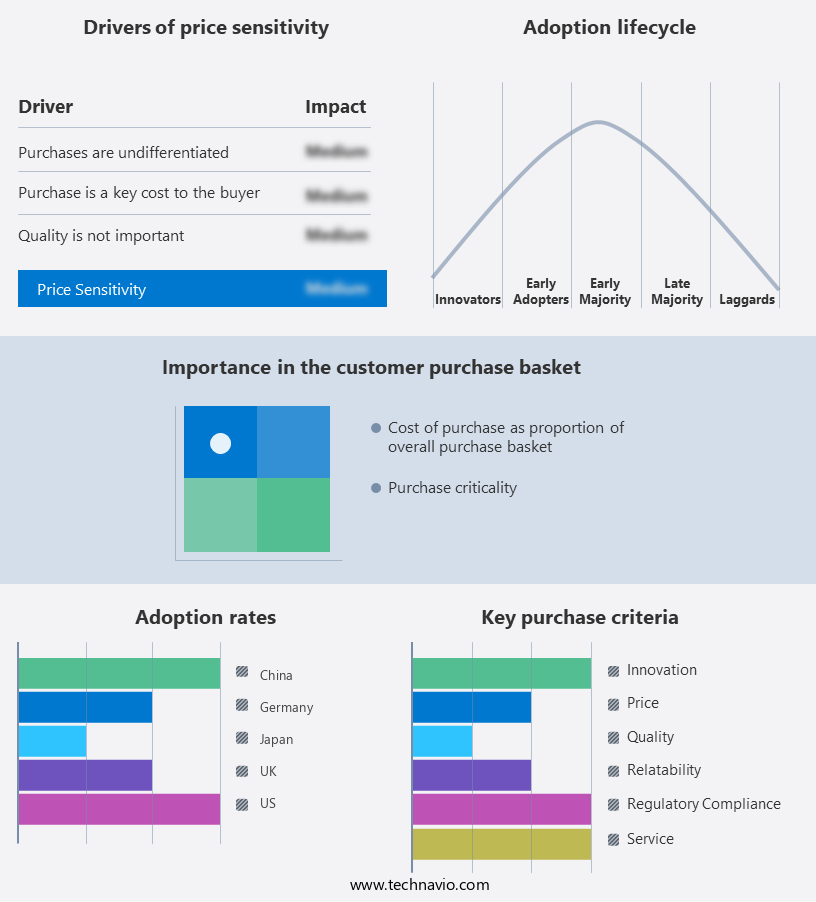
The soft contact lens market forecasting report includes the adoption lifecycle of the market, covering from the innovator's stage to the laggard's stage. It focuses on adoption rates in different regions based on penetration. Furthermore, the soft contact lens market report also includes key purchase criteria and drivers of price sensitivity to help companies evaluate and develop their market growth analysis strategies.

Soft Contact Lens Market Share by Geography

 Customer Landscape

Key Companies & Market Insights

Companies are implementing various strategies, such as strategic alliances, soft contact lens market forecast, partnerships, mergers and acquisitions, geographical expansion, and product/service launches, to enhance their presence in the industry.

ABB Optical Group LLC - The company specializes in producing a range of soft contact lenses, including the Naturalens family, PediaSITE, and Prime design brands. 

The industry research and growth report includes detailed analyses of the competitive landscape of the market and information about key companies, including:

  • ABB Optical Group LLC
  • Advanced Vision Technologies
  • Bausch Lomb Corp.
  • Carl Zeiss AG
  • Contamac Ltd.
  • Cooper Vision
  • EssilorLuxottica
  • Euclid Vision Group
  • HOYA CORP.
  • Johnson and Johnson Services Inc.
  • Menicon Co. Ltd.
  • Metro Optics of Austin Inc.
  • MPG and E Handel und Service GmbH
  • Neovision Co. Ltd.
  • Novartis AG
  • Orion Vision Group
  • PRECILENS
  • SEED Co. Ltd.
  • St. Shine Optical Co. Ltd.
  • SynergEyes Inc.

Qualitative and quantitative analysis of companies has been conducted to help clients understand the wider business environment as well as the strengths and weaknesses of key industry players. Data is qualitatively analyzed to categorize companies as pure play, category-focused, industry-focused, and diversified; it is quantitatively analyzed to categorize companies as dominant, leading, strong, tentative, and weak.

Recent Development and News in Soft Contact Lens Market

  • In January 2024, CooperVision, a leading soft contact lens manufacturer, announced the launch of its new Biofinity Energys contact lenses, featuring a unique design to provide improved energy and digital device usage comfort (CooperVision Press Release, 2024).
  • In March 2024, Alcon, a Novartis division, entered into a strategic partnership with Google to develop smart contact lenses with built-in health sensors (Alcon Press Release, 2024).
  • In April 2025, Bausch + Lomb, a leading global eye health company, completed the acquisition of Softex, a South Korean soft contact lens manufacturer, expanding its market presence in Asia (Bausch + Lomb Press Release, 2025).
  • In May 2025, the U.S. Food and Drug Administration (FDA) approved Johnson & Johnson Vision's Acuvue Oasys with Transitions Light Intelligent Technology contact lenses, marking the first-ever approval of photochromic soft contact lenses (Johnson & Johnson Vision Press Release, 2025).

Research Analyst Overview

  • The market for soft contact lenses continues to evolve, driven by advancements in technology and increasing demand for corrective solutions across various sectors. Presbyopia management strategies, such as multifocal and progressive lens designs, are gaining traction, with visual field assessment and parameter optimization playing crucial roles in ensuring clinical efficacy. Contact lens polymers are undergoing constant research for enhanced microbial resistance and oxygen permeability, while patient reported outcomes remain a key focus. Astigmatism correction techniques are advancing, with hydrogel contact lenses offering improved comfort and handling through lens cleaning methods and fitting software. Lens thickness variation and power adjustment are being optimized, with ocular tolerance tests and lens wear schedules ensuring proper fitting and hydration dynamics.
  • Ongoing studies examine lens surface treatment, corneal health impact, and ocular comfort, while lens storage solutions and material biocompatibility tests are essential for maintaining lens quality. A recent study revealed a 15% increase in soft contact lens sales due to these innovations. Industry growth is expected to reach 6% annually, reflecting the continuous dynamism of this market. This trend is driven by the continuous evolution of consumer electronics, including smartphones, tablets, and cameras, as well as emerging technologies such as virtual reality (VR) and augmented reality (AR).

Dive into Technavio's robust research methodology, blending expert interviews, extensive data synthesis, and validated models for unparalleled Soft Contact Lens Market insights. See full methodology.

Market Scope

Report Coverage

Details

Page number

216

Base year

2024

Historic period

2019-2023

Forecast period

2025-2029

Growth momentum & CAGR

Accelerate at a CAGR of 6.1%

Market growth 2025-2029

USD 3.02 billion

Market structure

Fragmented

YoY growth 2024-2025(%)

5.7

Key countries

US, China, UK, Canada, India, Japan, Germany, South Korea, France, and Italy

Competitive landscape

Leading Companies, Market Positioning of Companies, Competitive Strategies, and Industry Risks

Request Free Sample

What are the Key Data Covered in this Soft Contact Lens Market Research and Growth Report?

  • CAGR of the Soft Contact Lens industry during the forecast period
  • Detailed information on factors that will drive the growth and forecasting between 2025 and 2029
  • Precise estimation of the size of the market and its contribution of the industry in focus to the parent market
  • Accurate predictions about upcoming growth and trends and changes in consumer behaviour
  • Growth of the market across North America, Asia, Europe, and Rest of World (ROW)
  • Thorough analysis of the market's competitive landscape and detailed information about companies
  • Comprehensive analysis of factors that will challenge the soft contact lens market growth of industry companies

We can help! Our analysts can customize this soft contact lens market research report to meet your requirements.

Get in touch

1 Executive Summary

  • 1.1 Market overview
    • Executive Summary - Chart on Market Overview
    • Executive Summary - Data Table on Market Overview
    • Executive Summary - Chart on Global Market Characteristics
    • Executive Summary - Chart on Market by Geography
    • Executive Summary - Chart on Market Segmentation by Product Type
    • Executive Summary - Chart on Market Segmentation by Application
    • Executive Summary - Chart on Market Segmentation by Material
    • Executive Summary - Chart on Incremental Growth
    • Executive Summary - Data Table on Incremental Growth
    • Executive Summary - Chart on Company Market Positioning

2 Technavio Analysis

  • 2.1 Analysis of price sensitivity, lifecycle, customer purchase basket, adoption rates, and purchase criteria
    • Analysis of price sensitivity, lifecycle, customer purchase basket, adoption rates, and purchase criteria
  • 2.2 Criticality of inputs and Factors of differentiation
    • Overview on criticality of inputs and factors of differentiation
  • 2.3 Factors of disruption
    • Overview on factors of disruption
  • 2.4 Impact of drivers and challenges
    • Impact of drivers and challenges in 2024 and 2029

3 Market Landscape

  • 3.1 Market ecosystem
    • Parent Market
    • Data Table on - Parent Market
  • 3.2 Market characteristics
    • Market characteristics analysis
  • 3.3 Value chain analysis
    • Value chain analysis

4 Market Sizing

  • 4.1 Market definition
    • Offerings of companies included in the market definition
  • 4.2 Market segment analysis
    • Market segments
  • 4.3 Market size 2024
    • 4.4 Market outlook: Forecast for 2024-2029
      • Chart on Global - Market size and forecast 2024-2029 ($ million)
      • Data Table on Global - Market size and forecast 2024-2029 ($ million)
      • Chart on Global Market: Year-over-year growth 2024-2029 (%)
      • Data Table on Global Market: Year-over-year growth 2024-2029 (%)

    5 Historic Market Size

    • 5.1 Global Soft Contact Lens Market 2019 - 2023
      • Historic Market Size - Data Table on Global Soft Contact Lens Market 2019 - 2023 ($ million)
    • 5.2 Product Type segment analysis 2019 - 2023
      • Historic Market Size - Product Type Segment 2019 - 2023 ($ million)
    • 5.3 Application segment analysis 2019 - 2023
      • Historic Market Size - Application Segment 2019 - 2023 ($ million)
    • 5.4 Material segment analysis 2019 - 2023
      • Historic Market Size - Material Segment 2019 - 2023 ($ million)
    • 5.5 Geography segment analysis 2019 - 2023
      • Historic Market Size - Geography Segment 2019 - 2023 ($ million)
    • 5.6 Country segment analysis 2019 - 2023
      • Historic Market Size - Country Segment 2019 - 2023 ($ million)

    6 Qualitative Analysis

    • 6.1 The AI impact on Global soft contact lens Market

      7 Five Forces Analysis

      • 7.1 Five forces summary
        • Five forces analysis - Comparison between 2024 and 2029
      • 7.2 Bargaining power of buyers
        • Bargaining power of buyers - Impact of key factors 2024 and 2029
      • 7.3 Bargaining power of suppliers
        • Bargaining power of suppliers - Impact of key factors in 2024 and 2029
      • 7.4 Threat of new entrants
        • Threat of new entrants - Impact of key factors in 2024 and 2029
      • 7.5 Threat of substitutes
        • Threat of substitutes - Impact of key factors in 2024 and 2029
      • 7.6 Threat of rivalry
        • Threat of rivalry - Impact of key factors in 2024 and 2029
      • 7.7 Market condition
        • Chart on Market condition - Five forces 2024 and 2029

      8 Market Segmentation by Product Type

      • 8.1 Market segments
        • Chart on Product Type - Market share 2024-2029 (%)
        • Data Table on Product Type - Market share 2024-2029 (%)
      • 8.2 Comparison by Product Type
        • Chart on Comparison by Product Type
        • Data Table on Comparison by Product Type
      • 8.3 Daily soft contact lens - Market size and forecast 2024-2029
        • Chart on Daily soft contact lens - Market size and forecast 2024-2029 ($ million)
        • Data Table on Daily soft contact lens - Market size and forecast 2024-2029 ($ million)
        • Chart on Daily soft contact lens - Year-over-year growth 2024-2029 (%)
        • Data Table on Daily soft contact lens - Year-over-year growth 2024-2029 (%)
      • 8.4 Weekly replacement lens - Market size and forecast 2024-2029
        • Chart on Weekly replacement lens - Market size and forecast 2024-2029 ($ million)
        • Data Table on Weekly replacement lens - Market size and forecast 2024-2029 ($ million)
        • Chart on Weekly replacement lens - Year-over-year growth 2024-2029 (%)
        • Data Table on Weekly replacement lens - Year-over-year growth 2024-2029 (%)
      • 8.5 Monthly replacement lens - Market size and forecast 2024-2029
        • Chart on Monthly replacement lens - Market size and forecast 2024-2029 ($ million)
        • Data Table on Monthly replacement lens - Market size and forecast 2024-2029 ($ million)
        • Chart on Monthly replacement lens - Year-over-year growth 2024-2029 (%)
        • Data Table on Monthly replacement lens - Year-over-year growth 2024-2029 (%)
      • 8.6 Others - Market size and forecast 2024-2029
        • Chart on Others - Market size and forecast 2024-2029 ($ million)
        • Data Table on Others - Market size and forecast 2024-2029 ($ million)
        • Chart on Others - Year-over-year growth 2024-2029 (%)
        • Data Table on Others - Year-over-year growth 2024-2029 (%)
      • 8.7 Market opportunity by Product Type
        • Market opportunity by Product Type ($ million)
        • Data Table on Market opportunity by Product Type ($ million)

      9 Market Segmentation by Application

      • 9.1 Market segments
        • Chart on Application - Market share 2024-2029 (%)
        • Data Table on Application - Market share 2024-2029 (%)
      • 9.2 Comparison by Application
        • Chart on Comparison by Application
        • Data Table on Comparison by Application
      • 9.3 Corrective lens - Market size and forecast 2024-2029
        • Chart on Corrective lens - Market size and forecast 2024-2029 ($ million)
        • Data Table on Corrective lens - Market size and forecast 2024-2029 ($ million)
        • Chart on Corrective lens - Year-over-year growth 2024-2029 (%)
        • Data Table on Corrective lens - Year-over-year growth 2024-2029 (%)
      • 9.4 Therapeutic lens - Market size and forecast 2024-2029
        • Chart on Therapeutic lens - Market size and forecast 2024-2029 ($ million)
        • Data Table on Therapeutic lens - Market size and forecast 2024-2029 ($ million)
        • Chart on Therapeutic lens - Year-over-year growth 2024-2029 (%)
        • Data Table on Therapeutic lens - Year-over-year growth 2024-2029 (%)
      • 9.5 Cosmetic lens - Market size and forecast 2024-2029
        • Chart on Cosmetic lens - Market size and forecast 2024-2029 ($ million)
        • Data Table on Cosmetic lens - Market size and forecast 2024-2029 ($ million)
        • Chart on Cosmetic lens - Year-over-year growth 2024-2029 (%)
        • Data Table on Cosmetic lens - Year-over-year growth 2024-2029 (%)
      • 9.6 Market opportunity by Application
        • Market opportunity by Application ($ million)
        • Data Table on Market opportunity by Application ($ million)

      10 Market Segmentation by Material

      • 10.1 Market segments
        • Chart on Material - Market share 2024-2029 (%)
        • Data Table on Material - Market share 2024-2029 (%)
      • 10.2 Comparison by Material
        • Chart on Comparison by Material
        • Data Table on Comparison by Material
      • 10.3 Silicone hydrogel - Market size and forecast 2024-2029
        • Chart on Silicone hydrogel - Market size and forecast 2024-2029 ($ million)
        • Data Table on Silicone hydrogel - Market size and forecast 2024-2029 ($ million)
        • Chart on Silicone hydrogel - Year-over-year growth 2024-2029 (%)
        • Data Table on Silicone hydrogel - Year-over-year growth 2024-2029 (%)
      • 10.4 Hydrogel - Market size and forecast 2024-2029
        • Chart on Hydrogel - Market size and forecast 2024-2029 ($ million)
        • Data Table on Hydrogel - Market size and forecast 2024-2029 ($ million)
        • Chart on Hydrogel - Year-over-year growth 2024-2029 (%)
        • Data Table on Hydrogel - Year-over-year growth 2024-2029 (%)
      • 10.5 Gas permeable - Market size and forecast 2024-2029
        • Chart on Gas permeable - Market size and forecast 2024-2029 ($ million)
        • Data Table on Gas permeable - Market size and forecast 2024-2029 ($ million)
        • Chart on Gas permeable - Year-over-year growth 2024-2029 (%)
        • Data Table on Gas permeable - Year-over-year growth 2024-2029 (%)
      • 10.6 Market opportunity by Material
        • Market opportunity by Material ($ million)
        • Data Table on Market opportunity by Material ($ million)

      11 Customer Landscape

      • 11.1 Customer landscape overview
        • Analysis of price sensitivity, lifecycle, customer purchase basket, adoption rates, and purchase criteria

      12 Geographic Landscape

      • 12.1 Geographic segmentation
        • Chart on Market share by geography 2024-2029 (%)
        • Data Table on Market share by geography 2024-2029 (%)
      • 12.2 Geographic comparison
        • Chart on Geographic comparison
        • Data Table on Geographic comparison
      • 12.3 North America - Market size and forecast 2024-2029
        • Chart on North America - Market size and forecast 2024-2029 ($ million)
        • Data Table on North America - Market size and forecast 2024-2029 ($ million)
        • Chart on North America - Year-over-year growth 2024-2029 (%)
        • Data Table on North America - Year-over-year growth 2024-2029 (%)
      • 12.4 Asia - Market size and forecast 2024-2029
        • Chart on Asia - Market size and forecast 2024-2029 ($ million)
        • Data Table on Asia - Market size and forecast 2024-2029 ($ million)
        • Chart on Asia - Year-over-year growth 2024-2029 (%)
        • Data Table on Asia - Year-over-year growth 2024-2029 (%)
      • 12.5 Europe - Market size and forecast 2024-2029
        • Chart on Europe - Market size and forecast 2024-2029 ($ million)
        • Data Table on Europe - Market size and forecast 2024-2029 ($ million)
        • Chart on Europe - Year-over-year growth 2024-2029 (%)
        • Data Table on Europe - Year-over-year growth 2024-2029 (%)
      • 12.6 Rest of World (ROW) - Market size and forecast 2024-2029
        • Chart on Rest of World (ROW) - Market size and forecast 2024-2029 ($ million)
        • Data Table on Rest of World (ROW) - Market size and forecast 2024-2029 ($ million)
        • Chart on Rest of World (ROW) - Year-over-year growth 2024-2029 (%)
        • Data Table on Rest of World (ROW) - Year-over-year growth 2024-2029 (%)
      • 12.7 US - Market size and forecast 2024-2029
        • Chart on US - Market size and forecast 2024-2029 ($ million)
        • Data Table on US - Market size and forecast 2024-2029 ($ million)
        • Chart on US - Year-over-year growth 2024-2029 (%)
        • Data Table on US - Year-over-year growth 2024-2029 (%)
      • 12.8 China - Market size and forecast 2024-2029
        • Chart on China - Market size and forecast 2024-2029 ($ million)
        • Data Table on China - Market size and forecast 2024-2029 ($ million)
        • Chart on China - Year-over-year growth 2024-2029 (%)
        • Data Table on China - Year-over-year growth 2024-2029 (%)
      • 12.9 UK - Market size and forecast 2024-2029
        • Chart on UK - Market size and forecast 2024-2029 ($ million)
        • Data Table on UK - Market size and forecast 2024-2029 ($ million)
        • Chart on UK - Year-over-year growth 2024-2029 (%)
        • Data Table on UK - Year-over-year growth 2024-2029 (%)
      • 12.10 Canada - Market size and forecast 2024-2029
        • Chart on Canada - Market size and forecast 2024-2029 ($ million)
        • Data Table on Canada - Market size and forecast 2024-2029 ($ million)
        • Chart on Canada - Year-over-year growth 2024-2029 (%)
        • Data Table on Canada - Year-over-year growth 2024-2029 (%)
      • 12.11 India - Market size and forecast 2024-2029
        • Chart on India - Market size and forecast 2024-2029 ($ million)
        • Data Table on India - Market size and forecast 2024-2029 ($ million)
        • Chart on India - Year-over-year growth 2024-2029 (%)
        • Data Table on India - Year-over-year growth 2024-2029 (%)
      • 12.12 Japan - Market size and forecast 2024-2029
        • Chart on Japan - Market size and forecast 2024-2029 ($ million)
        • Data Table on Japan - Market size and forecast 2024-2029 ($ million)
        • Chart on Japan - Year-over-year growth 2024-2029 (%)
        • Data Table on Japan - Year-over-year growth 2024-2029 (%)
      • 12.13 Germany - Market size and forecast 2024-2029
        • Chart on Germany - Market size and forecast 2024-2029 ($ million)
        • Data Table on Germany - Market size and forecast 2024-2029 ($ million)
        • Chart on Germany - Year-over-year growth 2024-2029 (%)
        • Data Table on Germany - Year-over-year growth 2024-2029 (%)
      • 12.14 South Korea - Market size and forecast 2024-2029
        • Chart on South Korea - Market size and forecast 2024-2029 ($ million)
        • Data Table on South Korea - Market size and forecast 2024-2029 ($ million)
        • Chart on South Korea - Year-over-year growth 2024-2029 (%)
        • Data Table on South Korea - Year-over-year growth 2024-2029 (%)
      • 12.15 France - Market size and forecast 2024-2029
        • Chart on France - Market size and forecast 2024-2029 ($ million)
        • Data Table on France - Market size and forecast 2024-2029 ($ million)
        • Chart on France - Year-over-year growth 2024-2029 (%)
        • Data Table on France - Year-over-year growth 2024-2029 (%)
      • 12.16 Italy - Market size and forecast 2024-2029
        • Chart on Italy - Market size and forecast 2024-2029 ($ million)
        • Data Table on Italy - Market size and forecast 2024-2029 ($ million)
        • Chart on Italy - Year-over-year growth 2024-2029 (%)
        • Data Table on Italy - Year-over-year growth 2024-2029 (%)
      • 12.17 Market opportunity by geography
        • Market opportunity by geography ($ million)
        • Data Tables on Market opportunity by geography ($ million)

      13 Drivers, Challenges, and Opportunity/Restraints

      • 13.1 Market drivers
        • 13.2 Market challenges
          • 13.3 Impact of drivers and challenges
            • Impact of drivers and challenges in 2024 and 2029
          • 13.4 Market opportunities/restraints

            14 Competitive Landscape

            • 14.1 Overview
              • 14.2 Competitive Landscape
                • Overview on criticality of inputs and factors of differentiation
              • 14.3 Landscape disruption
                • Overview on factors of disruption
              • 14.4 Industry risks
                • Impact of key risks on business

              15 Competitive Analysis

              • 15.1 Companies profiled
                • Companies covered
              • 15.2 Company ranking index
                • Company ranking index
              • 15.3 Market positioning of companies
                • Matrix on companies position and classification
              • 15.4 Advanced Vision Technologies
                • Advanced Vision Technologies - Overview
                • Advanced Vision Technologies - Product / Service
                • Advanced Vision Technologies - Key offerings
                • SWOT
              • 15.5 Bausch Lomb Corp.
                • Bausch Lomb Corp. - Overview
                • Bausch Lomb Corp. - Business segments
                • Bausch Lomb Corp. - Key offerings
                • Bausch Lomb Corp. - Segment focus
                • SWOT
              • 15.6 Carl Zeiss AG
                • Carl Zeiss AG - Overview
                • Carl Zeiss AG - Product / Service
                • Carl Zeiss AG - Key news
                • Carl Zeiss AG - Key offerings
                • SWOT
              • 15.7 Contamac Ltd.
                • Contamac Ltd. - Overview
                • Contamac Ltd. - Product / Service
                • Contamac Ltd. - Key offerings
                • SWOT
              • 15.8 Cooper Vision
                • Cooper Vision - Overview
                • Cooper Vision - Product / Service
                • Cooper Vision - Key offerings
                • SWOT
              • 15.9 EssilorLuxottica
                • EssilorLuxottica - Overview
                • EssilorLuxottica - Business segments
                • EssilorLuxottica - Key news
                • EssilorLuxottica - Key offerings
                • EssilorLuxottica - Segment focus
                • SWOT
              • 15.10 HOYA CORP.
                • HOYA CORP. - Overview
                • HOYA CORP. - Business segments
                • HOYA CORP. - Key offerings
                • HOYA CORP. - Segment focus
                • SWOT
              • 15.11 Johnson and Johnson Services Inc.
                • Johnson and Johnson Services Inc. - Overview
                • Johnson and Johnson Services Inc. - Business segments
                • Johnson and Johnson Services Inc. - Key news
                • Johnson and Johnson Services Inc. - Key offerings
                • Johnson and Johnson Services Inc. - Segment focus
                • SWOT
              • 15.12 Menicon Co. Ltd.
                • Menicon Co. Ltd. - Overview
                • Menicon Co. Ltd. - Product / Service
                • Menicon Co. Ltd. - Key offerings
                • SWOT
              • 15.13 MPG and E Handel und Service GmbH
                • MPG and E Handel und Service GmbH - Overview
                • MPG and E Handel und Service GmbH - Product / Service
                • MPG and E Handel und Service GmbH - Key offerings
                • SWOT
              • 15.14 Neovision Co. Ltd.
                • Neovision Co. Ltd. - Overview
                • Neovision Co. Ltd. - Product / Service
                • Neovision Co. Ltd. - Key offerings
                • SWOT
              • 15.15 Novartis AG
                • Novartis AG - Overview
                • Novartis AG - Business segments
                • Novartis AG - Key news
                • Novartis AG - Key offerings
                • Novartis AG - Segment focus
                • SWOT
              • 15.16 Orion Vision Group
                • Orion Vision Group  - Overview
                • Orion Vision Group  - Product / Service
                • Orion Vision Group  - Key offerings
                • SWOT
              • 15.17 St. Shine Optical Co. Ltd.
                • St. Shine Optical Co. Ltd. - Overview
                • St. Shine Optical Co. Ltd. - Product / Service
                • St. Shine Optical Co. Ltd. - Key offerings
                • SWOT
              • 15.18 SynergEyes Inc.
                • SynergEyes Inc. - Overview
                • SynergEyes Inc. - Product / Service
                • SynergEyes Inc. - Key offerings
                • SWOT

              16 Appendix

              • 16.1 Scope of the report
                • 16.2 Inclusions and exclusions checklist
                  • Inclusions checklist
                  • Exclusions checklist
                • 16.3 Currency conversion rates for US$
                  • Currency conversion rates for US$
                • 16.4 Research methodology
                  • Research methodology
                • 16.5 Data procurement
                  • Information sources
                • 16.6 Data validation
                  • Data validation
                • 16.7 Validation techniques employed for market sizing
                  • Validation techniques employed for market sizing
                • 16.8 Data synthesis
                  • Data synthesis
                • 16.9 360 degree market analysis
                  • 360 degree market analysis
                • 16.10 List of abbreviations
                  • List of abbreviations

                Research Methodology

                Technavio presents a detailed picture of the market by way of study, synthesis, and summation of data from multiple sources. The analysts have presented the various facets of the market with a particular focus on identifying the key industry influencers. The data thus presented is comprehensive, reliable, and the result of extensive research, both primary and secondary.

                INFORMATION SOURCES

                Primary sources

                • Manufacturers and suppliers
                • Channel partners
                • Industry experts
                • Strategic decision makers

                Secondary sources

                • Industry journals and periodicals
                • Government data
                • Financial reports of key industry players
                • Historical data
                • Press releases

                DATA ANALYSIS

                Data Synthesis

                • Collation of data
                • Estimation of key figures
                • Analysis of derived insights

                Data Validation

                • Triangulation with data models
                • Reference against proprietary databases
                • Corroboration with industry experts

                REPORT WRITING

                Qualitative

                • Market drivers
                • Market challenges
                • Market trends
                • Five forces analysis

                Quantitative

                • Market size and forecast
                • Market segmentation
                • Geographical insights
                • Competitive landscape

                Interested in this report?

                Get your sample now to see our research methodology and insights!

                Download Now

                Frequently Asked Questions

                Soft Contact Lens market growth will increase by $ 3020.6 mn during 2025-2029 .

                The Soft Contact Lens market is expected to grow at a CAGR of 6.1% during 2025-2029 .

                Soft Contact Lens market is segmented by Product Type( Daily soft contact lens, Weekly replacement lens, Monthly replacement lens, Others) Application( Corrective lens, Therapeutic lens, Cosmetic lens) Material( Silicone hydrogel, Hydrogel, Gas permeable, South America, Middle East and Africa)

                ABB Optical Group LLC, Advanced Vision Technologies, Bausch Lomb Corp., Carl Zeiss AG, Contamac Ltd., Cooper Vision, EssilorLuxottica, Euclid Vision Group, HOYA CORP., Johnson and Johnson Services Inc., Menicon Co. Ltd., Metro Optics of Austin Inc., MPG and E Handel und Service GmbH, Neovision Co. Ltd., Novartis AG, Orion Vision Group, PRECILENS, SEED Co. Ltd., St. Shine Optical Co. Ltd., SynergEyes Inc. are a few of the key vendors in the Soft Contact Lens market.

                North America will register the highest growth rate of 43% among the other regions. Therefore, the Soft Contact Lens market in North America is expected to garner significant business opportunities for the vendors during the forecast period.

                US, China, UK, Canada, India, Japan, Germany, South Korea, France, Italy

                • Rise in number of people with eye disordersThe number of cases of eye disorders such as refractive error is the driving factor this market.
                • cataracts is the driving factor this market.
                • and glaucoma is increasing is the driving factor this market.
                • leading to visual impairment or blindness. Some of the reasons for such disorders include an increase in smoking and ultraviolet light exposure. Further is the driving factor this market.
                • the increase in the use of digital appliances and gadgets is the driving factor this market.
                • including gaming consoles is the driving factor this market.
                • computers is the driving factor this market.
                • and other electronic products is the driving factor this market.
                • has been one of the major factors contributing to the rise in eye disorders among youth in the past decade.An expanding global diabetic population is driving a rise in vision disorders. Diabetes can lead to glaucoma is the driving factor this market.
                • retinopathy is the driving factor this market.
                • cataracts is the driving factor this market.
                • transient blurring or even permanent vision loss. In 2024 is the driving factor this market.
                • an estimated 589 million adults (20 - 79 years) were living with diabetes worldwide is the driving factor this market.
                • and this figure is projected to increase to 643 million by 2030 and 783 million by 2045. Thus is the driving factor this market.
                • the gradual rise in the number of people with eye disorders has led to a rise in demand for corrective lenses. According to the Vision Impact Institute research is the driving factor this market.
                • three out of four people in the US have vision correction.Though the primary solution for corrective vision is eyeglasses is the driving factor this market.
                • the advantages of contact lenses often lead to a fair share of people opting for them over eyeglasses. For instance is the driving factor this market.
                • soft contact lenses provide the advantage of a minimum adjustment period and comfort almost immediately after use; this will increase the demand for soft contact lenses is the driving factor this market.
                • thereby driving the growth of global soft contact lens market during the forecast period. is the driving factor this market.

                The Soft Contact Lens market vendors should focus on grabbing business opportunities from the Daily soft contact lens segment as it accounted for the largest market share in the base year.