
Soft Magnetic Material Market Size 2025-2029
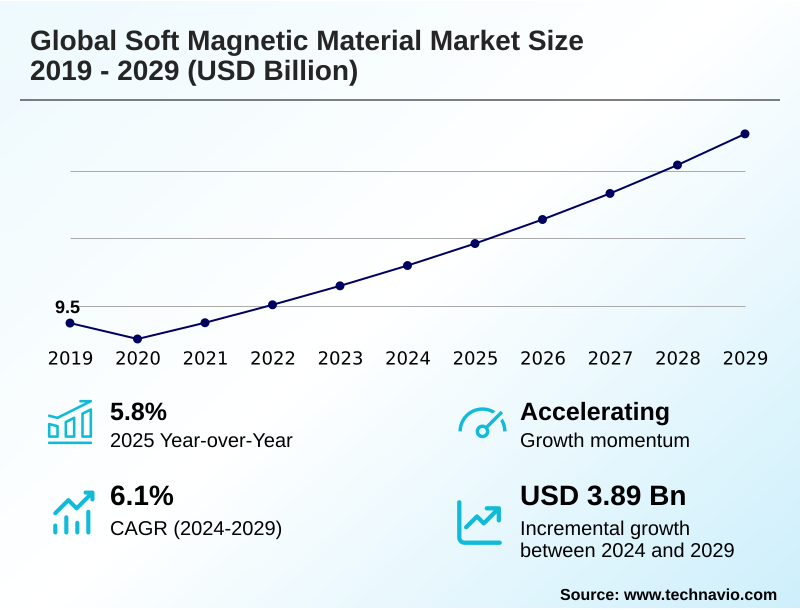
The soft magnetic material market size is valued to increase by USD 3.89 billion, at a CAGR of 6.1% from 2024 to 2029. Accelerated electrification of global automotive fleet sector will drive the soft magnetic material market.
Major Market Trends & Insights
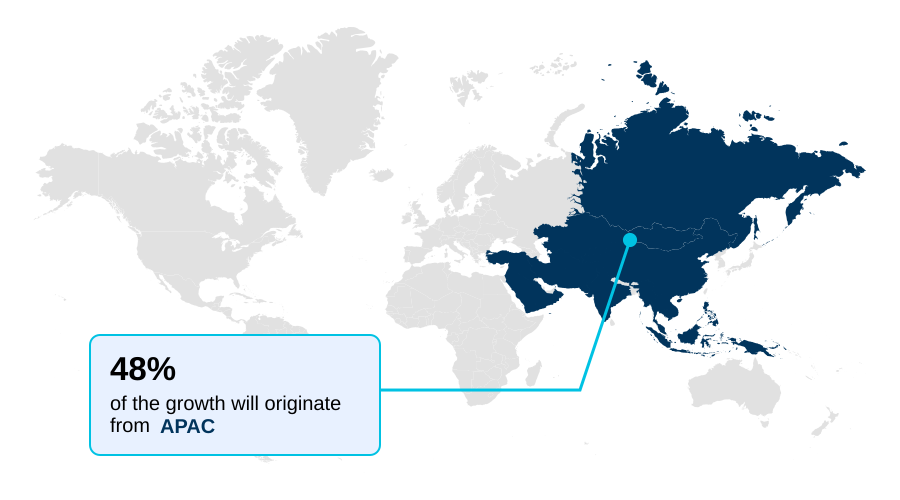
- APAC dominated the market and accounted for a 48.2% growth during the forecast period.
- By End-user - Electronics segment was valued at USD 4.07 billion in 2023
- By Product - Electrical steel segment accounted for the largest market revenue share in 2023
Market Size & Forecast
- Market Opportunities: USD 5.59 billion
- Market Future Opportunities: USD 3.89 billion
- CAGR from 2024 to 2029 : 6.1%
Market Summary
- The soft magnetic material market is integral to global advancements in energy efficiency and electrification. Its growth is propelled by the increasing demand for high-performance components in sectors such as automotive, renewable energy, and electronics.
- The market is witnessing a significant technological shift from traditional silicon steel and ferrites toward advanced solutions, including soft magnetic composites (SMCs), amorphous alloys, and nanocrystalline materials. These innovations are critical for developing more efficient traction motors, compact power inductors, and high-frequency transformers.
- For instance, in a typical business scenario, an electric vehicle manufacturer collaborates with a materials supplier to engineer a custom soft magnetic composite for a motor core. The objective is to reduce hysteresis loss and improve thermal stability, which directly translates to an increased vehicle range and optimized power conversion efficiency.
- This dynamic underscores the market’s move toward application-specific engineering and strategic partnerships to overcome performance barriers. The high R&D investment and complexities in scaling advanced processing techniques remain notable industry considerations, shaping the competitive landscape.
What will be the Size of the Soft Magnetic Material Market during the forecast period?
Get Key Insights on Market Forecast (PDF) Get Free Sample
How is the Soft Magnetic Material Market Segmented?
The soft magnetic material industry research report provides comprehensive data (region-wise segment analysis), with forecasts and estimates in "USD million" for the period 2025-2029, as well as historical data from 2019-2023 for the following segments.
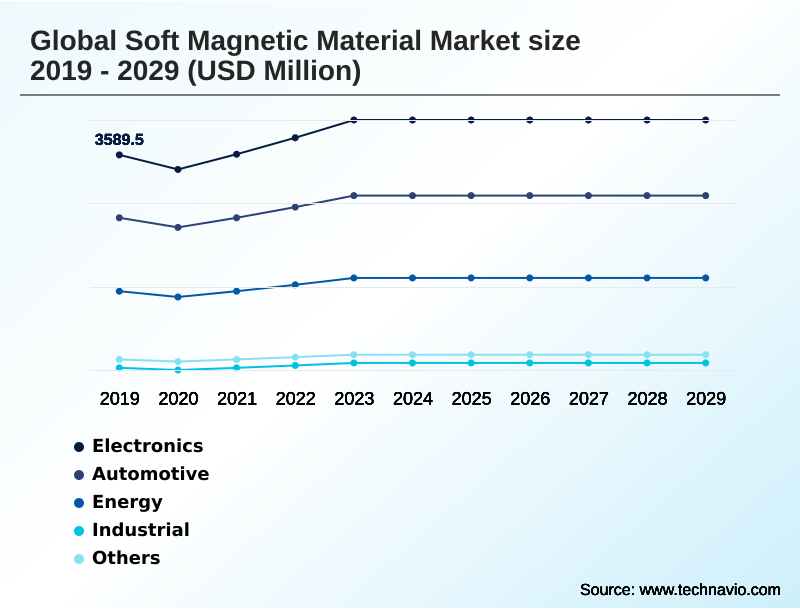
- End-user
- Electronics
- Automotive
- Energy
- Industrial
- Others
- Product
- Electrical steel
- Soft ferrite
- Permalloys
- Application
- Motors
- Transformers
- Alternators
- Geography
- APAC
- China
- Japan
- India
- North America
- US
- Canada
- Mexico
- Europe
- Germany
- UK
- France
- South America
- Brazil
- Argentina
- Colombia
- Middle East and Africa
- Saudi Arabia
- UAE
- South Africa
- Rest of World (ROW)
- APAC
By End-user Insights
The electronics segment is estimated to witness significant growth during the forecast period.
The electronics segment is a critical consumer of soft magnetic materials, driven by the demand for higher efficiency and miniaturization in power conversion electronics.
Components such as high-frequency transformers, DC-DC converters, and power inductors are fundamental to data center power supplies and 5G infrastructure components.
The evolution of advanced material formulations, including soft ferrite and nickel-zinc ferrite, is essential for enabling high-frequency power conversion in devices ranging from onboard chargers for electric vehicles to wireless charging systems.
Effective electromagnetic noise suppression is another key requirement, pushing innovation in materials that deliver superior performance. These advancements enable component designs that improve power density by more than 15%, meeting the rigorous demands of modern electronics applications.
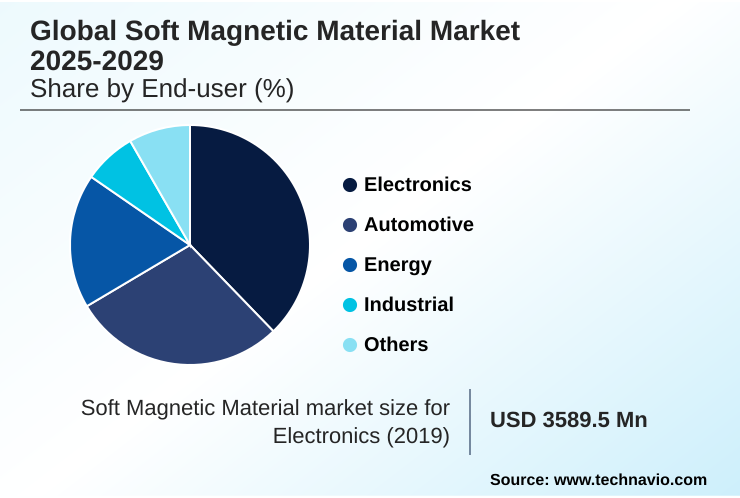
The Electronics segment was valued at USD 4.07 billion in 2023 and showed a gradual increase during the forecast period.
Regional Analysis
APAC is estimated to contribute 48.2% to the growth of the global market during the forecast period.Technavio’s analysts have elaborately explained the regional trends and drivers that shape the market during the forecast period.
See How Soft Magnetic Material Market Demand is Rising in APAC Get Free Sample
The global market exhibits a distinct geographic concentration, with APAC commanding nearly 48.2% of the market, driven by its extensive manufacturing base.
China, a dominant force, excels in the large-scale production of electrical steel and ferrites, while Japan and South Korea lead in high-value, high-permeability materials for advanced electronics.
In North America and Europe, the market is primarily fueled by automotive electrification and investments in grid modernization.
The performance of these materials is critical, with properties like low core loss and controlled magnetic anisotropy directly influencing the efficiency of transformers and motors.
Innovations in gas atomized powders and metal injection molding (MIM) are enabling manufacturers in these regions to produce components with complex geometries and superior saturation flux density, reducing eddy current loss in high-frequency applications and improving overall system performance.
Market Dynamics
Our researchers analyzed the data with 2024 as the base year, along with the key drivers, trends, and challenges. A holistic analysis of drivers will help companies refine their marketing strategies to gain a competitive advantage.
- The continuous push for higher performance and efficiency across industries is accelerating innovation in the soft magnetic material market. The development of soft magnetic materials for EV motors is a primary focus, where advanced electrical steel for traction motors is crucial for extending vehicle range. Designers are leveraging soft magnetic composites for axial flux motors to achieve higher power density.
- Simultaneously, the demand for low core loss electrical steel grades and silicon steel for distribution transformers is growing to support grid modernization. In power electronics, high permeability soft ferrite cores are essential, with MnZn ferrite for EMI suppression filters becoming standard in many devices.
- Nanocrystalline materials for power electronics and high performance materials for DC-DC converters are enabling smaller, more efficient power supplies, while the amorphous metal transformer core design offers superior performance over traditional materials. Applications extend to materials for grid-scale energy storage inverters and high-frequency materials for 5G base stations.
- Optimizing core geometry with soft materials is a key design strategy for reducing eddy current loss in motors and improving thermal management in magnetic components. New designs utilizing these advanced materials demonstrate a performance improvement of over 20% compared to legacy components, showcasing the direct impact of material science on operational efficiency.
- This trend is also evident in advanced materials for wireless charging pads and the use of powder metallurgy for high frequency inductors in both industrial automation and consumer electronics.
What are the key market drivers leading to the rise in the adoption of Soft Magnetic Material Industry?
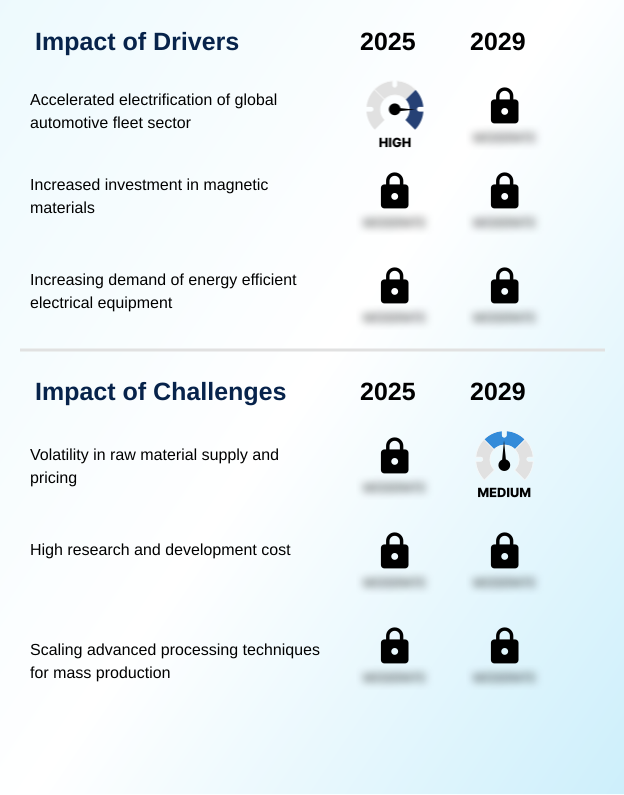
- The accelerated electrification of the global automotive fleet sector serves as a key driver for the soft magnetic material market.
- The primary driver is the large-scale electrification of transportation, which dramatically increases the demand for high-performance soft magnetic materials in electric vehicle powertrains.
- Core components like traction motors and power converters rely on advanced electrical steel and soft magnetic composites to achieve high efficiency and power density.
- The industry-wide shift toward 800-volt architectures requires non-grain-oriented electrical steel and magnetic alloy powders capable of operating at higher frequencies with minimal losses.
- The use of sintered magnetic components in high rotational speed motors has demonstrated a 15% improvement in power-to-weight ratios.
- Furthermore, the adoption of powder metallurgy components allows for superior magnetic flux control, leading to the development of more compact and energy-efficient transformers.
What are the market trends shaping the Soft Magnetic Material Industry?
- The accelerated electrification of the automotive and transportation sector is emerging as a defining market trend. This movement significantly increases the need for high-performance materials in electric vehicles and associated charging infrastructure.
- Key trends are reshaping the market, led by the imperative for enhanced power conversion efficiency and performance at high frequencies. The development of advanced amorphous alloys and nanocrystalline materials is enabling breakthroughs in ultra-fast charging systems and renewable power generation. These materials offer superior thermal stability and magnetic flux characteristics compared to traditional silicon steel.
- For instance, AI-driven simulations are accelerating the design of three-dimensional magnetic flux paths, reducing material development timelines by up to 25%. This innovation, coupled with advanced processing techniques, allows for the creation of application-specific material solutions that can improve the efficiency of grid modernization hardware by over 10%, highlighting the shift toward highly specialized, performance-oriented components.
What challenges does the Soft Magnetic Material Industry face during its growth?
- Volatility in the supply and pricing of essential raw materials presents a key challenge that affects the industry's growth trajectory.
- Significant market challenges arise from supply chain instability and price volatility for strategic raw materials, including rare earth elements and specialized metal powders. This uncertainty complicates production planning and can erode profit margins, with input costs fluctuating by as much as 30% in a single year.
- Moreover, achieving high magnetic permeability and low coercivity in materials like permalloys and manganese-zinc ferrite requires significant R&D investment. Scaling up new materials from lab to mass production presents another hurdle, as maintaining consistent quality in powdered iron cores and lamination steel at high volumes is complex.
- Securing a stable supply chain through vertical integration strategies has become critical, though this requires substantial capital outlay, increasing the total cost of bringing a new product to market by over 50%.
Exclusive Technavio Analysis on Customer Landscape
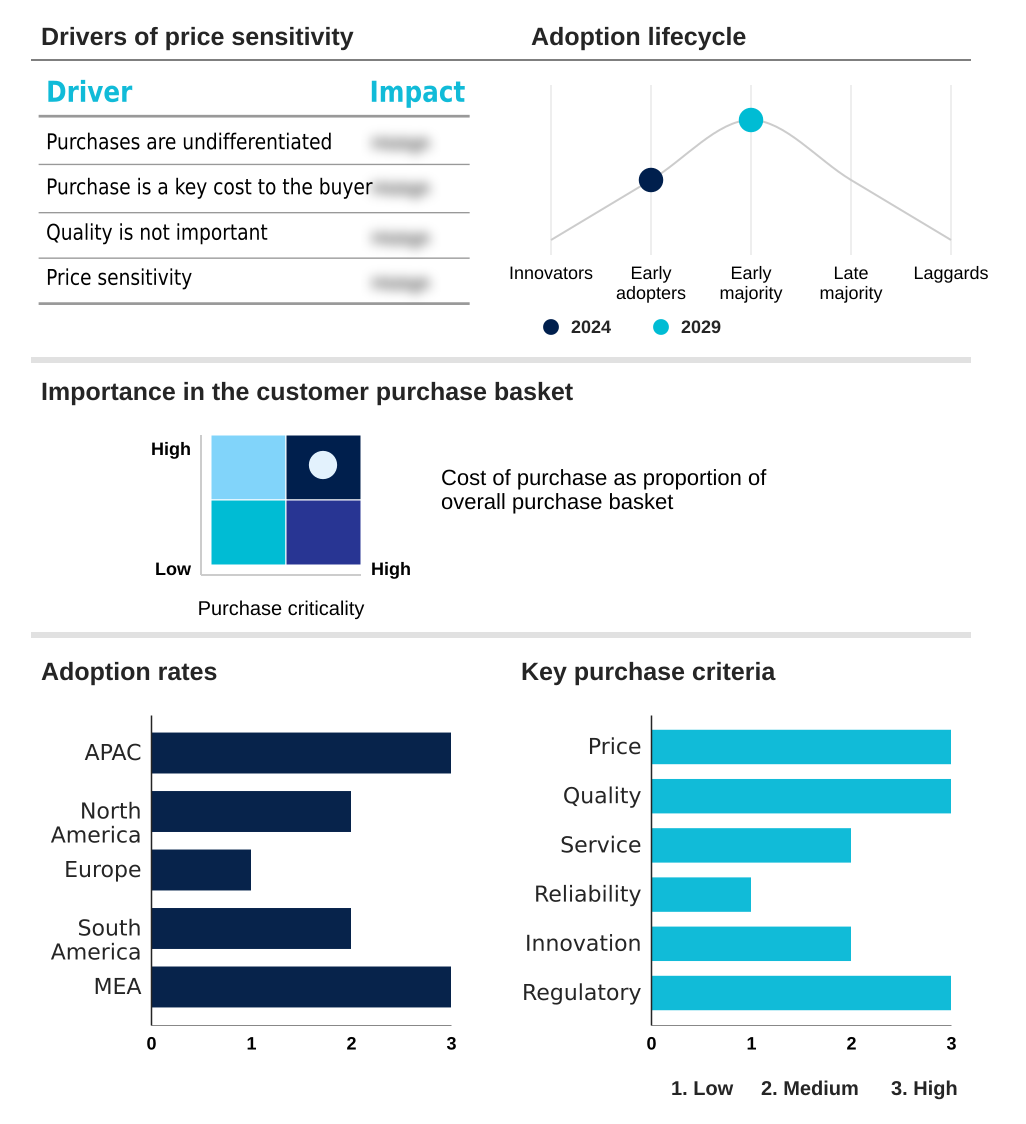
The soft magnetic material market forecasting report includes the adoption lifecycle of the market, covering from the innovator’s stage to the laggard’s stage. It focuses on adoption rates in different regions based on penetration. Furthermore, the soft magnetic material market report also includes key purchase criteria and drivers of price sensitivity to help companies evaluate and develop their market growth analysis strategies.
Customer Landscape of Soft Magnetic Material Industry
Competitive Landscape
Companies are implementing various strategies, such as strategic alliances, soft magnetic material market forecast, partnerships, mergers and acquisitions, geographical expansion, and product/service launches, to enhance their presence in the industry.
Daido Steel Co. Ltd. - The company provides specialized soft magnetic materials, focusing on magnetic alloy powders for high-performance electronic components like reactors and electric motors.
The industry research and growth report includes detailed analyses of the competitive landscape of the market and information about key companies, including:
- Daido Steel Co. Ltd.
- Fluxtrol Inc.
- GKN Sinter Metals Engineering GmbH
- Guangdong Lingyi Zhizhi Manufacturing Co. Ltd.
- Hengdian Group Holdings Ltd.
- Hitachi Ltd.
- Hoganas AB
- JFE Holdings Inc.
- Mate Co. Ltd.
- Merck KGaA
- Nippon Steel Corp.
- Rio Tinto Ltd.
- Samwha Electronics
- Sintered Specialties LLC
- Sintex AS
- Steward Advanced Materials LLC
- TDG Holding Co. Ltd.
- TDK Corp.
- Toshiba Corp.
- Vacuumschmelze GmbH and Co. KG
Qualitative and quantitative analysis of companies has been conducted to help clients understand the wider business environment as well as the strengths and weaknesses of key industry players. Data is qualitatively analyzed to categorize companies as pure play, category-focused, industry-focused, and diversified; it is quantitatively analyzed to categorize companies as dominant, leading, strong, tentative, and weak.
Recent Development and News in Soft magnetic material market
- In September 2024, Hoganas AB launched a new grade of soft magnetic composite powder, engineered to reduce core losses at high frequencies by 15%, specifically targeting applications in high-performance industrial motors and renewable energy inverters.
- In November 2024, TDK Corp. announced a strategic capacity expansion for its advanced ferrite materials to address escalating demand from the 5G infrastructure and data center power supply sectors.
- In January 2025, ZF Friedrichshafen AG initiated mass production of its next-generation asynchronous electric motor, which utilizes advanced soft magnetic composite materials to achieve higher power density and efficiency for electric vehicle applications.
- In March 2025, a leading automotive OEM and a specialized materials science firm revealed a strategic partnership to co-develop next-generation nanocrystalline ribbon materials for ultra-fast EV charging systems, aiming to reduce charging times significantly.
Dive into Technavio’s robust research methodology, blending expert interviews, extensive data synthesis, and validated models for unparalleled Soft Magnetic Material Market insights. See full methodology.
| Market Scope | |
|---|---|
| Page number | 296 |
| Base year | 2024 |
| Historic period | 2019-2023 |
| Forecast period | 2025-2029 |
| Growth momentum & CAGR | Accelerate at a CAGR of 6.1% |
| Market growth 2025-2029 | USD 3886.8 million |
| Market structure | Fragmented |
| YoY growth 2024-2025(%) | 5.8% |
| Key countries | China, Japan, India, South Korea, Australia, Indonesia, US, Canada, Mexico, Germany, UK, France, Italy, The Netherlands, Spain, Brazil, Argentina, Colombia, Saudi Arabia, UAE, South Africa, Israel and Turkey |
| Competitive landscape | Leading Companies, Market Positioning of Companies, Competitive Strategies, and Industry Risks |
Research Analyst Overview
- The soft magnetic material market is undergoing a structural transformation driven by global electrification and digitalization. The emphasis is shifting from commodity materials to highly engineered solutions like soft magnetic composites and nanocrystalline materials that offer superior performance in demanding applications. Boardroom-level product strategy must now prioritize vertical integration and strategic R&D partnerships to secure access to advanced material science.
- Key performance metrics such as low core loss, high magnetic permeability, and controlled coercivity are no longer just technical specifications; they are critical enablers of competitive advantage in electric vehicles, 5G infrastructure, and renewable energy systems. Innovations in materials like FINEMET and specialized magnetic alloy powders are allowing for the creation of more efficient high-frequency transformers and power inductors.
- The use of advanced electrical steel, including both grain-oriented and non-grain-oriented electrical steel, along with silicon steel, is fundamental to reducing energy consumption in motors and power grids. For example, the adoption of these advanced materials has enabled a reduction in component size by up to 30% while maintaining or improving power conversion efficiency and thermal stability.
What are the Key Data Covered in this Soft Magnetic Material Market Research and Growth Report?
-
What is the expected growth of the Soft Magnetic Material Market between 2025 and 2029?
-
USD 3.89 billion, at a CAGR of 6.1%
-
-
What segmentation does the market report cover?
-
The report is segmented by End-user (Electronics, Automotive, Energy, Industrial, Others), Product (Electrical steel, Soft ferrite, Permalloys), Application (Motors, Transformers, Alternators) and Geography (APAC, North America, Europe, South America, Middle East and Africa)
-
-
Which regions are analyzed in the report?
-
APAC, North America, Europe, South America and Middle East and Africa
-
-
What are the key growth drivers and market challenges?
-
Accelerated electrification of global automotive fleet sector, Volatility in raw material supply and pricing
-
-
Who are the major players in the Soft Magnetic Material Market?
-
Daido Steel Co. Ltd., Fluxtrol Inc., GKN Sinter Metals Engineering GmbH, Guangdong Lingyi Zhizhi Manufacturing Co. Ltd., Hengdian Group Holdings Ltd., Hitachi Ltd., Hoganas AB, JFE Holdings Inc., Mate Co. Ltd., Merck KGaA, Nippon Steel Corp., Rio Tinto Ltd., Samwha Electronics, Sintered Specialties LLC, Sintex AS, Steward Advanced Materials LLC, TDG Holding Co. Ltd., TDK Corp., Toshiba Corp. and Vacuumschmelze GmbH and Co. KG
-
Market Research Insights
- The market's momentum is sustained by a profound shift toward high-frequency power conversion and efficiency. The adoption of electric vehicle powertrains and the expansion of renewable power generation are creating substantial demand for advanced material formulations. For example, the use of sintered magnetic components has enabled a reduction in motor weight by up to 15% for the same power output.
- Concurrently, new energy-efficient transformers utilizing superior materials are reducing core losses by over 10% in grid applications. This drive for performance is supported by innovations in powder metallurgy components, which offer greater design flexibility and improved magnetic flux control, essential for developing next-generation electronic systems.
We can help! Our analysts can customize this soft magnetic material market research report to meet your requirements.
 RIA -
RIA - 
