Spandex Fiber Market Size 2025-2029
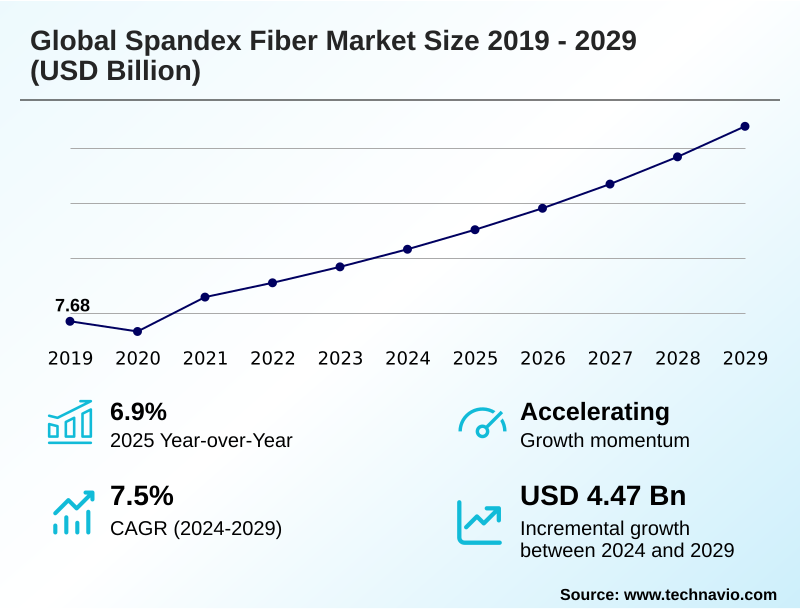
The spandex fiber market size is valued to increase by USD 4.47 billion, at a CAGR of 7.5% from 2024 to 2029. Increasing usage in automotive industry will drive the spandex fiber market.
Major Market Trends & Insights
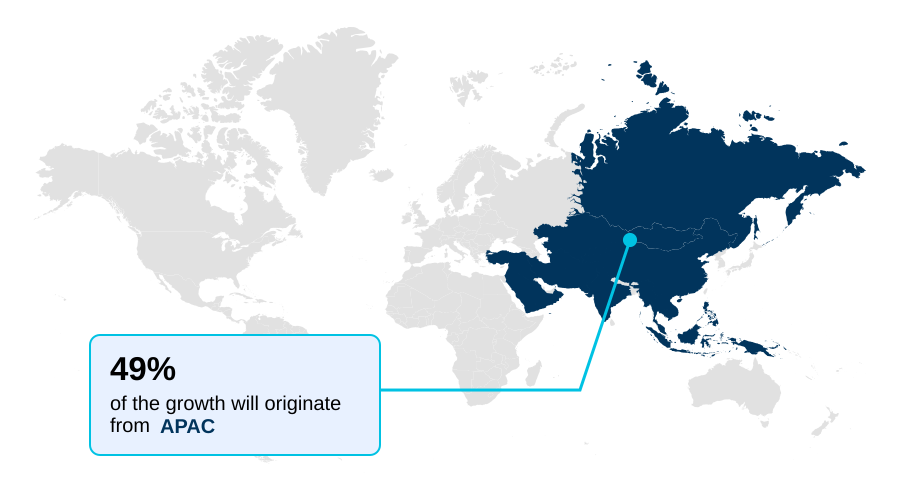
- APAC dominated the market and accounted for a 49% growth during the forecast period.
- By Application - Apparel and clothing segment was valued at USD 7.78 billion in 2023
- By Material Type - Synthetic polyurethane segment accounted for the largest market revenue share in 2023
Market Size & Forecast
- Market Opportunities: USD 7.09 billion
- Market Future Opportunities: USD 4.47 billion
- CAGR from 2024 to 2029 : 7.5%
Market Summary
- The spandex fiber market is defined by a dynamic interplay of material science and shifting consumer values. Growth is fundamentally linked to the athleisure clothing trend and the increasing integration of stretch fabrics into everyday wear, from activewear to formal attire.
- A key driver is the pursuit of functional comfort, pushing manufacturers toward innovations in polymer chemistry to enhance properties like moisture wicking and thermal stability. For instance, textile mills are adopting advanced fiber blending techniques to produce fabrics with a specific elastic modulus and tensile strength, optimizing both comfort and garment durability for performance-oriented apparel.
- However, the industry grapples with challenges related to feedstock volatility and the environmental impact of petrochemical precursors. A major operational focus is on supply chain optimization to mitigate the costs associated with synthetic polyurethane production.
- The push for sustainable fiber technologies, including bio-derived fiber and recycled spandex, is reshaping sourcing strategies and creating new avenues for brand differentiation in a competitive landscape focused on both performance and circularity in textiles.
What will be the Size of the Spandex Fiber Market during the forecast period?
Get Key Insights on Market Forecast (PDF) Get Free Sample
How is the Spandex Fiber Market Segmented?
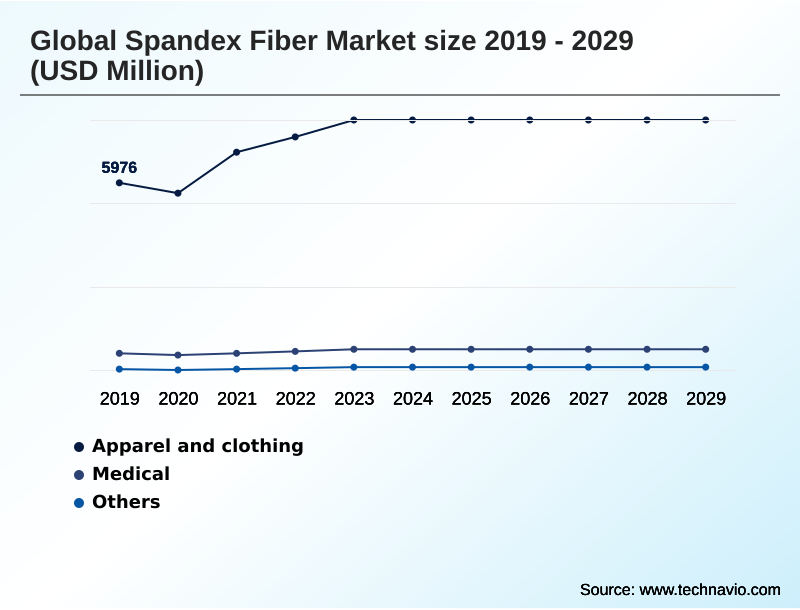
The spandex fiber industry research report provides comprehensive data (region-wise segment analysis), with forecasts and estimates in "USD million" for the period 2025-2029, as well as historical data from 2019-2023 for the following segments.
- Application
- Apparel and clothing
- Medical
- Others
- Material type
- Synthetic polyurethane
- Recycled spandex
- Bio-based spandex
- End-user
- Textile and fashion
- Sports and activewear
- Compression and medical garments
- Geography
- APAC
- China
- Japan
- India
- North America
- US
- Canada
- Mexico
- Europe
- Germany
- UK
- France
- South America
- Brazil
- Argentina
- Middle East and Africa
- Saudi Arabia
- UAE
- South Africa
- Rest of World (ROW)
- APAC
By Application Insights
The apparel and clothing segment is estimated to witness significant growth during the forecast period.
The apparel and clothing segment is shaped by advanced textile engineering and evolving end-user applications. For the modern fashion industry, success hinges on delivering comfort-driven fashion that aligns with trends like inclusive sizing.
Key fabric performance metrics, including pilling resistance and overall garment durability, are critical for brand differentiation.
Innovations in fiber blending and yarn denier are enabling manufacturers to enhance shape retention, creating garments that meet consumer expectations for both style and longevity.
For instance, incorporating elastane fibers can increase a fabric's stretch capacity by over 500%, a crucial factor in this segment's value proposition.
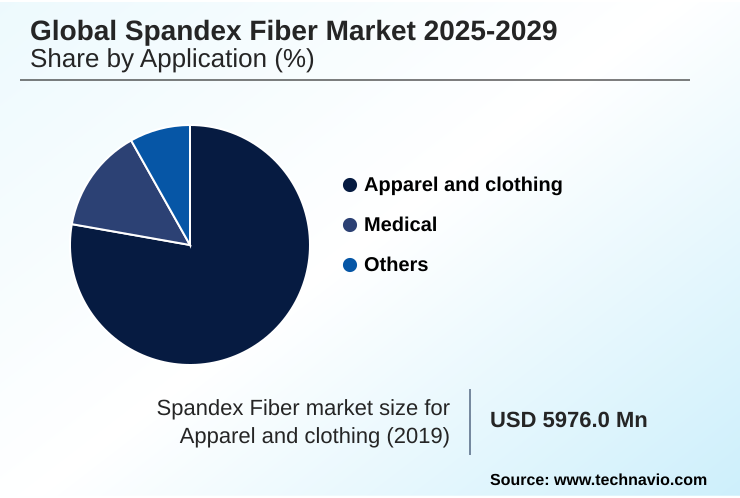
The Apparel and clothing segment was valued at USD 7.78 billion in 2023 and showed a gradual increase during the forecast period.
Regional Analysis
APAC is estimated to contribute 49% to the growth of the global market during the forecast period.Technavio’s analysts have elaborately explained the regional trends and drivers that shape the market during the forecast period.
See How Spandex Fiber Market Demand is Rising in APAC Get Free Sample
The geographic landscape of the spandex fiber market is characterized by significant regional disparities in growth and production, with APAC emerging as the central hub.
The region accounts for nearly 49% of the market's incremental growth, expanding at a rate approximately 19% faster than North America. This expansion is driven by a massive manufacturing base and burgeoning demand for activewear and intimate apparel.
In contrast, markets in Europe and North America are increasingly focused on high-performance apparel and medical textiles, leveraging advanced elastane fibers.
The development of bio-based spandex and recycled spandex is gaining traction globally, with innovations in the dry spinning process and sourcing of renewable butanediol.
Key raw materials like polytetramethylene ether glycol and methyl diphenyl diisocyanate are central to production, but the pivot toward bio-derived fiber is altering regional supply chains, especially for home furnishing applications.
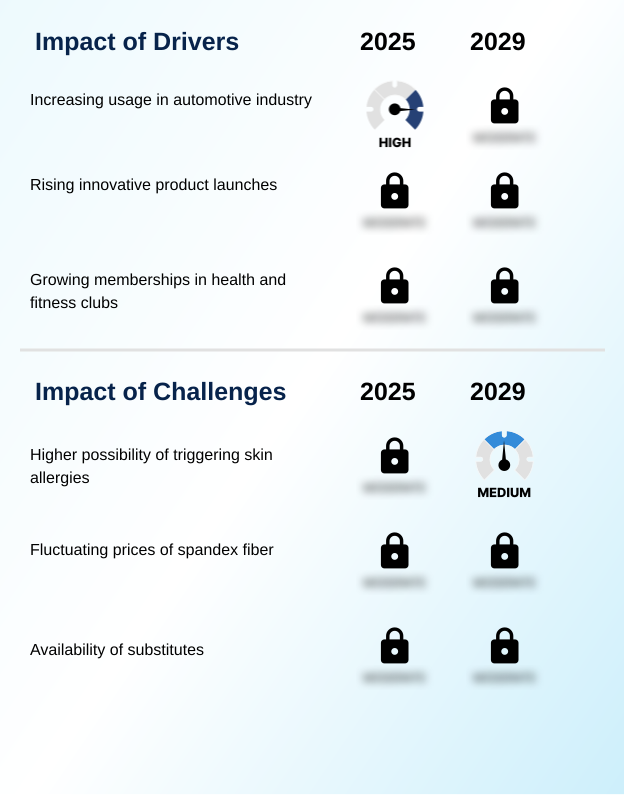
Market Dynamics
Our researchers analyzed the data with 2024 as the base year, along with the key drivers, trends, and challenges. A holistic analysis of drivers will help companies refine their marketing strategies to gain a competitive advantage.
- The versatility of spandex is broadening its market penetration beyond traditional apparel. The use of spandex fiber in the automotive industry is growing, as manufacturers seek durable and flexible materials for interior components. Concurrently, the role of spandex in athleisure wear remains a primary demand driver, with a specific focus on materials for high-performance cycling gear and competitive swimming.
- Innovations are addressing both performance and sustainability, with ongoing research into biodegradable spandex and analysis of the cost of recycled spandex. While consumer demand for stretch fabrics is strong, challenges persist. The impact of spandex on skin allergies is a significant concern, leading to stricter regulatory standards for spandex content and influencing consumer choices.
- In the medical field, spandex fiber for medical compression garments is a critical application, though alternatives are being explored. The challenges of recycling spandex blends and the chemicals in the spandex manufacturing process are pushing the industry toward more sustainable initiatives in fiber production. This is leading to a nuanced comparison of bio-based spandex vs.
- synthetic polyurethane, affecting everything from fabric breathability to its use in seamless apparel and industrial applications.
What are the key market drivers leading to the rise in the adoption of Spandex Fiber Industry?
- The expanding application of spandex fibers within the automotive industry for interior components serves as a key driver for market growth.
- Market growth is significantly driven by expanding end-user applications beyond traditional fashion. The use of spandex in automotive textiles and industrial protective garments is increasing, where properties like being an abrasion-resistant polymer and high elongation are critical.
- Innovations in manufacturing efficiency, such as optimizing continuous polymerization, enhance cost-effectiveness and reduce needle cutting damage during sewing, which lowers production waste by up to 5%.
- This material innovation is also crucial in hygiene products, where stretch recovery and a soft feel are paramount.
- The overall textile market dynamics are influenced by the reliability and performance of these synthetic fibers, which exhibit superior UV resistance, making them suitable for a wide range of demanding environments and industrial uses.
What are the market trends shaping the Spandex Fiber Industry?
- The increasing adoption of spandex fiber in performance apparel, particularly for swimming and other sports, represents a significant upcoming market trend. This is fueled by consumer demand for enhanced comfort and functionality in activewear.
- Key market trends are centered on the convergence of performance and lifestyle, driven by the sustained popularity of athleisure clothing and the broader sportswear market. Innovations in polymer chemistry are enabling the creation of fibers with enhanced moisture wicking, thermal stability, and lightweight strength.
- This supports the development of performance-oriented apparel that meets evolving consumer preferences for both function and style. The integration of smart textiles for wearable technology is also a significant trend, pushing the boundaries of what fabrics can do.
- As a result, the tensile strength and elastic modulus of fibers are becoming critical metrics, with advanced dye uptake processes improving aesthetic possibilities. This shift is leading to a 15% increase in the adoption of specialized fibers in premium activewear collections.
What challenges does the Spandex Fiber Industry face during its growth?
- The potential for skin allergies associated with prolonged spandex wear presents a notable challenge to the industry's growth trajectory.
- The market faces considerable challenges tied to sustainability and supply chain vulnerabilities. The reliance on petrochemical precursors for synthetic polyurethane production creates significant feedstock volatility, impacting price stability. Navigating regulatory compliance for chemicals like polyether polyols and diisocyanates requires robust supply chain optimization.
- The push toward circularity in textiles is hampered by the difficulty of recycling blended fabrics, a primary hurdle for sustainable fiber technologies. While demand for eco-friendly materials is high, scaling production of alternatives to meet the performance of traditional fibers, especially in hosiery products, remains a challenge.
- For example, ensuring consistent chlorine resistance and antistatic properties in recycled variants adds a 12% layer of processing complexity compared to virgin materials.
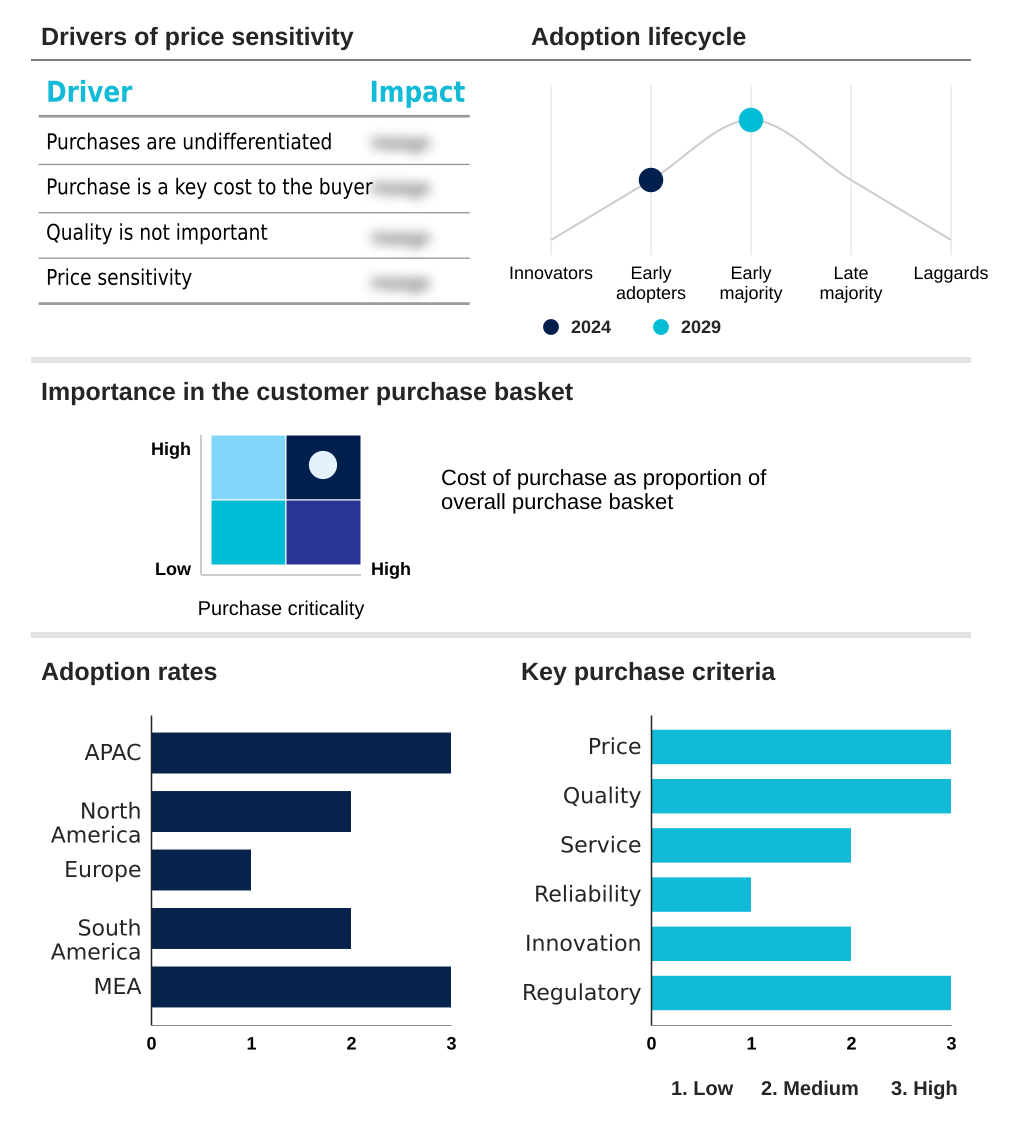
Exclusive Technavio Analysis on Customer Landscape
The spandex fiber market forecasting report includes the adoption lifecycle of the market, covering from the innovator’s stage to the laggard’s stage. It focuses on adoption rates in different regions based on penetration. Furthermore, the spandex fiber market report also includes key purchase criteria and drivers of price sensitivity to help companies evaluate and develop their market growth analysis strategies.
Customer Landscape of Spandex Fiber Industry
Competitive Landscape
Companies are implementing various strategies, such as strategic alliances, spandex fiber market forecast, partnerships, mergers and acquisitions, geographical expansion, and product/service launches, to enhance their presence in the industry.
Asahi Kasei Corp. - Key market offerings include advanced elastane fibers engineered for superior stretch, recovery, and durability, catering to diverse high-performance textile applications.
The industry research and growth report includes detailed analyses of the competitive landscape of the market and information about key companies, including:
- Asahi Kasei Corp.
- BASF SE
- Highsun Holding Group
- Huafon Group Co. Ltd.
- Hyosung Corp.
- Indorama Corp.
- INVISTA Equities, LLC
- INVIYA
- Radici Partecipazioni Spa
- Taekwang Industrial Co. Ltd.
- TK Chemical Co. Ltd.
- Toray Industries Inc.
- Xiamen Lilong Spandex Co. Ltd.
- Yantai Tayho Advanced Materials Co. Ltd.
- Zhejiang Huafon Spandex Co. Ltd
Qualitative and quantitative analysis of companies has been conducted to help clients understand the wider business environment as well as the strengths and weaknesses of key industry players. Data is qualitatively analyzed to categorize companies as pure play, category-focused, industry-focused, and diversified; it is quantitatively analyzed to categorize companies as dominant, leading, strong, tentative, and weak.
Recent Development and News in Spandex fiber market
- In September, 2024, a leading European chemical company announced the acquisition of a startup specializing in bio-based spandex, aiming to integrate sustainable fiber technologies into its portfolio and meet growing demand for eco-friendly materials.
- In November, 2024, a major Asian manufacturer launched a new line of recycled spandex fibers made from post-consumer waste, targeting the circularity in textiles market and offering brands a verifiable sustainable option for their collections.
- In February, 2025, Hyosung TNC confirmed the completion of its spandex production facility expansion in India, specifically enhancing polymerization processes to supply high-performance materials for hygiene products, as initially announced in May 2024.
- In April, 2025, INVISTA Equities, LLC and a prominent sportswear brand revealed a strategic partnership to co-develop next-generation smart textiles incorporating LYCRA FitSense technology for the wearable technology market, with an initial focus on performance-oriented apparel.
Dive into Technavio’s robust research methodology, blending expert interviews, extensive data synthesis, and validated models for unparalleled Spandex Fiber Market insights. See full methodology.
| Market Scope | |
|---|---|
| Page number | 284 |
| Base year | 2024 |
| Historic period | 2019-2023 |
| Forecast period | 2025-2029 |
| Growth momentum & CAGR | Accelerate at a CAGR of 7.5% |
| Market growth 2025-2029 | USD 4473.7 million |
| Market structure | Fragmented |
| YoY growth 2024-2025(%) | 6.9% |
| Key countries | China, Japan, India, South Korea, Australia, Indonesia, US, Canada, Mexico, Germany, UK, France, Italy, Spain, The Netherlands, Brazil, Argentina, Chile, Saudi Arabia, UAE, South Africa, Israel and Turkey |
| Competitive landscape | Leading Companies, Market Positioning of Companies, Competitive Strategies, and Industry Risks |
Research Analyst Overview
- The spandex fiber market's evolution is driven by relentless innovation in polymer chemistry and textile engineering, directly impacting material properties like high elongation, stretch recovery, and garment durability. Key production inputs such as polytetramethylene ether glycol, methyl diphenyl diisocyanate, and polyether polyols are subject to feedstock volatility, challenging the cost-effectiveness of synthetic polyurethane.
- This has accelerated the development of bio-based spandex from renewable butanediol and recycled spandex, transforming production methods like the dry spinning process and continuous polymerization. Boardroom decisions are increasingly focused on adopting sustainable fiber technologies, as using eco-friendly materials offers significant brand differentiation.
- For instance, firms that have shifted to bio-derived fiber have reported a 10% improvement in dye uptake consistency, reducing rework. The emphasis is on enhancing fabric performance metrics—including chlorine resistance, UV resistance, and pilling resistance—while improving the elastic modulus and tensile strength of elastane fibers.
- This strategic pivot addresses both consumer preferences and regulatory compliance, ensuring long-term viability in a competitive landscape.
What are the Key Data Covered in this Spandex Fiber Market Research and Growth Report?
-
What is the expected growth of the Spandex Fiber Market between 2025 and 2029?
-
USD 4.47 billion, at a CAGR of 7.5%
-
-
What segmentation does the market report cover?
-
The report is segmented by Application (Apparel and clothing, Medical, and Others), Material Type (Synthetic polyurethane, Recycled spandex, and Bio-based spandex), End-user (Textile and fashion, Sports and activewear, and Compression and medical garments) and Geography (APAC, North America, Europe, South America, Middle East and Africa)
-
-
Which regions are analyzed in the report?
-
APAC, North America, Europe, South America and Middle East and Africa
-
-
What are the key growth drivers and market challenges?
-
Increasing usage in automotive industry, Higher possibility of triggering skin allergies
-
-
Who are the major players in the Spandex Fiber Market?
-
Asahi Kasei Corp., BASF SE, Highsun Holding Group, Huafon Group Co. Ltd., Hyosung Corp., Indorama Corp., INVISTA Equities, LLC, INVIYA, Radici Partecipazioni Spa, Taekwang Industrial Co. Ltd., TK Chemical Co. Ltd., Toray Industries Inc., Xiamen Lilong Spandex Co. Ltd., Yantai Tayho Advanced Materials Co. Ltd. and Zhejiang Huafon Spandex Co. Ltd
-
Market Research Insights
- Market dynamics are increasingly influenced by a shift toward material innovation and heightened consumer preferences for functional comfort. The demand for performance-oriented apparel and athleisure clothing is compelling producers to enhance manufacturing efficiency. For example, the adoption of bio-derived fiber processes has been shown to reduce energy consumption by over 15% compared to traditional methods.
- Furthermore, the integration of smart textiles for wearable technology is creating new end-user applications. In the competitive fashion industry, leveraging eco-friendly materials is a key aspect of brand differentiation, with advancements in sustainable fiber technologies helping to meet regulatory compliance standards more effectively. These shifts are fundamentally altering textile market dynamics across the board.
We can help! Our analysts can customize this spandex fiber market research report to meet your requirements.
 RIA -
RIA - 
