High Performance Fibers Market Analysis APAC, North America, Europe, Middle East and Africa, South America - US, China, Japan, Germany, France, Canada, South Korea, India, UK, Australia - Size and Forecast 2025-2029

High Performance Fibers Market Analysis APAC, North America, Europe, Middle East and Africa, South America - US, China, Japan, Germany, France, Canada, South Korea, India, UK, Australia - Size and Forecast 2025-2029

Published: Dec 2024 225 Pages SKU: IRTNTR80460

Market Overview at a Glance

$6.99 B
Market Opportunity
8.4%
CAGR
7.2
YoY growth 2024-2025(%)

What is the High Performance Fibers Market Size?

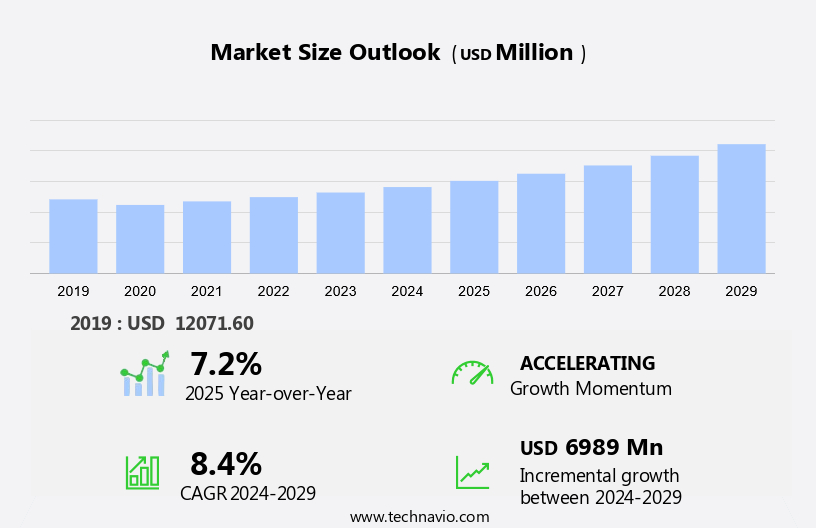
The high performance fibers market size is forecast to increase by USD 6.99 billion, at a CAGR of 8.4% between 2024 and 2029. The market is experiencing significant growth due to the increasing demand for lightweight, durable, and strong fibers in various industries. Key market trends include the expansion of companies through inorganic growth strategies, such as mergers and acquisitions, to enhance their product portfolios and gain a competitive edge. However, the high cost of production remains a challenge for market participants. In the US and North America, the market is expected to witness steady growth, driven by the increasing adoption of high-performance fibers in the automotive, aerospace, and sports industries. Additionally, the rising awareness of the benefits of high-performance fibers, such as improved durability and reduced weight, is fueling market growth. Companies are focusing on innovation and research and development to offer advanced high-performance fibers with enhanced properties, thereby catering to the evolving needs of consumers and industries.

What will be the size of the Market during the forecast period?

High Performance Fibers Market Size

Request Free  Market Sample

Market Segmentation

The market research report provides comprehensive data (region-wise segment analysis), with forecasts and estimates in "USD billion" for the period 2025-2029, as well as historical data from 2019 - 2023 for the following segments.
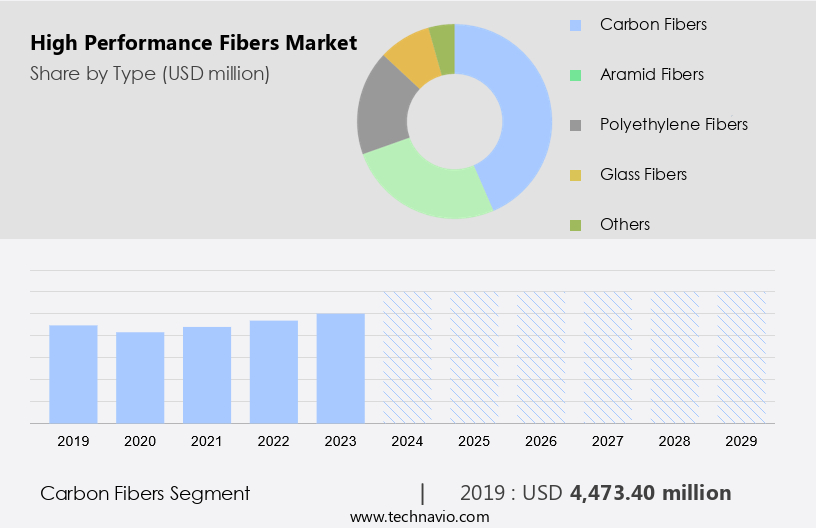
  • Type
    • Carbon fibers
    • Aramid fibers
    • Polyethylene fibers
    • Glass fibers
    • Others
  • Application
    • Aerospace and defense
    • Automotive
    • Electronics and electrical
    • Construction
    • Others
  • Geography
    • APAC
      • China
      • India
      • Japan
      • South Korea
    • North America
      • Canada
      • US
    • Europe
      • Germany
      • UK
      • France
    • Middle East and Africa
    • South America

Which is the largest segment driving market growth?

The carbon fibers segment is estimated to witness significant growth during the forecast period. The market encompasses various fiber types, with carbon fibers leading in growth and demand. Carbon fibers offer remarkable strength-to-weight ratios, making them essential for high performance applications in sectors like aerospace, automotive, and sports equipment. In July 2024, Toray Composite Materials America, Inc. announced a three-year MOU with Elevated Materials. This agreement designates Elevated Materials as the repurposing partner for Toray's Tacoma, Washington facility. Through this collaboration, Elevated Materials will process and repurpose scrap prepreg materials from Toray, including slit-edge and full-width prepreg sheets. This initiative supports sustainability efforts in the high performance fibers industry

High Performance Fibers Market Size

Get a glance at the market share of various regions. Download the PDF Sample

The carbon fibers segment was valued at USD 4.47 billion in 2019. Carbon fibers exhibit superior chemical resistance and high glass transition temperatures, making them ideal for use in concrete reinforcing, aircraft components, fishing nets, and ropes. The research and development sector continues to explore new applications for these fibers, including emission reduction technologies. Organic solvents are often used in the production process, necessitating a focus on sustainable manufacturing methods and waste reduction strategies. As an asbestos substitute, high performance fibers offer a safer alternative for various industries.

Which region is leading the market?

High Performance Fibers Market Share by Geography

For more insights on the market share of various regions, Request Free Sample

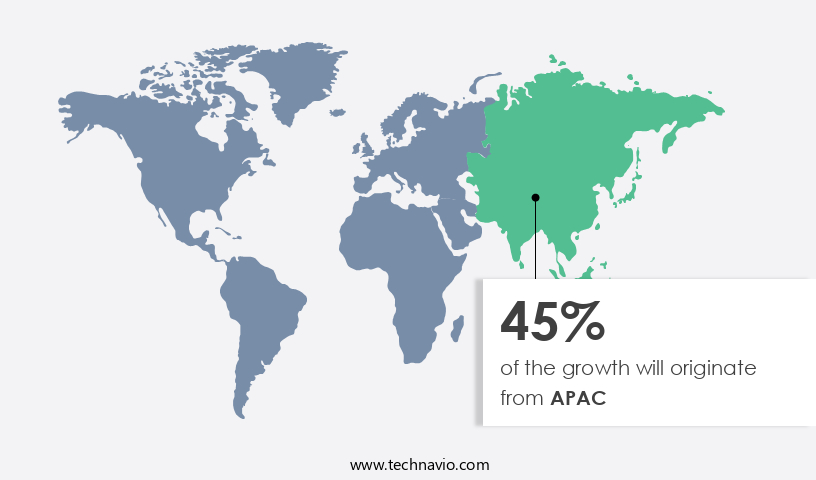
APAC is estimated to contribute 45% to the growth of the global market during the forecast period. Technavio's analysts have elaborately explained the regional market trends and drivers that shape the market during the forecast period. The Asia-Pacific (APAC) region is a significant market for high performance fibers, fueled by industrial growth, technological advancements, and rising demand in various industries. Notable progress was made in December 2023, as Teijin initiated the production and sale of Tenax Carbon Fibers, manufactured using sustainable acrylonitrile (AN). This development signifies the region's dedication to sustainability and innovation in high performance fiber production. Teijin Tenax Carbon Fibers are produced from waste and residue derived from biomass-sourced products or recycled raw materials, earning them ISCC PLUS certification from the International Sustainability and Carbon Certification system. This certification guarantees that the raw materials are ethically sourced and traceable throughout intricate supply chains. High performance fibers, such as aramid fibers, are widely used in industrial fabrics, surgical sutures, and applications within the sports industries. In addition, these fibers are crucial in defense, aerospace, and other sectors due to their antimicrobial properties and enhanced fuel efficiency. The APAC market's growth is attributed to the increasing demand for these high-performance materials in various industries and applications.

How do company ranking index and market positioning come to your aid?

Companies are implementing various strategies, such as strategic alliances, partnerships, mergers and acquisitions, geographical expansion, and product/service launches, to enhance their presence in the market.

3M Co. - The company offers high performance fibers, which are used in aerospace, automotive, industrial furnaces, and other high-temperature environments. They help improve efficiency, reduce maintenance costs, and extend the life of equipment.

Technavio provides the ranking index for the top 19 companies along with insights on the market positioning of:

  • Celanese Corp.
  • Denka Co. Ltd.
  • DuPont de Nemours Inc.
  • Fiber-line
  • Hexcel Corp.
  • Honeywell International Inc.
  • HS HYOSUNG ADVANCED MATERIALS
  • Kolon Industries Inc.
  • Kureha Corp.
  • Mitsubishi Chemical Group Corp.
  • Nexstar Extrusions Pvt Ltd
  • PT Asia Pacific Fibers Tbk
  • SGL Carbon SE
  • Stein Fibers Ltd.
  • Syensqo SA
  • Teijin Ltd.
  • Toray Industries Inc.
  • United Shield International LLC

Explore our company rankings and market positioning. Request Free Sample

How can Technavio assist you in making critical decisions?

High Performance Fibers Market Size

What is the market structure and year-over-year growth of the Market?

Market structure

Fragmented

YoY growth 2024-2025

7.2

Market Dynamics

High-performance fibers have emerged as a critical component in various industries due to their exceptional properties and versatility. These fibers, which include high-modulus materials, fiber-reinforced polymers (FRPs), and advanced materials, have gained significant attention due to their ability to enhance the mechanical, thermal, and chemical properties of composite materials. The global high-performance fibers market is driven by several factors. The increasing demand for lightweight and durable materials in the automotive, aerospace, and construction industries is a significant factor. High-performance fibers offer improved mechanical properties, such as high strength, stiffness, and resistance to impact, corrosion, and fire. Moreover, the growing emphasis on sustainability and eco-materials has led to the development of bio-based plastics, recycled fibers, and biodegradable materials. These eco-friendly textiles are gaining popularity in the fashion industry, contributing to the sustainable development of textiles and apparel. Material characterization and composite testing play a crucial role in the production and application of high-performance fibers.

Composite manufacturing techniques, such as pultrusion, filament winding, and resin transfer molding, are used to produce high-performance composites with optimal mechanical, thermal, and chemical properties. The use of high-performance fibers in structural composites has led to the development of innovative solutions in various industries. For instance, in the construction industry, high-performance fibers are used to produce fire-resistant and impact-resistant materials, enhancing the safety and durability of buildings. In the automotive industry, high-performance fibers are used to produce lightweight and fuel-efficient vehicles, reducing carbon emissions and improving fuel efficiency. The market for high-performance fibers is expected to grow significantly due to the increasing demand for sustainable manufacturing practices and the development of advanced materials. The circular economy is gaining momentum, with a focus on reducing waste and increasing the use of recycled fibers and bio-based composites. Our researchers analyzed the data with 2024 as the base year, along with the key drivers, trends, and challenges. A holistic analysis of drivers will help companies refine their marketing strategies to gain a competitive advantage.

What are the primary factors driving the market growth?

The increasing need for lightweight high-performance fibers is notably driving the market growth. The market is experiencing significant growth due to the increasing demand for lightweight, strong, and durable materials across various industries. In the aerospace sector, high performance fibers such as carbon-reinforced fiber composites and PBI fibers are being extensively used in the production of aircraft components, including wings, fuselages, and landing gear. These fibers offer an exceptional strength-to-weight ratio, making them ideal for use in aircraft manufacturing. In the automotive industry, high performance fibers are being used to produce lightweight armor for bullet-proof jackets and body armor. These fibers offer high elongation, chemical resistance, and non-conductivity, making them suitable for use in protective gloves and heat-resistant cushions. Additionally, high performance fibers are being used as an asbestos substitute in concrete reinforcing, contributing to the reduction of emissions during construction.

Further, the research and development of new high performance fibers, such as polybenzimidazole fibers, melamine fibers, and polyphenylene sulfide fibers, is driving innovation in the market. These fibers offer superior properties, including high temperature resistance, high strength, and resistance to organic solvents. They are being used in various emerging sectors, including fiber optics, energy, marine, and industrial fabrics. The market is driven by factors such as the need for fuel efficiency, durability, and emission reduction, as well as the development of sustainable fiber alternatives. The use of high-performance fibers in additive manufacturing is also expected to drive market growth in the coming years. Thus, such factors are driving the growth of the market during the forecast period.

What are the significant trends being witnessed in the market?

Expansion through inorganic growth strategies by companies is an emerging trend shaping market growth. The market is experiencing substantial growth, driven by strategic acquisitions and product diversification. Carbon-reinforced fiber composites and hpf-reinforced composites, such as those made from PBI fibers like Polybenzimidazole, are increasingly used in aerospace production for lightweight, heat-resistant components, including bullet-proof jackets, protective gloves, and aircraft components. These fibers offer superior chemical resistance, strength-to-weight ratio, and non-conductivity, making them ideal for use in electronics, composite materials, and industrial fabrics. High-performance fibers are also used in emerging sectors like additive manufacturing, sports, and healthcare applications.

For instance, they are used in the production of lightweight, high-strength armor for military vehicles and body armor, as well as in the development of eco-friendly alternatives for sports equipment, such as fishing nets, ropes, and fabric integrity. Moreover, high-performance fibers are used in various industries, including automotive, marine, and construction, to enhance durability, fuel efficiency, and emission reduction. Fluoropolymer fibers, polyphenylene sulfide fiber, and melamine fibers are popular choices for insulation, fiber optics, and energy applications. Research and development in sustainable fiber development, such as bio-based carbon fibers, is a growing focus area for companies in the market. Thus, such trends will shape the growth of the market during the forecast period.

What are the major market challenges?

The high cost of production is a significant challenge hindering the market growth. The market encompasses a range of advanced materials, including carbon-reinforced fiber composites and HPF-reinforced composites, used in various industries such as aerospace production, electronics, and protective gear. Carbon fibers, known for their exceptional strength-to-weight ratio and non-conductivity, are widely used in lightweight armor for bullet-proof jackets, military vehicles, and sports equipment. PBI fibers, like Polybenzimidazole, offer heat-resistant properties and are used in protective gloves and insulation. However, the high production costs, primarily due to the use of organic solvents and high-priced precursors like PAN in carbon fiber production, pose a significant challenge to market growth. Research and development efforts are underway to explore alternative precursors and production methods to lower costs while maintaining fiber performance. Sustainable fiber development, such as bio-based and recycled fibers, is also gaining traction in emerging sectors like automotive, marine, and industrial fabrics.

Moreover, additive manufacturing and nanotechnology are expected to revolutionize the production of high-performance fibers, leading to advancements in applications such as smart textiles, healthcare, and sports industries. High-performance fibers are used in a variety of applications, including protective gear, automotive, aerospace, and industrial fabrics. Carbon fibers, for instance, are used in lightweight armor for bullet-proof jackets, military vehicles, and sports equipment due to their exceptional strength-to-weight ratio and non-conductivity. PBI fibers, such as Polybenzimidazole, offer heat-resistant properties and are used in protective gloves and insulation. However, the high production costs, primarily due to the use of organic solvents and high-priced precursors like PAN in carbon fiber production, pose a significant challenge to market growth. Hence, the above factors will impede the growth of the market during the forecast period. Hence, the above factors will impede the growth of the market during the forecast period.

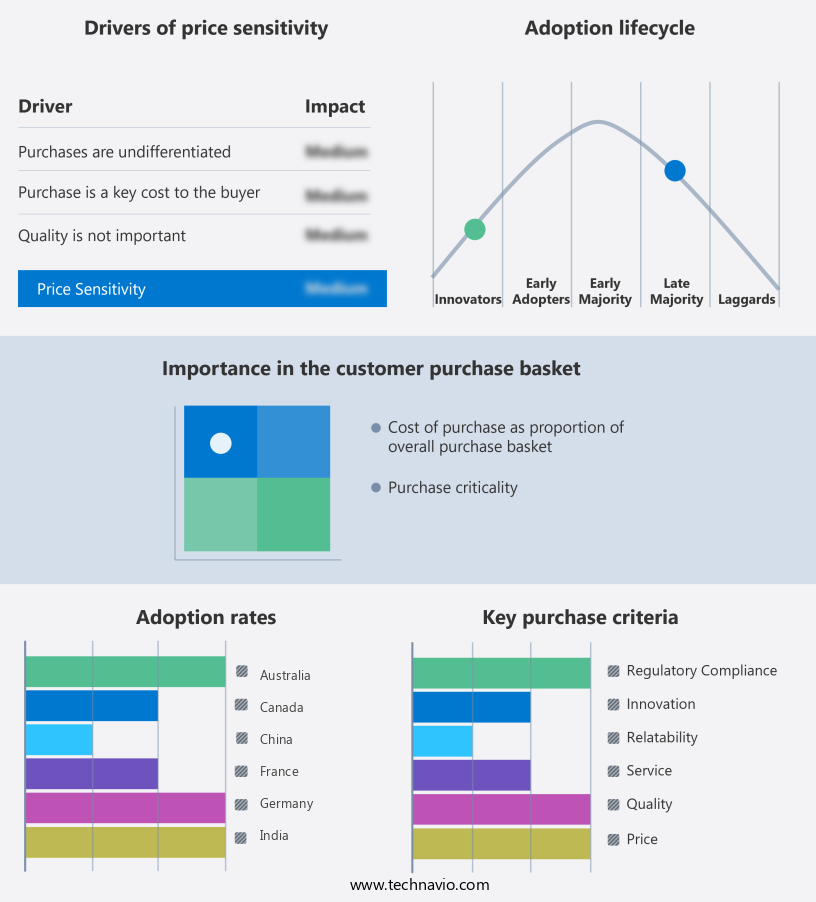
Exclusive Customer Landscape

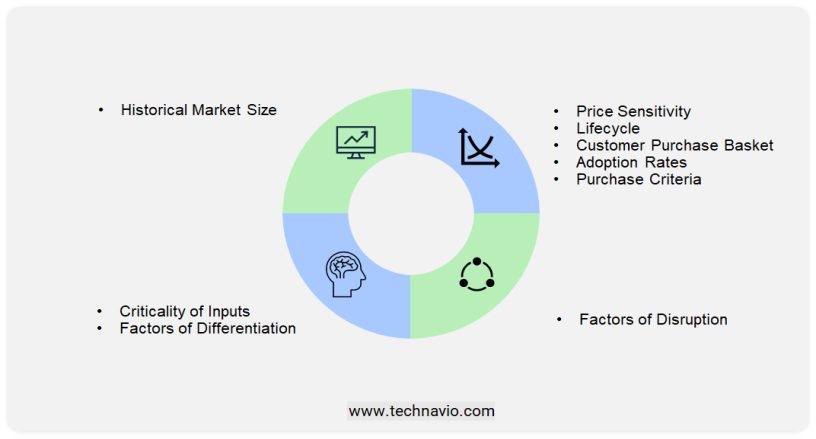
The market forecasting report includes the adoption lifecycle of the market research and growth, covering from the innovator's stage to the laggard's stage. It focuses on adoption rates in different regions based on penetration. Furthermore, the report also includes key purchase criteria and drivers of price sensitivity to help companies evaluate and develop their market growth analysis strategies.

High Performance Fibers Market Share by Geography

 Customer Landscape

Market Analyst Overview

High-performance fibers have gained significant attention in various industries due to their exceptional properties, including high strength-to-weight ratio, chemical resistance, and non-conductivity. These fibers, such as carbon-reinforced fibers and PBI fibers, are increasingly being used in composite materials to enhance the performance of products across multiple sectors. Carbon-reinforced fiber composites are widely used in aerospace production for manufacturing lightweight and strong aircraft components, including chassis and wings. These materials offer superior fuel efficiency, making them an ideal choice for aircraft manufacturers. In addition, carbon fibers are also used in the production of bullet-proof jackets, providing exceptional protection in high-risk situations. Composite materials made from high-performance fibers are also finding applications in the electronics industry. For instance, heat-resistant cushions made from these fibers are used to protect sensitive electronic components from extreme temperatures.

Similarly, protective gloves made from high-performance fibers are used in hazardous environments to provide insulation and protection from chemicals. PBI fibers, specifically polybenzimidazole fibers, are known for their non-conductivity and chemical resistance, making them an excellent choice for use in protective clothing and armor. These fibers are used in the production of lightweight armor for military vehicles and body armor for law enforcement personnel. Research and development in the field of high-performance fibers is ongoing, with a focus on creating eco-friendly alternatives to traditional materials. For instance, bio-based fibers are being developed for use in sports industries, providing sustainable fiber development for use in sportswear and athletic performance equipment. High-performance fibers are also being used in emerging sectors such as smart textiles and healthcare applications.

In addition, the market is advancing with the rise of bio-based resins and bio-sourced materials, promoting eco-conscious design and green chemistry. These fibers, made from eco-friendly materials like natural fibers, offer a low-carbon footprint and are key in sustainable textiles. With applications in fiber optic cables, flame retardant fibers, and fiber reinforced composites, they deliver superior corrosion resistance, high tensile strength, thermal stability, and heat resistance. Fiber reinforced polymers and fiber reinforced concrete are enhancing engine performance and structural integrity, while abrasion resistance and fiber reinforced plastics continue to evolve for future innovations in fiber reinforced composites future and fiber reinforced metals. The market is advancing with the rise of bio-based resins and bio-sourced materials, promoting eco-conscious design and green chemistry. 

Market Scope

Report Coverage

Details

Page number

225

Base year

2024

Historic period

2019 - 2023

Forecast period

2025-2029

Growth momentum & CAGR

Accelerate at a CAGR of 8.4%

Market Growth 2025-2029

USD 6.99 billion

Regional analysis

APAC, North America, Europe, Middle East and Africa, and South America

Performing market contribution

APAC at 45%

Key countries

US, China, Japan, Germany, France, Canada, South Korea, India, UK, and Australia

Competitive landscape

Leading Companies, Market Positioning of Companies, Competitive Strategies, and Industry Risks

Key companies profiled

3M Co., Celanese Corp., Denka Co. Ltd., DuPont de Nemours Inc., Fiber-line, Hexcel Corp., Honeywell International Inc., HS HYOSUNG ADVANCED MATERIALS, Kolon Industries Inc., Kureha Corp., Mitsubishi Chemical Group Corp., Nexstar Extrusions Pvt Ltd, PT Asia Pacific Fibers Tbk, SGL Carbon SE, Stein Fibers Ltd., Syensqo SA, Teijin Ltd., Toray Industries Inc., and United Shield International LLC

Market Segmentation

Type (Carbon fibers, Aramid fibers, Polyethylene fibers, Glass fibers, and Others), Application (Aerospace and defense, Automotive, Electronics and electrical, Construction, and Others), and Geography (APAC, North America, Europe, Middle East and Africa, and South America)

Customization purview

If our market report has not included the data that you are looking for, you can reach out to our analysts and get segments customized.

Download PDF Sample

What are the Key Data Covered in this Market Research Report?

  • CAGR of the market during the market forecast period
  • Detailed information on factors that will drive the market growth and forecasting between 2025 and 2029
  • Precise estimation of the size of the market  and its contribution of the market in focus to the parent market
  • Accurate predictions about upcoming market growth and trends and changes in consumer behavior
  • Growth of the market across APAC, North America, Europe, Middle East and Africa, and South America
  • Thorough analysis of the market's competitive landscape and detailed information about companies
  • Comprehensive analysis of factors that will challenge the growth of market companies

1 Executive Summary

  • 1.1 Market overview
    • Executive Summary - Chart on Market Overview
    • Executive Summary - Data Table on Market Overview
    • Executive Summary - Chart on Global Market Characteristics
    • Executive Summary - Chart on Market by Geography
    • Executive Summary - Chart on Market Segmentation by Type
    • Executive Summary - Chart on Market Segmentation by Application
    • Executive Summary - Chart on Incremental Growth
    • Executive Summary - Data Table on Incremental Growth
    • Executive Summary - Chart on Company Market Positioning

2 Technavio Analysis

  • 2.1 Analysis of price sensitivity, lifecycle, customer purchase basket, adoption rates, and purchase criteria
    • Analysis of price sensitivity, lifecycle, customer purchase basket, adoption rates, and purchase criteria
  • 2.2 Criticality of inputs and Factors of differentiation
    • Overview on criticality of inputs and factors of differentiation
  • 2.3 Factors of disruption
    • Overview on factors of disruption
  • 2.4 Impact of drivers and challenges
    • Impact of drivers and challenges in 2024 and 2029

3 Market Landscape

  • 3.1 Market ecosystem
    • Parent Market
    • Data Table on - Parent Market
  • 3.2 Market characteristics
    • Market characteristics analysis
  • 3.3 Value chain analysis
    • Value chain analysis

4 Market Sizing

  • 4.1 Market definition
    • Offerings of companies included in the market definition
  • 4.2 Market segment analysis
    • Market segments
  • 4.3 Market size 2024
    • 4.4 Market outlook: Forecast for 2024-2029
      • Chart on Global - Market size and forecast 2024-2029 ($ million)
      • Data Table on Global - Market size and forecast 2024-2029 ($ million)
      • Chart on Global Market: Year-over-year growth 2024-2029 (%)
      • Data Table on Global Market: Year-over-year growth 2024-2029 (%)

    5 Historic Market Size

    • 5.1 Global High Performance Fibers Market 2019 - 2023
      • Historic Market Size - Data Table on Global High Performance Fibers Market 2019 - 2023 ($ million)
    • 5.2 Type segment analysis 2019 - 2023
      • Historic Market Size - Type Segment 2019 - 2023 ($ million)
    • 5.3 Application segment analysis 2019 - 2023
      • Historic Market Size - Application Segment 2019 - 2023 ($ million)
    • 5.4 Geography segment analysis 2019 - 2023
      • Historic Market Size - Geography Segment 2019 - 2023 ($ million)
    • 5.5 Country segment analysis 2019 - 2023
      • Historic Market Size - Country Segment 2019 - 2023 ($ million)

    6 Qualitative Analysis

    • 6.1 Impact of AI on the Global High Performance Fibers Market

      7 Five Forces Analysis

      • 7.1 Five forces summary
        • Five forces analysis - Comparison between 2024 and 2029
      • 7.2 Bargaining power of buyers
        • Bargaining power of buyers - Impact of key factors 2024 and 2029
      • 7.3 Bargaining power of suppliers
        • Bargaining power of suppliers - Impact of key factors in 2024 and 2029
      • 7.4 Threat of new entrants
        • Threat of new entrants - Impact of key factors in 2024 and 2029
      • 7.5 Threat of substitutes
        • Threat of substitutes - Impact of key factors in 2024 and 2029
      • 7.6 Threat of rivalry
        • Threat of rivalry - Impact of key factors in 2024 and 2029
      • 7.7 Market condition
        • Chart on Market condition - Five forces 2024 and 2029

      8 Market Segmentation by Type

      • 8.1 Market segments
        • Chart on Type - Market share 2024-2029 (%)
        • Data Table on Type - Market share 2024-2029 (%)
      • 8.2 Comparison by Type
        • Chart on Comparison by Type
        • Data Table on Comparison by Type
      • 8.3 Carbon fibers - Market size and forecast 2024-2029
        • Chart on Carbon fibers - Market size and forecast 2024-2029 ($ million)
        • Data Table on Carbon fibers - Market size and forecast 2024-2029 ($ million)
        • Chart on Carbon fibers - Year-over-year growth 2024-2029 (%)
        • Data Table on Carbon fibers - Year-over-year growth 2024-2029 (%)
      • 8.4 Aramid fibers - Market size and forecast 2024-2029
        • Chart on Aramid fibers - Market size and forecast 2024-2029 ($ million)
        • Data Table on Aramid fibers - Market size and forecast 2024-2029 ($ million)
        • Chart on Aramid fibers - Year-over-year growth 2024-2029 (%)
        • Data Table on Aramid fibers - Year-over-year growth 2024-2029 (%)
      • 8.5 Polyethylene fibers - Market size and forecast 2024-2029
        • Chart on Polyethylene fibers - Market size and forecast 2024-2029 ($ million)
        • Data Table on Polyethylene fibers - Market size and forecast 2024-2029 ($ million)
        • Chart on Polyethylene fibers - Year-over-year growth 2024-2029 (%)
        • Data Table on Polyethylene fibers - Year-over-year growth 2024-2029 (%)
      • 8.6 Glass fibers - Market size and forecast 2024-2029
        • Chart on Glass fibers - Market size and forecast 2024-2029 ($ million)
        • Data Table on Glass fibers - Market size and forecast 2024-2029 ($ million)
        • Chart on Glass fibers - Year-over-year growth 2024-2029 (%)
        • Data Table on Glass fibers - Year-over-year growth 2024-2029 (%)
      • 8.7 Others - Market size and forecast 2024-2029
        • Chart on Others - Market size and forecast 2024-2029 ($ million)
        • Data Table on Others - Market size and forecast 2024-2029 ($ million)
        • Chart on Others - Year-over-year growth 2024-2029 (%)
        • Data Table on Others - Year-over-year growth 2024-2029 (%)
      • 8.8 Market opportunity by Type
        • Market opportunity by Type ($ million)
        • Data Table on Market opportunity by Type ($ million)

      9 Market Segmentation by Application

      • 9.1 Market segments
        • Chart on Application - Market share 2024-2029 (%)
        • Data Table on Application - Market share 2024-2029 (%)
      • 9.2 Comparison by Application
        • Chart on Comparison by Application
        • Data Table on Comparison by Application
      • 9.3 Aerospace and defense - Market size and forecast 2024-2029
        • Chart on Aerospace and defense - Market size and forecast 2024-2029 ($ million)
        • Data Table on Aerospace and defense - Market size and forecast 2024-2029 ($ million)
        • Chart on Aerospace and defense - Year-over-year growth 2024-2029 (%)
        • Data Table on Aerospace and defense - Year-over-year growth 2024-2029 (%)
      • 9.4 Automotive - Market size and forecast 2024-2029
        • Chart on Automotive - Market size and forecast 2024-2029 ($ million)
        • Data Table on Automotive - Market size and forecast 2024-2029 ($ million)
        • Chart on Automotive - Year-over-year growth 2024-2029 (%)
        • Data Table on Automotive - Year-over-year growth 2024-2029 (%)
      • 9.5 Electronics and electrical - Market size and forecast 2024-2029
        • Chart on Electronics and electrical - Market size and forecast 2024-2029 ($ million)
        • Data Table on Electronics and electrical - Market size and forecast 2024-2029 ($ million)
        • Chart on Electronics and electrical - Year-over-year growth 2024-2029 (%)
        • Data Table on Electronics and electrical - Year-over-year growth 2024-2029 (%)
      • 9.6 Construction - Market size and forecast 2024-2029
        • Chart on Construction - Market size and forecast 2024-2029 ($ million)
        • Data Table on Construction - Market size and forecast 2024-2029 ($ million)
        • Chart on Construction - Year-over-year growth 2024-2029 (%)
        • Data Table on Construction - Year-over-year growth 2024-2029 (%)
      • 9.7 Others - Market size and forecast 2024-2029
        • Chart on Others - Market size and forecast 2024-2029 ($ million)
        • Data Table on Others - Market size and forecast 2024-2029 ($ million)
        • Chart on Others - Year-over-year growth 2024-2029 (%)
        • Data Table on Others - Year-over-year growth 2024-2029 (%)
      • 9.8 Market opportunity by Application
        • Market opportunity by Application ($ million)
        • Data Table on Market opportunity by Application ($ million)

      10 Customer Landscape

      • 10.1 Customer landscape overview
        • Analysis of price sensitivity, lifecycle, customer purchase basket, adoption rates, and purchase criteria

      11 Geographic Landscape

      • 11.1 Geographic segmentation
        • Chart on Market share by geography 2024-2029 (%)
        • Data Table on Market share by geography 2024-2029 (%)
      • 11.2 Geographic comparison
        • Chart on Geographic comparison
        • Data Table on Geographic comparison
      • 11.3 APAC - Market size and forecast 2024-2029
        • Chart on APAC - Market size and forecast 2024-2029 ($ million)
        • Data Table on APAC - Market size and forecast 2024-2029 ($ million)
        • Chart on APAC - Year-over-year growth 2024-2029 (%)
        • Data Table on APAC - Year-over-year growth 2024-2029 (%)
      • 11.4 North America - Market size and forecast 2024-2029
        • Chart on North America - Market size and forecast 2024-2029 ($ million)
        • Data Table on North America - Market size and forecast 2024-2029 ($ million)
        • Chart on North America - Year-over-year growth 2024-2029 (%)
        • Data Table on North America - Year-over-year growth 2024-2029 (%)
      • 11.5 Europe - Market size and forecast 2024-2029
        • Chart on Europe - Market size and forecast 2024-2029 ($ million)
        • Data Table on Europe - Market size and forecast 2024-2029 ($ million)
        • Chart on Europe - Year-over-year growth 2024-2029 (%)
        • Data Table on Europe - Year-over-year growth 2024-2029 (%)
      • 11.6 Middle East and Africa - Market size and forecast 2024-2029
        • Chart on Middle East and Africa - Market size and forecast 2024-2029 ($ million)
        • Data Table on Middle East and Africa - Market size and forecast 2024-2029 ($ million)
        • Chart on Middle East and Africa - Year-over-year growth 2024-2029 (%)
        • Data Table on Middle East and Africa - Year-over-year growth 2024-2029 (%)
      • 11.7 South America - Market size and forecast 2024-2029
        • Chart on South America - Market size and forecast 2024-2029 ($ million)
        • Data Table on South America - Market size and forecast 2024-2029 ($ million)
        • Chart on South America - Year-over-year growth 2024-2029 (%)
        • Data Table on South America - Year-over-year growth 2024-2029 (%)
      • 11.8 US - Market size and forecast 2024-2029
        • Chart on US - Market size and forecast 2024-2029 ($ million)
        • Data Table on US - Market size and forecast 2024-2029 ($ million)
        • Chart on US - Year-over-year growth 2024-2029 (%)
        • Data Table on US - Year-over-year growth 2024-2029 (%)
      • 11.9 China - Market size and forecast 2024-2029
        • Chart on China - Market size and forecast 2024-2029 ($ million)
        • Data Table on China - Market size and forecast 2024-2029 ($ million)
        • Chart on China - Year-over-year growth 2024-2029 (%)
        • Data Table on China - Year-over-year growth 2024-2029 (%)
      • 11.10 Japan - Market size and forecast 2024-2029
        • Chart on Japan - Market size and forecast 2024-2029 ($ million)
        • Data Table on Japan - Market size and forecast 2024-2029 ($ million)
        • Chart on Japan - Year-over-year growth 2024-2029 (%)
        • Data Table on Japan - Year-over-year growth 2024-2029 (%)
      • 11.11 Germany - Market size and forecast 2024-2029
        • Chart on Germany - Market size and forecast 2024-2029 ($ million)
        • Data Table on Germany - Market size and forecast 2024-2029 ($ million)
        • Chart on Germany - Year-over-year growth 2024-2029 (%)
        • Data Table on Germany - Year-over-year growth 2024-2029 (%)
      • 11.12 France - Market size and forecast 2024-2029
        • Chart on France - Market size and forecast 2024-2029 ($ million)
        • Data Table on France - Market size and forecast 2024-2029 ($ million)
        • Chart on France - Year-over-year growth 2024-2029 (%)
        • Data Table on France - Year-over-year growth 2024-2029 (%)
      • 11.13 Canada - Market size and forecast 2024-2029
        • Chart on Canada - Market size and forecast 2024-2029 ($ million)
        • Data Table on Canada - Market size and forecast 2024-2029 ($ million)
        • Chart on Canada - Year-over-year growth 2024-2029 (%)
        • Data Table on Canada - Year-over-year growth 2024-2029 (%)
      • 11.14 South Korea - Market size and forecast 2024-2029
        • Chart on South Korea - Market size and forecast 2024-2029 ($ million)
        • Data Table on South Korea - Market size and forecast 2024-2029 ($ million)
        • Chart on South Korea - Year-over-year growth 2024-2029 (%)
        • Data Table on South Korea - Year-over-year growth 2024-2029 (%)
      • 11.15 India - Market size and forecast 2024-2029
        • Chart on India - Market size and forecast 2024-2029 ($ million)
        • Data Table on India - Market size and forecast 2024-2029 ($ million)
        • Chart on India - Year-over-year growth 2024-2029 (%)
        • Data Table on India - Year-over-year growth 2024-2029 (%)
      • 11.16 UK - Market size and forecast 2024-2029
        • Chart on UK - Market size and forecast 2024-2029 ($ million)
        • Data Table on UK - Market size and forecast 2024-2029 ($ million)
        • Chart on UK - Year-over-year growth 2024-2029 (%)
        • Data Table on UK - Year-over-year growth 2024-2029 (%)
      • 11.17 Australia - Market size and forecast 2024-2029
        • Chart on Australia - Market size and forecast 2024-2029 ($ million)
        • Data Table on Australia - Market size and forecast 2024-2029 ($ million)
        • Chart on Australia - Year-over-year growth 2024-2029 (%)
        • Data Table on Australia - Year-over-year growth 2024-2029 (%)
      • 11.18 Market opportunity by geography
        • Market opportunity by geography ($ million)
        • Data Tables on Market opportunity by geography ($ million)

      12 Drivers, Challenges, and Opportunity/Restraints

      • 12.1 Market drivers
        • 12.2 Market challenges
          • 12.3 Impact of drivers and challenges
            • Impact of drivers and challenges in 2024 and 2029
          • 12.4 Market opportunities/restraints

            13 Competitive Landscape

            • 13.1 Overview
              • 13.2 Competitive Landscape
                • Overview on criticality of inputs and factors of differentiation
              • 13.3 Landscape disruption
                • Overview on factors of disruption
              • 13.4 Industry risks
                • Impact of key risks on business

              14 Competitive Analysis

              • 14.1 Companies profiled
                • Companies covered
              • 14.2 Company ranking index
                • Company ranking index
              • 14.3 Market positioning of companies
                • Matrix on companies position and classification
              • 3M Co.
                • 3M Co. - Overview
                • 3M Co. - Business segments
                • 3M Co. - Key news
                • 3M Co. - Key offerings
                • 3M Co. - Segment focus
                • SWOT
              • 14.5 Celanese Corp.
                • Celanese Corp. - Overview
                • Celanese Corp. - Business segments
                • Celanese Corp. - Key news
                • Celanese Corp. - Key offerings
                • Celanese Corp. - Segment focus
                • SWOT
              • 14.6 Denka Co. Ltd.
                • Denka Co. Ltd. - Overview
                • Denka Co. Ltd. - Business segments
                • Denka Co. Ltd. - Key offerings
                • Denka Co. Ltd. - Segment focus
                • SWOT
              • 14.7 DuPont de Nemours Inc.
                • DuPont de Nemours Inc. - Overview
                • DuPont de Nemours Inc. - Business segments
                • DuPont de Nemours Inc. - Key news
                • DuPont de Nemours Inc. - Key offerings
                • DuPont de Nemours Inc. - Segment focus
                • SWOT
              • 14.8 Hexcel Corp.
                • Hexcel Corp. - Overview
                • Hexcel Corp. - Business segments
                • Hexcel Corp. - Key news
                • Hexcel Corp. - Key offerings
                • Hexcel Corp. - Segment focus
                • SWOT
              • 14.9 Honeywell International Inc.
                • Honeywell International Inc. - Overview
                • Honeywell International Inc. - Business segments
                • Honeywell International Inc. - Key news
                • Honeywell International Inc. - Key offerings
                • Honeywell International Inc. - Segment focus
                • SWOT
              • 14.10 HS HYOSUNG ADVANCED MATERIALS
                • HS HYOSUNG ADVANCED MATERIALS - Overview
                • HS HYOSUNG ADVANCED MATERIALS - Product / Service
                • HS HYOSUNG ADVANCED MATERIALS - Key offerings
                • SWOT
              • 14.11 Kolon Industries Inc.
                • Kolon Industries Inc. - Overview
                • Kolon Industries Inc. - Business segments
                • Kolon Industries Inc. - Key offerings
                • Kolon Industries Inc. - Segment focus
                • SWOT
              • 14.12 Kureha Corp.
                • Kureha Corp. - Overview
                • Kureha Corp. - Business segments
                • Kureha Corp. - Key news
                • Kureha Corp. - Key offerings
                • Kureha Corp. - Segment focus
                • SWOT
              • 14.13 Mitsubishi Chemical Group Corp.
                • Mitsubishi Chemical Group Corp. - Overview
                • Mitsubishi Chemical Group Corp. - Business segments
                • Mitsubishi Chemical Group Corp. - Key news
                • Mitsubishi Chemical Group Corp. - Key offerings
                • Mitsubishi Chemical Group Corp. - Segment focus
                • SWOT
              • 14.14 PT Asia Pacific Fibers Tbk
                • PT Asia Pacific Fibers Tbk - Overview
                • PT Asia Pacific Fibers Tbk - Product / Service
                • PT Asia Pacific Fibers Tbk - Key offerings
                • SWOT
              • 14.15 SGL Carbon SE
                • SGL Carbon SE - Overview
                • SGL Carbon SE - Business segments
                • SGL Carbon SE - Key news
                • SGL Carbon SE - Key offerings
                • SGL Carbon SE - Segment focus
                • SWOT
              • 14.16 Syensqo SA
                • Syensqo SA - Overview
                • Syensqo SA - Product / Service
                • Syensqo SA - Key offerings
                • SWOT
              • 14.17 Teijin Ltd.
                • Teijin Ltd. - Overview
                • Teijin Ltd. - Business segments
                • Teijin Ltd. - Key news
                • Teijin Ltd. - Key offerings
                • Teijin Ltd. - Segment focus
                • SWOT
              • 14.18 Toray Industries Inc.
                • Toray Industries Inc. - Overview
                • Toray Industries Inc. - Business segments
                • Toray Industries Inc. - Key news
                • Toray Industries Inc. - Key offerings
                • Toray Industries Inc. - Segment focus
                • SWOT

              15 Appendix

              • 15.1 Scope of the report
                • 15.2 Inclusions and exclusions checklist
                  • Inclusions checklist
                  • Exclusions checklist
                • 15.3 Currency conversion rates for US$
                  • Currency conversion rates for US$
                • 15.4 Research methodology
                  • Research methodology
                • 15.5 Data procurement
                  • Information sources
                • 15.6 Data validation
                  • Data validation
                • 15.7 Validation techniques employed for market sizing
                  • Validation techniques employed for market sizing
                • 15.8 Data synthesis
                  • Data synthesis
                • 15.9 360 degree market analysis
                  • 360 degree market analysis
                • 15.10 List of abbreviations
                  • List of abbreviations

                Research Methodology

                Technavio presents a detailed picture of the market by way of study, synthesis, and summation of data from multiple sources. The analysts have presented the various facets of the market with a particular focus on identifying the key industry influencers. The data thus presented is comprehensive, reliable, and the result of extensive research, both primary and secondary.

                INFORMATION SOURCES

                Primary sources

                • Manufacturers and suppliers
                • Channel partners
                • Industry experts
                • Strategic decision makers

                Secondary sources

                • Industry journals and periodicals
                • Government data
                • Financial reports of key industry players
                • Historical data
                • Press releases

                DATA ANALYSIS

                Data Synthesis

                • Collation of data
                • Estimation of key figures
                • Analysis of derived insights

                Data Validation

                • Triangulation with data models
                • Reference against proprietary databases
                • Corroboration with industry experts

                REPORT WRITING

                Qualitative

                • Market drivers
                • Market challenges
                • Market trends
                • Five forces analysis

                Quantitative

                • Market size and forecast
                • Market segmentation
                • Geographical insights
                • Competitive landscape

                Interested in this report?

                Get your sample now to see our research methodology and insights!

                Download Now

                Frequently Asked Questions

                High Performance Fibers market growth will increase by $ 6989 mn during 2025-2029.

                The High Performance Fibers market is expected to grow at a CAGR of 8.4% during 2025-2029.

                High Performance Fibers market is segmented by Type( Carbon fibers, Aramid fibers, Polyethylene fibers, Glass fibers, Others) Application( Aerospace and defense, Automotive, Electronics and electrical, Construction, Others)

                3M Co., Celanese Corp., Denka Co. Ltd., DuPont de Nemours Inc., Fiber-line, Hexcel Corp., Honeywell International Inc., HS HYOSUNG ADVANCED MATERIALS, Kolon Industries Inc., Kureha Corp., Mitsubishi Chemical Group Corp., Nexstar Extrusions Pvt Ltd, PT Asia Pacific Fibers Tbk, SGL Carbon SE, Stein Fibers Ltd., Syensqo SA, Teijin Ltd., Toray Industries Inc., United Shield International LLC are a few of the key vendors in the High Performance Fibers market.

                APAC will register the highest growth rate of 45% among the other regions. Therefore, the High Performance Fibers market in APAC is expected to garner significant business opportunities for the vendors during the forecast period.

                US, China, Japan, Germany, France, Canada, South Korea, India, UK, Australia

                • Increasing need for lightweight high performance fibersThe global high performance fibers market is experiencing robust growth driven by the increasing demand for lightweight materials. This trend is particularly evident in the automotive sector is the driving factor this market.
                • where manufacturers are seeking innovative solutions to enhance vehicle efficiency and performance. A significant development in this area occurred in April 2024 is the driving factor this market.
                • when Hyundai Motor Group entered into a strategic cooperation agreement with Toray Industries. This partnership aims to advance material innovation is the driving factor this market.
                • marking a pivotal step in the future mobility strategy of Hyundai. The collaboration with Toray Industries is integral to the comprehensive approach of Hyundai to mobility is the driving factor this market.
                • which includes not only electrification and software-defined vehicles (SDVs) but also fundamental advancements in material technology. By leveraging the expertise of Toray in high performance fibers is the driving factor this market.
                • Hyundai aims to develop lightweight materials that can significantly reduce vehicle weight is the driving factor this market.
                • thereby improving fuel efficiency and reducing emissions. This aligns with the broader market trend toward sustainability and environmental responsibility.Lightweight high performance fibers is the driving factor this market.
                • such as carbon fibers and advanced composites is the driving factor this market.
                • are increasingly being adopted in the automotive market due to their superior strength-to-weight ratio. These materials enable manufacturers to produce vehicles that are not only lighter but also stronger and more durable. The use of such fibers is crucial in the development of electric vehicles (EVs) and hybrid vehicles is the driving factor this market.
                • where reducing weight is essential to maximizing battery life and overall efficiency. The growing emphasis on lightweight materials is also driven by regulatory pressures to meet stringent emission standards and the rising consumer demand for environmentally friendly vehicles. As a result is the driving factor this market.
                • the high performance fibers market is poised for significant expansion is the driving factor this market.
                • with automotive applications leading the charge.In conclusion is the driving factor this market.
                • the increasing demand for lightweight high performance fibers is a key driver of growth in the market. Strategic partnerships is the driving factor this market.
                • like the one between Hyundai Motor Group and Toray Industries is the driving factor this market.
                • highlight the critical role of material innovation in shaping the future of mobility. This trend is expected to accelerate is the driving factor this market.
                • fostering advancements in high performance fiber technology and driving the evolution of the market toward more sustainable and efficient solutions. is the driving factor this market.

                The High Performance Fibers market vendors should focus on grabbing business opportunities from the Carbon fibers segment as it accounted for the largest market share in the base year.