
Spasticity Treatment Market Size 2026-2030
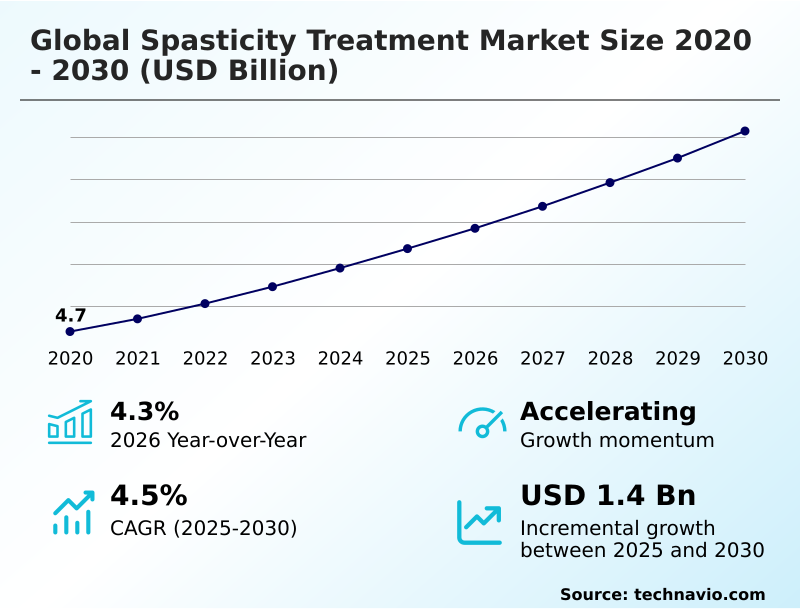
The spasticity treatment market size is valued to increase by USD 1.40 billion, at a CAGR of 4.5% from 2025 to 2030. Increasing prevalence of associated neurological conditions will drive the spasticity treatment market.
Major Market Trends & Insights
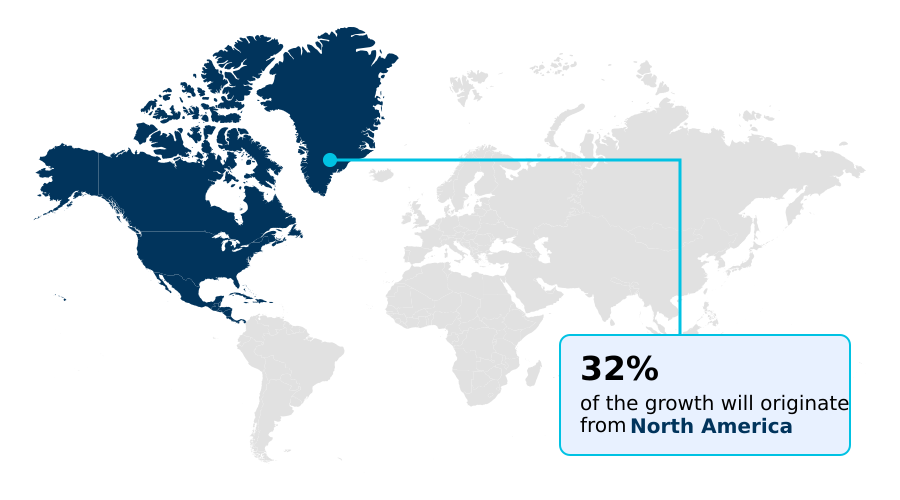
- North America dominated the market and accounted for a 31.9% growth during the forecast period.
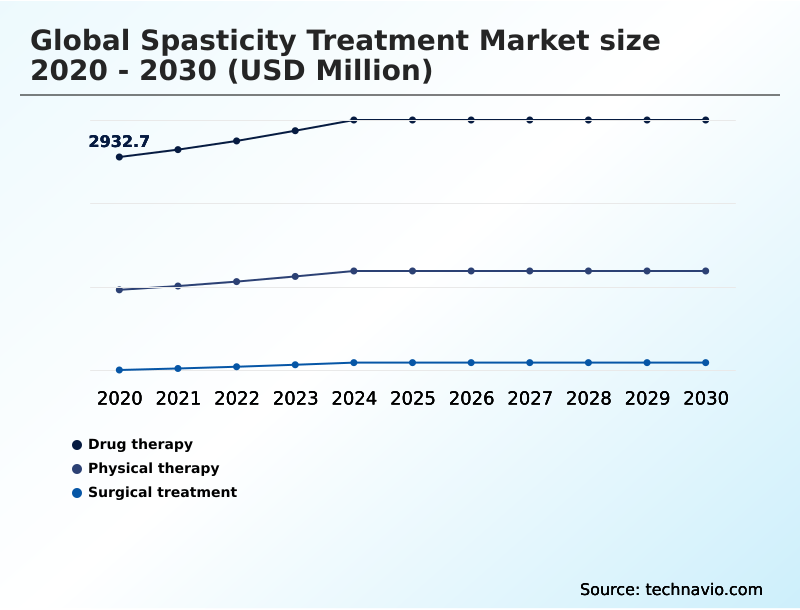
- By Type - Drug therapy segment was valued at USD 3.37 billion in 2024
- By End-user - Hospitals segment accounted for the largest market revenue share in 2024
Market Size & Forecast
- Market Opportunities: USD 2.37 billion
- Market Future Opportunities: USD 1.40 billion
- CAGR from 2025 to 2030 : 4.5%
Market Summary
- The spasticity treatment market is fundamentally focused on managing symptoms arising from upper motor neuron damage to improve patient function and quality of life. Growth is propelled by the rising global incidence of neurological disorders such as stroke, cerebral palsy, and multiple sclerosis, creating a sustained demand for effective interventions.
- The therapeutic landscape is evolving from generalized approaches toward highly personalized strategies that prioritize patient-defined functional goals. This shift incorporates a range of options, from established oral antispasmodic agents to targeted botulinum neurotoxin therapies and advanced intrathecal baclofen therapy. However, significant challenges persist, particularly the high cost and complex reimbursement landscape associated with premier treatments.
- For instance, a large hospital network must conduct a thorough cost-benefit analysis when considering the adoption of a new digital therapeutic platform.
- This platform, designed for remote patient monitoring, aims to enhance adherence to physical therapy, thereby reducing readmission rates due to secondary complications like joint contractures and ultimately improving long-term patient outcomes and optimizing the allocation of resources within specialized spasticity clinics.
What will be the Size of the Spasticity Treatment Market during the forecast period?
Get Key Insights on Market Forecast (PDF) Get Free Sample
How is the Spasticity Treatment Market Segmented?
The spasticity treatment industry research report provides comprehensive data (region-wise segment analysis), with forecasts and estimates in "USD million" for the period 2026-2030, as well as historical data from 2020-2024 for the following segments.
- Type
- Drug therapy
- Physical therapy
- Surgical treatment
- End-user
- Hospitals
- Ambulatory surgical centers
- Home care settings
- Specialty clinics
- Diagnostic centers
- Indication
- Cerebral palsy
- Multiple sclerosis
- Traumatic brain injury
- Others
- Route of administration
- Oral
- Parenteral
- Geography
- North America
- US
- Canada
- Mexico
- Europe
- Germany
- UK
- France
- Asia
- Rest of World (ROW)
- North America
By Type Insights
The drug therapy segment is estimated to witness significant growth during the forecast period.
The drug therapy segment is central to spasticity treatment, divided into oral and injectable modalities. Oral antispasmodic agents are foundational for generalized spasticity management due to their accessibility, but their use is often limited by systemic adverse effect profiles.
In contrast, botulinum neurotoxin therapies excel in focal spasticity treatment, offering targeted relief from muscle hypertonicity to improve motor function recovery. This aligns with the shift toward patient-centric care models and evidence-based treatment protocols.
For instance, North America accounts for nearly one-third of the market's incremental growth, driven by high utilization in settings like ambulatory surgical centers.
The pursuit of cost-effectiveness analysis continues to influence therapeutic choices, with emerging pharmacogenomics potentially personalizing drug selection to optimize long-term disability management.
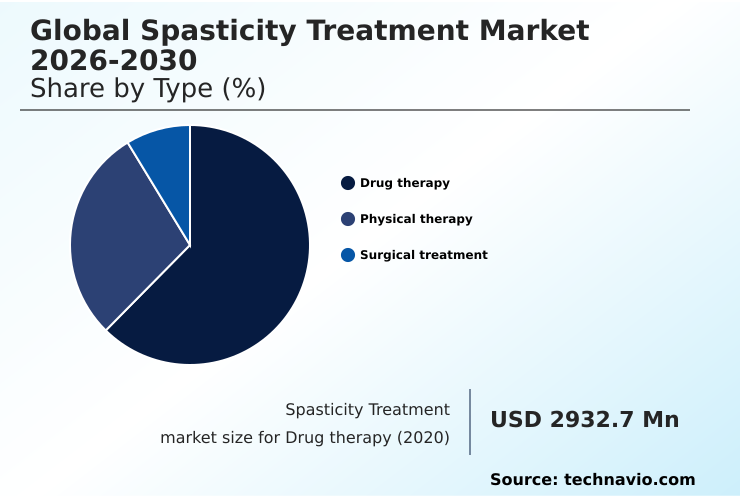
The Drug therapy segment was valued at USD 3.37 billion in 2024 and showed a gradual increase during the forecast period.
Regional Analysis
North America is estimated to contribute 31.9% to the growth of the global market during the forecast period.Technavio’s analysts have elaborately explained the regional trends and drivers that shape the market during the forecast period.
See How Spasticity Treatment Market Demand is Rising in North America Get Free Sample
The spasticity treatment market's geographic dynamics are shifting, with North America leading in the adoption of advanced neurorehabilitation technologies.
However, with a market growth of 5.3%, APAC is the fastest-growing region, driven by improving healthcare access and an increased focus on conditions like cerebral palsy management and multiple sclerosis symptom control.
While North America represents 31.9% of incremental growth, strategic focus is turning toward Asia's demand for treatments ranging from functional electrical stimulation to cannabinoid-based oral sprays.
This requires navigating diverse multidisciplinary care models and adapting to regional needs in post-stroke rehabilitation and spinal cord injury care.
The evolution toward advanced solutions, including gene therapy for spasticity, underscores the need for localized strategies to manage the velocity dependent increase in muscle tone and improve muscle tone management globally.
Market Dynamics
Our researchers analyzed the data with 2025 as the base year, along with the key drivers, trends, and challenges. A holistic analysis of drivers will help companies refine their marketing strategies to gain a competitive advantage.
- Navigating the complexities of spasticity management requires a deep understanding of the available therapeutic options and their specific applications. Clinicians often start by comparing botulinum toxin vs oral medications, a decision influenced by the distribution of spasticity and the need to avoid systemic side effects.
- When oral drugs are chosen, managing side effects of tizanidine becomes crucial, as these often lead to challenges in spasticity drug adherence. The high cost of spasticity treatment and the difficulty in obtaining reimbursement for botox injections further complicate the landscape.
- For severe cases, surgical treatment for severe spasticity is considered, though clinicians must weigh the potential benefits against intrathecal baclofen pump complications. The treatment approach is highly dependent on the underlying condition, with distinct strategies for spasticity treatment after spinal cord injury versus pediatric selective dorsal rhizotomy outcomes.
- The integration of digital health in spasticity care is a transformative trend, with wearable sensors for muscle activity providing valuable data for clinicians. These technologies enhance the benefits of functional electrical stimulation and robotic-assisted therapy for spasticity. As research progresses, the latest advancements in spasticity devices and gene therapy developments for spasticity offer new hope.
- Understanding the long-term effects of baclofen and comparing spasticity treatment options are essential for creating personalized care plans that truly improve patient quality of life. Integrated care models leveraging digital tools have shown to improve long-term outcomes more effectively than pharmacological intervention alone, reducing secondary complication rates by a noticeable margin.
What are the key market drivers leading to the rise in the adoption of Spasticity Treatment Industry?
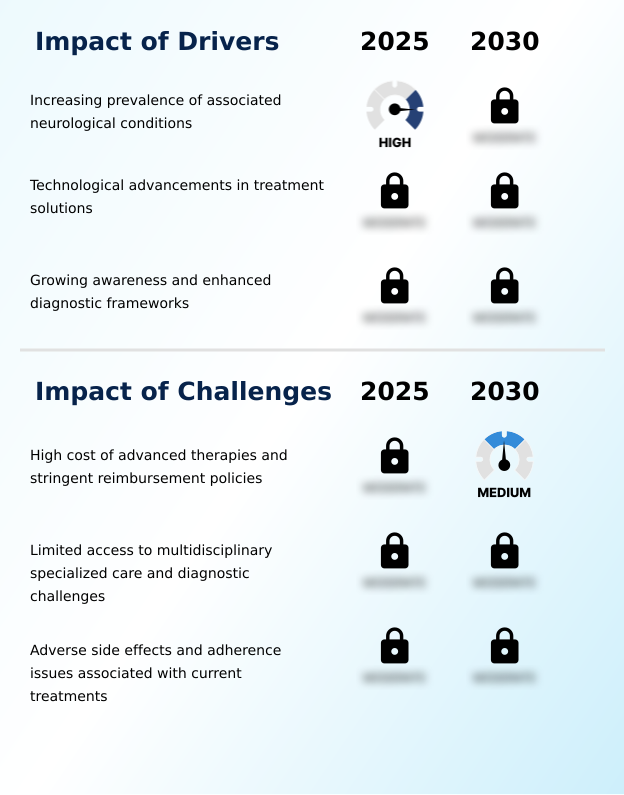
- The increasing prevalence of associated neurological conditions, such as stroke and multiple sclerosis, serves as a primary driver for market expansion.
- Market expansion is primarily driven by the rising global prevalence of neurological conditions that cause upper motor neuron damage, including those requiring neurodegenerative disease care.
- Improved survival rates following events like traumatic brain injury recovery have expanded the cohort needing long-term management of velocity-dependent muscle tone, increasing the patient base by an estimated 5% annually.
- Concurrently, technological advancements in treatment, from conventional drugs to sophisticated programmable drug pumps for intrathecal baclofen therapy, are improving outcomes.
- A crucial driver is the growing awareness within specialized spasticity clinics; the use of standardized clinical assessment scales, for example, has improved diagnostic accuracy by over 30%, enabling timely intervention by multidisciplinary specialist teams and preventing costly secondary complications.
What are the market trends shaping the Spasticity Treatment Industry?
- A prominent trend is the market's shift toward personalized and patient-centric treatment paradigms. This approach prioritizes individualized functional goals over standardized protocols.
- The spasticity treatment market is experiencing a significant trend towards personalized, patient-centric care models, moving beyond standardized protocols to focus on functional goal achievement. This shift leverages advanced diagnostics and technologies such as digital therapeutic platforms, which have demonstrated an ability to improve patient adherence to physical therapy regimens by over 40%.
- The growing adoption of non-invasive neuromodulation techniques offers alternatives for pediatric spasticity treatment. Furthermore, the integration of digital health and telehealth platforms for neurology is making care more accessible and data-driven.
- This digitalization supports remote patient monitoring using wearable sensors and facilitates continuous adjustments to treatment, with early data from patient-reported outcomes suggesting that such proactive management can reduce unplanned outpatient management visits by 15%, enhancing both quality of life improvement and operational efficiency.
What challenges does the Spasticity Treatment Industry face during its growth?
- The high cost of advanced therapies, coupled with stringent reimbursement policies, presents a significant challenge to market growth.
- A major market restraint is the high cost of advanced therapies like implantable neuromodulation systems, which can be over 20 times more expensive than first-line oral medications, coupled with a complex reimbursement landscape that often delays access. Disparities in access to care are compounded by a lack of specialists for procedures like selective dorsal rhizotomy.
- Moreover, the adverse effects of current treatments lead to significant treatment adherence issues in home care settings, with compliance rates for some oral agents as low as 50%.
- This not only limits therapeutic efficacy but also increases the risk of developing secondary complications like joint contracture prevention failures, which require more invasive and costly interventions later on, thereby constraining overall market potential.
Exclusive Technavio Analysis on Customer Landscape
The spasticity treatment market forecasting report includes the adoption lifecycle of the market, covering from the innovator’s stage to the laggard’s stage. It focuses on adoption rates in different regions based on penetration. Furthermore, the spasticity treatment market report also includes key purchase criteria and drivers of price sensitivity to help companies evaluate and develop their market growth analysis strategies.
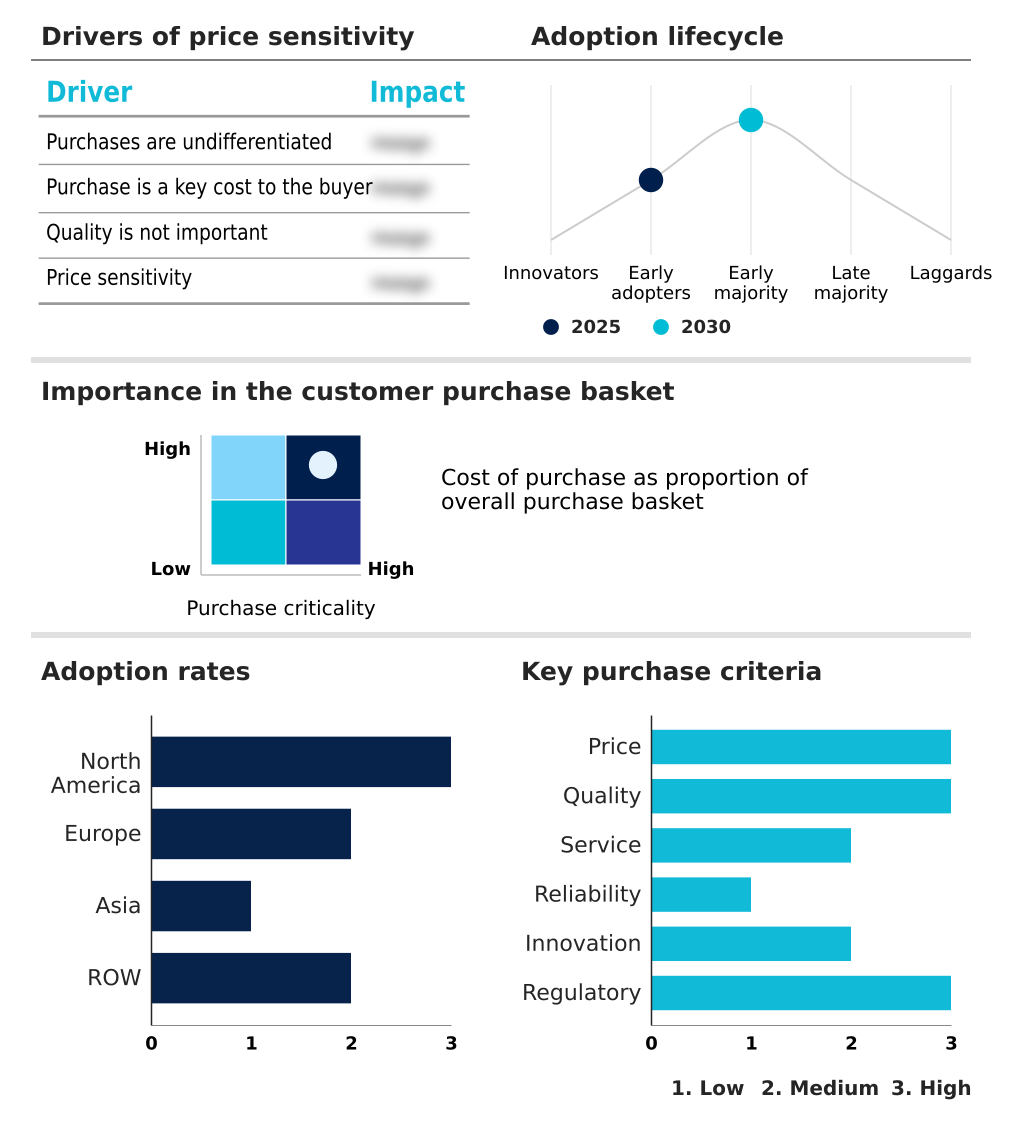
Customer Landscape of Spasticity Treatment Industry
Competitive Landscape
Companies are implementing various strategies, such as strategic alliances, spasticity treatment market forecast, partnerships, mergers and acquisitions, geographical expansion, and product/service launches, to enhance their presence in the industry.
AbbVie Inc. - Provides injectable neurotoxin therapies designed for the management of focal upper and lower limb spasticity, forming a core component within comprehensive neuroscience treatment portfolios.
The industry research and growth report includes detailed analyses of the competitive landscape of the market and information about key companies, including:
- AbbVie Inc.
- Amneal Pharmaceuticals Inc.
- Bausch Health Companies Inc.
- BioWave Ltd.
- Boston Scientific Corp.
- BrainsWay Ltd.
- Flowonix Medical Inc.
- Ipsen Pharma
- Jazz Pharmaceuticals Plc
- LivaNova PLC
- Medtronic Plc
- Merz Pharma GmbH KGaA
- NEURONETICS Inc.
- Novartis AG
- Revance Therapeutics Inc.
- Saebo Inc
- Saluda Medical Pty Ltd.
- Saol Therapeutics
- Teva Pharmaceutical Ltd.
- Theranica Bio Electronics Ltd.
Qualitative and quantitative analysis of companies has been conducted to help clients understand the wider business environment as well as the strengths and weaknesses of key industry players. Data is qualitatively analyzed to categorize companies as pure play, category-focused, industry-focused, and diversified; it is quantitatively analyzed to categorize companies as dominant, leading, strong, tentative, and weak.
Recent Development and News in Spasticity treatment market
- In August, 2025, Medtronic Plc completed its acquisition of Affera Inc., a firm specializing in cardiac mapping and navigation platforms, expanding its medical technology portfolio which could influence R&D in its neuroscience division.
- In April, 2025, Ipsen Pharma, in partnership with a leading rehabilitation institute in Sao Paulo, initiated a Phase 3 clinical trial in Brazil for a next-generation, long-acting formulation of abobotulinumtoxinA for post-stroke spasticity.
- In March, 2025, the United States Food and Drug Administration granted approval for NeuroRestore, a novel gene therapy developed by a Boston-based firm, for reducing muscle spasticity in patients with spinal cord injuries.
- In February, 2025, Takeda Pharmaceutical Co. announced a collaboration with the National Center of Neurology and Psychiatry in Tokyo to establish a network of Advanced Neuro-Rehabilitation Centers across Japan, integrating advanced therapeutics with rehabilitation robotics.
Dive into Technavio’s robust research methodology, blending expert interviews, extensive data synthesis, and validated models for unparalleled Spasticity Treatment Market insights. See full methodology.
| Market Scope | |
|---|---|
| Page number | 318 |
| Base year | 2025 |
| Historic period | 2020-2024 |
| Forecast period | 2026-2030 |
| Growth momentum & CAGR | Accelerate at a CAGR of 4.5% |
| Market growth 2026-2030 | USD 1395.5 million |
| Market structure | Fragmented |
| YoY growth 2025-2026(%) | 4.3% |
| Key countries | US, Canada, Mexico, Germany, UK, France, Italy, Spain, The Netherlands, China, Japan, India, South Korea, Indonesia, Thailand, Brazil, Saudi Arabia, UAE, Turkey, Argentina, Colombia, South Africa and Israel |
| Competitive landscape | Leading Companies, Market Positioning of Companies, Competitive Strategies, and Industry Risks |
Research Analyst Overview
- The spasticity treatment market is advancing beyond simple muscle tone management toward sophisticated interventions targeting upper motor neuron damage. The core of this evolution lies in the application of botulinum neurotoxin therapies and intrathecal baclofen therapy, which offer targeted relief from muscle hypertonicity.
- Innovations in non-invasive neuromodulation, such as functional electrical stimulation and repetitive transcranial magnetic stimulation, are expanding the therapeutic arsenal. From a strategic perspective, healthcare executives must assess the capital investment in technologies like implantable neuromodulation systems against long-term operational gains.
- For instance, integrated care pathways leveraging diagnostic tools like dynamic electromyography for precise treatment planning have shown a 15% improvement in achieving patient-reported outcomes within the first year.
- This data-driven approach, which includes everything from oral antispasmodic agents to advanced neurorehabilitation technologies and gene therapy for spasticity, is critical for justifying expenditures and aligning product portfolios with value-based healthcare models focused on motor function recovery.
What are the Key Data Covered in this Spasticity Treatment Market Research and Growth Report?
-
What is the expected growth of the Spasticity Treatment Market between 2026 and 2030?
-
USD 1.40 billion, at a CAGR of 4.5%
-
-
What segmentation does the market report cover?
-
The report is segmented by Type (Drug therapy, Physical therapy, and Surgical treatment), End-user (Hospitals, Ambulatory surgical centers, Home care settings, Specialty clinics, and Diagnostic centers), Indication (Cerebral palsy, Multiple sclerosis, Traumatic brain injury, and Others), Route of Administration (Oral, and Parenteral) and Geography (North America, Europe, Asia, Rest of World (ROW))
-
-
Which regions are analyzed in the report?
-
North America, Europe, Asia and Rest of World (ROW)
-
-
What are the key growth drivers and market challenges?
-
Increasing prevalence of associated neurological conditions, High cost of advanced therapies and stringent reimbursement policies
-
-
Who are the major players in the Spasticity Treatment Market?
-
AbbVie Inc., Amneal Pharmaceuticals Inc., Bausch Health Companies Inc., BioWave Ltd., Boston Scientific Corp., BrainsWay Ltd., Flowonix Medical Inc., Ipsen Pharma, Jazz Pharmaceuticals Plc, LivaNova PLC, Medtronic Plc, Merz Pharma GmbH KGaA, NEURONETICS Inc., Novartis AG, Revance Therapeutics Inc., Saebo Inc, Saluda Medical Pty Ltd., Saol Therapeutics, Teva Pharmaceutical Ltd. and Theranica Bio Electronics Ltd.
-
Market Research Insights
- The market is defined by evolving patient-centric care models that focus on quality of life improvement and functional goal achievement. A major dynamic is the move away from reactive treatment to proactive management within specialized spasticity clinics.
- This shift is driven by data showing that early and multidisciplinary specialist teams can reduce the incidence of secondary complications, lowering long-term care costs by over 25%. However, challenges in the reimbursement landscape and treatment adherence issues remain.
- The adoption of telehealth platforms for neurology addresses some of these, with studies indicating they can cut patient travel burdens by up to 60%, improving access to care for those in remote areas and facilitating better management of chronic conditions like multiple sclerosis.
We can help! Our analysts can customize this spasticity treatment market research report to meet your requirements.
 RIA -
RIA - 
