Specialty Food Ingredients Market Analysis, Size, and Forecast 2024-2028: North America (US and Canada), Europe (France, Germany, Italy, and UK), Middle East and Africa (Egypt, KSA, Oman, and UAE), APAC (China, India, and Japan), South America (Argentina and Brazil), and Rest of World (ROW)

Specialty Food Ingredients Market Analysis, Size, and Forecast 2024-2028:
North America (US and Canada), Europe (France, Germany, Italy, and UK), Middle East and Africa (Egypt, KSA, Oman, and UAE), APAC (China, India, and Japan), South America (Argentina and Brazil), and Rest of World (ROW)

Published: Feb 2024 188 Pages SKU: IRTNTR43506

Market Overview at a Glance

$59.02 B
Market Opportunity
6.94%
CAGR
5.86
YoY growth 2023-2024(%)

Specialty Food Ingredients Market Size 2024-2028

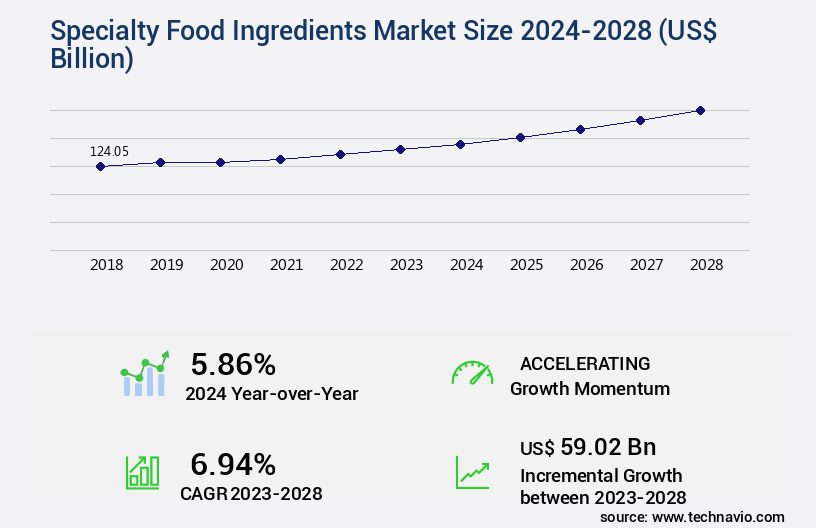
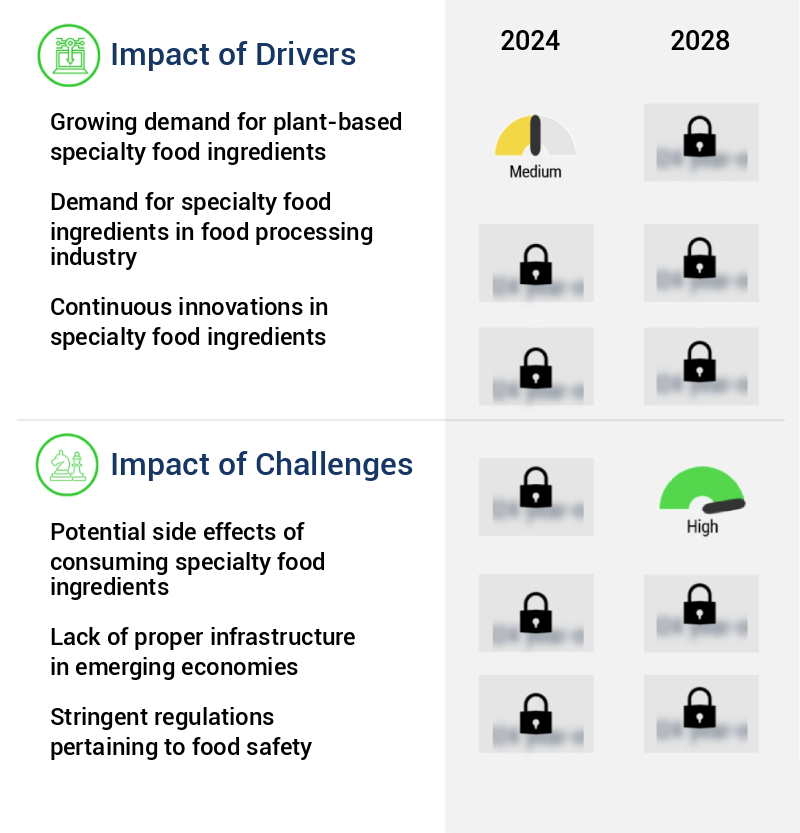
The specialty food ingredients market size is valued to increase by USD 59.02 billion, at a CAGR of 6.94% from 2023 to 2028. Growing demand for plant-based specialty food ingredients will drive the specialty food ingredients market.

Market Insights

  • North America dominated the market and accounted for a 28% growth during the 2024-2028.
  • By Product - Nutraceutical Ingredients segment was valued at USD 32.75 billion in 2022
  • By Application - Bakery and confectionary segment accounted for the largest market revenue share in 2022

Market Size & Forecast

  • Market Opportunities: USD 66.91 billion 
  • Market Future Opportunities 2023: USD 59.02 billion
  • CAGR from 2023 to 2028 : 6.94%

Market Summary

  • The market encompasses a diverse range of components, including plant-based proteins, natural colorants, and neutraceutical additives, that cater to evolving consumer preferences for healthier and more natural food options. Market growth is driven by several factors, including increasing health consciousness, a trend toward clean labeling, and the rising popularity of plant-based diets. Plant-based proteins, derived from sources such as soy, pea, and rice, are gaining significant traction due to their nutritional benefits and sustainability. Natural neutraceutical ingredients, such as omega-3 fatty acids, vitamins, and minerals, are also in high demand as consumers seek to enhance their overall health and wellness.
  • However, the consumption of specialty food ingredients is not without challenges. Potential side effects, such as allergic reactions or gastrointestinal distress, can pose risks for some consumers. Furthermore, ensuring the safety and quality of these ingredients throughout the supply chain is essential to mitigate risks and maintain consumer trust. For instance, a food manufacturer may employ rigorous testing and traceability measures to ensure the authenticity and purity of their specialty food ingredients. By optimizing their supply chain and implementing robust quality control processes, they can minimize risks and maintain operational efficiency while meeting the evolving demands of consumers.

What will be the size of the Specialty Food Ingredients Market during the forecast period?

Specialty Food Ingredients Market Size

Get Key Insights on Market Forecast (PDF) Request Free Sample

  • The market continues to evolve, with companies implementing various strategies to optimize production processes and ensure regulatory compliance. For instance, waste reduction is a critical focus area, with many firms employing sophisticated food matrix interaction techniques to minimize ingredient usage without compromising product quality. Food additive regulations remain a significant concern for businesses, necessitating rigorous process validation techniques and ingredient sourcing strategies. Texture profile analysis and sensory attribute profiling are essential tools in this regard, helping to ensure that final products meet consumer preferences while adhering to regulatory guidelines. Packaging material selection is another crucial consideration, with ingredient bioavailability and microbial stability playing pivotal roles in product shelf life and safety.
  • Quality control procedures, including ingredient safety assessment, sensory consumer testing, and cost reduction strategies, are also essential components of a robust quality assurance program. In the realm of production process parameters, ingredient storage conditions and ingredient transportation methods are vital factors in maintaining ingredient functionality and preserving product quality. Color stability analysis and flavor chemistry analysis are essential techniques for ensuring that final products meet desired sensory attributes, while yield optimization strategies help maximize production efficiency. Ingredient characterization techniques and nutrient fortification strategies are increasingly popular, enabling companies to differentiate their offerings and cater to diverse consumer needs.
  • Overall, the market is a dynamic and complex landscape, requiring a deep understanding of various production, regulatory, and consumer trends.

Unpacking the Specialty Food Ingredients Market Landscape

The market encompasses a diverse range of products, from rheologically complex components that optimize texture and sensory attributes, to natural colorants produced through innovative methods. Quality control systems ensure compliance with food safety regulations, while allergenic ingredient detection techniques mitigate potential risks. Emulsion stabilization methods and protein hydrolysis processes improve ingredient formulation design and efficiency. Supply chain traceability and ingredient sourcing strategies ensure purity and standardization. Functional food ingredients, such as probiotics and antioxidants, necessitate preservation techniques and stability studies to maintain their efficacy. Ingredient interaction studies and flavor compound extraction methods enhance product development. Microbial contamination control and ingredient purity testing are essential for maintaining product safety and consumer trust. Ingredient cost optimization and clean label initiatives drive innovation in processing technology and labeling requirements. Carbohydrate modification methods cater to evolving consumer preferences, while sensory perception and nutritional content analysis provide valuable insights for product development and improvement.

Key Market Drivers Fueling Growth

The surge in demand for plant-based specialty food ingredients serves as the primary catalyst for market growth.

  • The market is experiencing dynamic evolution, driven by the increasing popularity of plant-based alternatives in various sectors. Consumers' shifting preferences towards healthier, sustainable, and ethically sourced food options have fueled the demand for plant-derived ingredients. According to recent studies, plant-based diets are on the rise, with over 50% of consumers incorporating plant-based foods into their daily meals. This trend is leading to significant growth in the demand for plant-based specialty food ingredients, such as proteins, fats, fibers, flavors, and colors. Manufacturers are innovating to meet this demand, developing a diverse range of plant-based ingredients sourced from grains, legumes, nuts, seeds, fruits, and vegetables.
  • These ingredients offer functional properties and nutritional benefits comparable to their animal-derived counterparts, reducing the need for animal agriculture. For instance, plant-based proteins can provide up to 20g of protein per serving, while plant-based fats offer healthier alternatives to saturated animal fats. These advancements are transforming the market, offering sustainable and ethical solutions for consumers and businesses alike.

Prevailing Industry Trends & Opportunities

The growing demand for natural nutraceutical ingredients represents a significant market trend. Nutraceuticals, derived from natural sources, are increasingly preferred by consumers seeking health benefits beyond basic nutrition. 

  • The market is witnessing significant evolution, driven by the increasing health consciousness among consumers and the growing demand for food safety. According to recent research, over 50% of global consumers prefer foods made with natural ingredients, compared to just 35% in 2015. This trend is fueling the adoption of natural ingredients in a wide range of food and beverage products, including functional foods, sports drinks, nutritional supplements, and medically formulated foods. Companies in the food processing industry are responding to this demand by incorporating natural ingredients into their offerings. The use of natural ingredients provides numerous health benefits, such as vitamins, minerals, and antioxidants, and can help prevent chronic diseases through the inclusion of natural nutraceutical ingredients.
  • These factors are contributing to the increasing popularity of specialty food ingredients in various sectors. For instance, the use of natural ingredients in the production of functional foods has resulted in a 45% increase in sales over the past five years. Similarly, the adoption of natural ingredients in sports drinks has led to a 30% market share growth in the same period.

Significant Market Challenges

The growth of the specialty food industry is significantly impacted by potential side effects associated with the consumption of specialized ingredients. 

  • The market continues to evolve, expanding its reach across various sectors, including bakery, beverages, confectionery, and savory food applications. Despite the market's growth, it faces challenges related to potential side effects of certain ingredients. Specialty food ingredients are essential for enhancing flavor, texture, and nutritional value, but they may also pose risks for consumers. For instance, common allergens such as nuts, gluten, and dairy are often used in specialty food ingredients, posing risks for individuals with allergies or intolerances. Furthermore, artificial additives, flavors, and preservatives may trigger adverse reactions or sensitivities in some consumers. According to a study, food allergies affect approximately 6 million children in the United States, and 1 in 13 children have a food allergy.
  • Another study revealed that 32 million adults in the US have food intolerances. To address these concerns, manufacturers are increasingly focusing on producing allergen-free and clean-label specialty food ingredients. For example, the use of natural flavors and preservatives, as well as alternative sources of allergens, is gaining popularity. This shift towards natural and allergen-free ingredients is expected to drive market growth and meet the evolving demands of health-conscious consumers.

Specialty Food Ingredients Market Size

In-Depth Market Segmentation: Specialty Food Ingredients Market

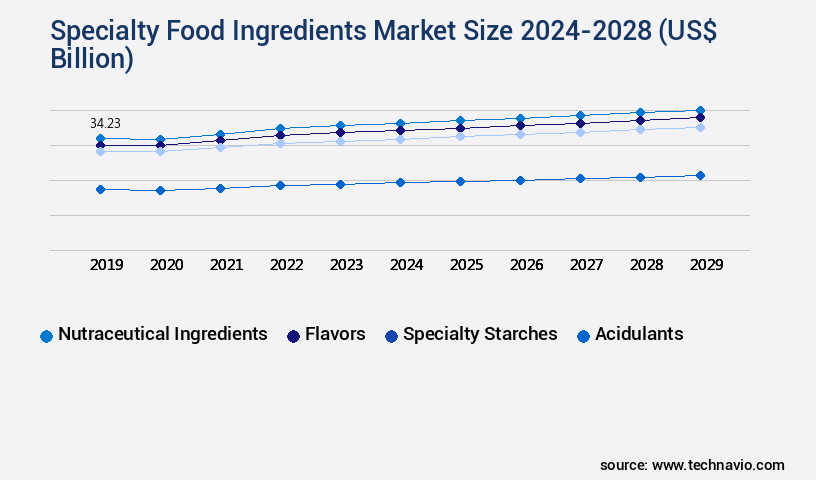
The specialty food ingredients industry research report provides comprehensive data (region-wise segment analysis), with forecasts and estimates in "USD billion" for the period 2024-2028, as well as historical data from 2018-2022 for the following segments.

  • Product
    • Nutraceutical Ingredients
    • Flavors
    • Specialty starches
    • Acidulants
    • Others
  • Application
    • Bakery and confectionary
    • Beverages
    • Sauces and condiments
    • Others
  • Source
    • Natural
    • Synthetic
  • Form
    • Dry
    • Liquid
  • Geography
    • North America
      • US
      • Canada
    • Europe
      • France
      • Germany
      • Italy
      • UK
    • Middle East and Africa
      • Egypt
      • KSA
      • Oman
      • UAE
    • APAC
      • China
      • India
      • Japan
    • South America
      • Argentina
      • Brazil
    • Rest of World (ROW)

By Product Insights

The nutraceutical ingredients segment is estimated to witness significant growth during the forecast period.

In the dynamic market, texturizing agents and sensory enhancers continue to dominate, with a focus on improving rheological properties through texture modification techniques. Sensory evaluation methods are essential for quality control systems, ensuring consumer satisfaction and adherence to food safety regulations. Allergenic ingredient detection and natural colorants production are key areas of innovation, with emulsion stabilization methods and supply chain traceability ensuring product consistency and safety. Protein hydrolysis and fat modification techniques are utilized for ingredient formulation design, while food ingredient sourcing and standardization are crucial for cost optimization and preserving ingredient stability.

Specialty Food Ingredients Market Size

Request Free Sample

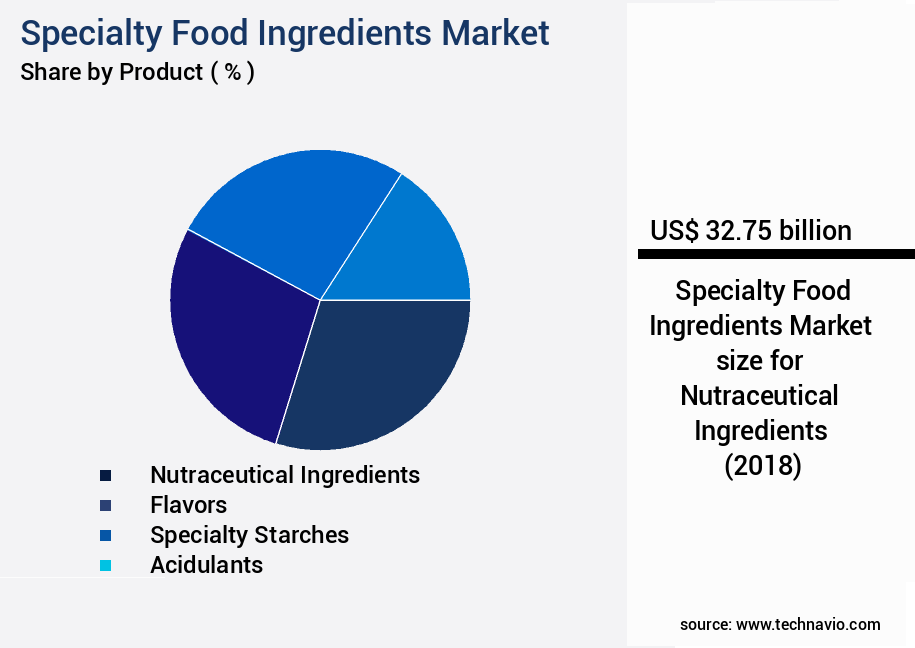
The Nutraceutical Ingredients segment was valued at USD 32.75 billion in 2018 and showed a gradual increase during the forecast period.

Flavor compound extraction and microbial contamination control are integral to maintaining ingredient purity, and probiotic viability assessment and carbohydrate modification methods cater to the growing demand for functional food ingredients. The market prioritizes clean label ingredients, with a focus on ingredient interaction studies, antioxidant capacity measurement, and process optimization for naturally derived solutions.

Specialty Food Ingredients Market Size

Request Free Sample

Regional Analysis

North America is estimated to contribute 28% to the growth of the global market during the forecast period. Technavio's analysts have elaborately explained the regional trends and drivers that shape the market during the forecast period.

Specialty Food Ingredients Market Share by Geography

See How Specialty Food Ingredients Market Demand is Rising in North America Request Free Sample

The market is experiencing dynamic growth, with North America leading the charge due to the region's significant consumption of these ingredients. This trend is driven by the increasing demand for functional foods, fueled by health-conscious consumers seeking to prevent various health issues. The North American market for specialty food ingredients is projected to expand steadily, with the consumption of these ingredients increasing at a constant rate. According to industry reports, the North American market for specialty food ingredients accounted for over 35% of the global market share in 2020.

Moreover, the use of specialty food ingredients in the region's food industry contributes to operational efficiency gains and cost reductions by enhancing product quality and extending shelf life. These factors collectively underpin the market's robust growth trajectory.

Specialty Food Ingredients Market Share by Geography

 Customer Landscape of Specialty Food Ingredients Industry

Competitive Intelligence by Technavio Analysis: Leading Players in the Specialty Food Ingredients Market

Companies are implementing various strategies, such as strategic alliances, specialty food ingredients market forecast, partnerships, mergers and acquisitions, geographical expansion, and product/service launches, to enhance their presence in the industry.

Advanced Food Systems Inc. - This company specializes in providing innovative ingredient solutions for the food industry, focusing on meat and poultry products, frozen foods, sauces, and marinades. 

The industry research and growth report includes detailed analyses of the competitive landscape of the market and information about key companies, including:

  • Advanced Food Systems Inc.
  • Archer Daniels Midland Co.
  • Ashland Inc.
  • Axiom Foods Inc.
  • Barentz International BV
  • Cargill Inc.
  • Chr Hansen Holding AS
  • DuPont de Nemours Inc.
  • Fonterra Cooperative Group Ltd.
  • Givaudan SA
  • Ingredion Inc.
  • Kerry Group Plc
  • Koninklijke DSM NV
  • Nagase and Co. Ltd.
  • Roquette Freres SA
  • Sensient Technologies Corp.
  • SubNutra Food Ingredients Pvt. Ltd.
  • Tate and Lyle PLC
  • Woodland Foods Ltd.

Qualitative and quantitative analysis of companies has been conducted to help clients understand the wider business environment as well as the strengths and weaknesses of key industry players. Data is qualitatively analyzed to categorize companies as pure play, category-focused, industry-focused, and diversified; it is quantitatively analyzed to categorize companies as dominant, leading, strong, tentative, and weak.

Recent Development and News in Specialty Food Ingredients Market

  • In January 2025, Archer Daniels Midland Company (ADM) announced the launch of its new line of plant-based proteins, Protera, specifically designed for the market (ADM press release, 2025). These proteins are derived from peas, lentils, and chickpeas, providing a sustainable alternative to traditional animal-derived ingredients.
  • In March 2025, DuPont Nutrition & Biosciences and Ingredion Inc. entered into a strategic partnership to expand their joint venture, NutriScience Innovations, which focuses on developing and marketing specialty food ingredients (DuPont press release, 2025). This collaboration combines DuPont's expertise in fermentation and Ingredion's knowledge of texturizing technologies to create innovative solutions for the food industry.
  • In May 2025, Kerry Group, a leading global taste and nutrition company, acquired Bio-Techne Corporation's food division, Quadrant Health Sciences, for approximately € 1.1 billion (Kerry Group press release, 2025). This acquisition significantly expanded Kerry's capabilities in the market, particularly in the areas of probiotics, enzymes, and functional proteins.
  • In August 2024, Firmenich, a global leader in the creation of flavors and fragrances, received regulatory approval for its natural food coloring ingredient, Rubia Natural, in the European Union (Firmenich press release, 2024). This approval marked a significant milestone for Firmenich, as Rubia Natural is the first natural red food coloring derived from the rubia tinctorum plant to be approved for use in the EU.

Dive into Technavio's robust research methodology, blending expert interviews, extensive data synthesis, and validated models for unparalleled Specialty Food Ingredients Market insights. See full methodology.

Market Scope

Report Coverage

Details

Page number

188

Base year

2023

Historic period

2018-2022

Forecast period

2024-2028

Growth momentum & CAGR

Accelerate at a CAGR of 6.94%

Market growth 2024-2028

USD 59.02 billion

Market structure

Fragmented

YoY growth 2023-2024(%)

5.86

Key countries

US, Canada, Germany, UK, Italy, France, China, India, Japan, Brazil, Egypt, UAE, Oman, Argentina, KSA, UAE, Brazil, and Rest of World (ROW)

Competitive landscape

Leading Companies, Market Positioning of Companies, Competitive Strategies, and Industry Risks

Request Free Sample

Why Choose Technavio for Specialty Food Ingredients Market Insights?

"Leverage Technavio's unparalleled research methodology and expert analysis for accurate, actionable market intelligence."

The market encompasses a diverse range of high-value components used to enhance the sensory experience, functionality, and nutritional value of food products. The effectiveness of these ingredients relies significantly on the processing methods employed, as their functionality can be influenced by various factors such as temperature, pressure, and time. Proper storage conditions are equally crucial to maintain ingredient stability, ensuring consistent product quality and minimizing potential degradation. Sensory evaluation methods play a pivotal role in assessing the impact of specialty food ingredients on food systems. Determining key functional properties through techniques like rheology testing and texture analysis is essential for optimizing ingredient processing parameters and understanding ingredient interactions. Measuring the bioavailability of food components using techniques such as in vitro digestion and chromatography is another critical aspect of specialty food ingredient development. Investigating flavor compound interactions and implementing strategies for enhancing ingredient shelf life, controlling microbial contamination, and optimizing sourcing are all vital components of a successful specialty food ingredient business. Developing clean label ingredient formulations and assessment of allergenic potential are essential for compliance with consumer preferences and regulatory requirements. Techniques for improving ingredient purity, such as chromatography and filtration, are essential for ensuring product consistency and quality. Approaches for optimizing ingredient sourcing, implementing food safety management systems, monitoring supply chain traceability, and evaluating food ingredient labeling are all crucial elements of operational planning and supply chain efficiency. Compared to traditional food ingredients, specialty food ingredients offer a significant competitive edge in terms of product differentiation and consumer appeal. By focusing on the optimization of ingredient processing parameters, analysis of ingredient interactions, assessment of ingredient stability under various conditions, and evaluation of different texture modification methods, businesses can create unique and innovative food products that cater to evolving consumer demands.

What are the Key Data Covered in this Specialty Food Ingredients Market Research and Growth Report?

  • What is the expected growth of the Specialty Food Ingredients Market between 2024 and 2028?

    • USD 59.02 billion, at a CAGR of 6.94%

  • What segmentation does the market report cover?

    • The report is segmented by Product (Nutraceutical Ingredients, Flavors, Specialty starches, Acidulants, and Others), Application (Bakery and confectionary, Beverages, Sauces and condiments, and Others), Geography (North America, APAC, Europe, South America, and Middle East and Africa), Source (Natural and Synthetic), and Form (Dry and Liquid)

  • Which regions are analyzed in the report?

    • North America, APAC, Europe, South America, and Middle East and Africa

  • What are the key growth drivers and market challenges?

    • Growing demand for plant-based specialty food ingredients, Potential side effects of consuming specialty food ingredients

  • Who are the major players in the Specialty Food Ingredients Market?

    • Advanced Food Systems Inc., Archer Daniels Midland Co., Ashland Inc., Axiom Foods Inc., Barentz International BV, Cargill Inc., Chr Hansen Holding AS, DuPont de Nemours Inc., Fonterra Cooperative Group Ltd., Givaudan SA, Ingredion Inc., Kerry Group Plc, Koninklijke DSM NV, Nagase and Co. Ltd., Roquette Freres SA, Sensient Technologies Corp., SubNutra Food Ingredients Pvt. Ltd., Tate and Lyle PLC, and Woodland Foods Ltd.

We can help! Our analysts can customize this specialty food ingredients market research report to meet your requirements.

Get in touch

1 Executive Summary

  • 1.1 Market overview
    • Exhibit 01: Executive Summary – Chart on Market Overview
    • Exhibit 02: Executive Summary – Data Table on Market Overview
    • Exhibit 03: Executive Summary – Chart on Global Market Characteristics
    • Exhibit 04: Executive Summary – Chart on Market by Geography
    • Exhibit 05: Executive Summary – Chart on Market Segmentation by Product
    • Exhibit 06: Executive Summary – Chart on Market Segmentation by Application
    • Exhibit 07: Executive Summary – Chart on Incremental Growth
    • Exhibit 08: Executive Summary – Data Table on Incremental Growth
    • Exhibit 09: Executive Summary – Chart on Vendor Market Positioning

2 Market Landscape

  • 2.1 Market ecosystem
    • Exhibit 10: Parent market
    • Exhibit 11: Market Characteristics

3 Market Sizing

  • 3.1 Market definition
    • Exhibit 12: Offerings of vendors included in the market definition
  • 3.2 Market segment analysis
    • Exhibit 13: Market segments
  • 3.3 Market size 2023
    • 3.4 Market outlook: Forecast for 2023-2028
      • Exhibit 14: Chart on Global - Market size and forecast 2023-2028 ($ billion)
      • Exhibit 15: Data Table on Global - Market size and forecast 2023-2028 ($ billion)
      • Exhibit 16: Chart on Global Market: Year-over-year growth 2023-2028 (%)
      • Exhibit 17: Data Table on Global Market: Year-over-year growth 2023-2028 (%)

    4 Historic Market Size

    • 4.1 Global specialty food ingredients market 2018 - 2022
      • Exhibit 18: Historic Market Size – Data Table on global specialty food ingredients market 2018 - 2022 ($ billion)
    • 4.2 Product Segment Analysis 2018 - 2022
      • Exhibit 19: Historic Market Size – Product Segment 2018 - 2022 ($ billion)
    • 4.3 Application Segment Analysis 2018 - 2022
      • Exhibit 20: Historic Market Size – Application Segment 2018 - 2022 ($ billion)
    • 4.4 Geography Segment Analysis 2018 - 2022
      • Exhibit 21: Historic Market Size – Geography Segment 2018 - 2022 ($ billion)
    • 4.5 Country Segment Analysis 2018 - 2022
      • Exhibit 22: Historic Market Size – Country Segment 2018 - 2022 ($ billion)

    5 Five Forces Analysis

    • 5.1 Five forces summary
      • Exhibit 23: Five forces analysis - Comparison between 2023 and 2028
    • 5.2 Bargaining power of buyers
      • Exhibit 24: Chart on Bargaining power of buyers – Impact of key factors 2023 and 2028
    • 5.3 Bargaining power of suppliers
      • Exhibit 25: Bargaining power of suppliers – Impact of key factors in 2023 and 2028
    • 5.4 Threat of new entrants
      • Exhibit 26: Threat of new entrants – Impact of key factors in 2023 and 2028
    • 5.5 Threat of substitutes
      • Exhibit 27: Threat of substitutes – Impact of key factors in 2023 and 2028
    • 5.6 Threat of rivalry
      • Exhibit 28: Threat of rivalry – Impact of key factors in 2023 and 2028
    • 5.7 Market condition
      • Exhibit 29: Chart on Market condition - Five forces 2023 and 2028

    6 Market Segmentation by Product

    • 6.1 Market segments
      • Chart on Product - Market share (2023-2028) (%)
      • Data Table on Product - Market share (2023-2028) (%)
    • 6.2 Comparison by Product
      • Chart on Comparison by Product
      • Data Table on Comparison by Product
    • 6.3 Nutraceutical Ingredients - Market size and forecast (2023-2028)
      • Chart on Nutraceutical Ingredients - Market size and forecast (2023-2028) ($ billion)
      • Data Table on Nutraceutical Ingredients - Market size and forecast (2023-2028) ($ billion)
      • Chart on Nutraceutical Ingredients - Year-over-year growth (2023-2028) (%)
      • Data Table on Nutraceutical Ingredients - Year-over-year growth (2023-2028) (%)
    • 6.4 Flavors - Market size and forecast (2023-2028)
      • Chart on Flavors - Market size and forecast (2023-2028) ($ billion)
      • Data Table on Flavors - Market size and forecast (2023-2028) ($ billion)
      • Chart on Flavors - Year-over-year growth (2023-2028) (%)
      • Data Table on Flavors - Year-over-year growth (2023-2028) (%)
    • 6.5 Specialty starches - Market size and forecast (2023-2028)
      • Chart on Specialty starches - Market size and forecast (2023-2028) ($ billion)
      • Data Table on Specialty starches - Market size and forecast (2023-2028) ($ billion)
      • Chart on Specialty starches - Year-over-year growth (2023-2028) (%)
      • Data Table on Specialty starches - Year-over-year growth (2023-2028) (%)
    • 6.6 Acidulants - Market size and forecast (2023-2028)
      • Chart on Acidulants - Market size and forecast (2023-2028) ($ billion)
      • Data Table on Acidulants - Market size and forecast (2023-2028) ($ billion)
      • Chart on Acidulants - Year-over-year growth (2023-2028) (%)
      • Data Table on Acidulants - Year-over-year growth (2023-2028) (%)
    • 6.7 Others - Market size and forecast (2023-2028)
      • Chart on Others - Market size and forecast (2023-2028) ($ billion)
      • Data Table on Others - Market size and forecast (2023-2028) ($ billion)
      • Chart on Others - Year-over-year growth (2023-2028) (%)
      • Data Table on Others - Year-over-year growth (2023-2028) (%)
    • 6.8 Market opportunity by Product
      • Market opportunity by Product ($ billion)
      • Data Table on Market opportunity by Product ($ billion)

    7 Market Segmentation by Application

    • 7.1 Market segments
      • Chart on Application - Market share (2023-2028) (%)
      • Data Table on Application - Market share (2023-2028) (%)
    • 7.2 Comparison by Application
      • Chart on Comparison by Application
      • Data Table on Comparison by Application
    • 7.3 Bakery and confectionary - Market size and forecast (2023-2028)
      • Chart on Bakery and confectionary - Market size and forecast (2023-2028) ($ billion)
      • Data Table on Bakery and confectionary - Market size and forecast (2023-2028) ($ billion)
      • Chart on Bakery and confectionary - Year-over-year growth (2023-2028) (%)
      • Data Table on Bakery and confectionary - Year-over-year growth (2023-2028) (%)
    • 7.4 Beverages - Market size and forecast (2023-2028)
      • Chart on Beverages - Market size and forecast (2023-2028) ($ billion)
      • Data Table on Beverages - Market size and forecast (2023-2028) ($ billion)
      • Chart on Beverages - Year-over-year growth (2023-2028) (%)
      • Data Table on Beverages - Year-over-year growth (2023-2028) (%)
    • 7.5 Sauces and condiments - Market size and forecast (2023-2028)
      • Chart on Sauces and condiments - Market size and forecast (2023-2028) ($ billion)
      • Data Table on Sauces and condiments - Market size and forecast (2023-2028) ($ billion)
      • Chart on Sauces and condiments - Year-over-year growth (2023-2028) (%)
      • Data Table on Sauces and condiments - Year-over-year growth (2023-2028) (%)
    • 7.6 Others - Market size and forecast (2023-2028)
      • Chart on Others - Market size and forecast (2023-2028) ($ billion)
      • Data Table on Others - Market size and forecast (2023-2028) ($ billion)
      • Chart on Others - Year-over-year growth (2023-2028) (%)
      • Data Table on Others - Year-over-year growth (2023-2028) (%)
    • 7.7 Market opportunity by Application
      • Market opportunity by Application ($ billion)
      • Data Table on Market opportunity by Application ($ billion)

    8 Market Segmentation by Source

    • 8.1 Market segments
      • Chart on Source - Market share (2023-2028) (%)
      • Data Table on Source - Market share (2023-2028) (%)
    • 8.2 Comparison by Source
      • Chart on Comparison by Source
      • Data Table on Comparison by Source
    • 8.3 Natural - Market size and forecast (2023-2028)
      • Chart on Natural - Market size and forecast (2023-2028) ($ billion)
      • Data Table on Natural - Market size and forecast (2023-2028) ($ billion)
      • Chart on Natural - Year-over-year growth (2023-2028) (%)
      • Data Table on Natural - Year-over-year growth (2023-2028) (%)
    • 8.4 Synthetic - Market size and forecast (2023-2028)
      • Chart on Synthetic - Market size and forecast (2023-2028) ($ billion)
      • Data Table on Synthetic - Market size and forecast (2023-2028) ($ billion)
      • Chart on Synthetic - Year-over-year growth (2023-2028) (%)
      • Data Table on Synthetic - Year-over-year growth (2023-2028) (%)
    • 8.5 Market opportunity by Source
      • Market opportunity by Source ($ billion)
      • Data Table on Market opportunity by Source ($ billion)

    9 Market Segmentation by Form

    • 9.1 Market segments
      • Chart on Form - Market share (2023-2028) (%)
      • Data Table on Form - Market share (2023-2028) (%)
    • 9.2 Comparison by Form
      • Chart on Comparison by Form
      • Data Table on Comparison by Form
    • 9.3 Dry - Market size and forecast (2023-2028)
      • Chart on Dry - Market size and forecast (2023-2028) ($ billion)
      • Data Table on Dry - Market size and forecast (2023-2028) ($ billion)
      • Chart on Dry - Year-over-year growth (2023-2028) (%)
      • Data Table on Dry - Year-over-year growth (2023-2028) (%)
    • 9.4 Liquid - Market size and forecast (2023-2028)
      • Chart on Liquid - Market size and forecast (2023-2028) ($ billion)
      • Data Table on Liquid - Market size and forecast (2023-2028) ($ billion)
      • Chart on Liquid - Year-over-year growth (2023-2028) (%)
      • Data Table on Liquid - Year-over-year growth (2023-2028) (%)
    • 9.5 Market opportunity by Form
      • Market opportunity by Form ($ billion)
      • Data Table on Market opportunity by Form ($ billion)

    8 Customer Landscape

    • 8.1 Customer landscape overview
      • Exhibit 78: Analysis of price sensitivity, lifecycle, customer purchase basket, adoption rates, and purchase criteria

    9 Geographic Landscape

    • 9.1 Geographic segmentation
      • Exhibit 79: Chart on Market share by geography 2023-2028 (%)
      • Exhibit 80: Data Table on Market share by geography 2023-2028 (%)
    • 9.2 Geographic comparison
      • Exhibit 81: Chart on Geographic comparison
      • Exhibit 82: Data Table on Geographic comparison
    • 9.3 North America - Market size and forecast 2023-2028
      • Exhibit 83: Chart on North America - Market size and forecast 2023-2028 ($ billion)
      • Exhibit 84: Data Table on North America - Market size and forecast 2023-2028 ($ billion)
      • Exhibit 85: Chart on North America - Year-over-year growth 2023-2028 (%)
      • Exhibit 86: Data Table on North America - Year-over-year growth 2023-2028 (%)
    • 9.4 APAC - Market size and forecast 2023-2028
      • Exhibit 87: Chart on APAC - Market size and forecast 2023-2028 ($ billion)
      • Exhibit 88: Data Table on APAC - Market size and forecast 2023-2028 ($ billion)
      • Exhibit 89: Chart on APAC - Year-over-year growth 2023-2028 (%)
      • Exhibit 90: Data Table on APAC - Year-over-year growth 2023-2028 (%)
    • 9.5 Europe - Market size and forecast 2023-2028
      • Exhibit 91: Chart on Europe - Market size and forecast 2023-2028 ($ billion)
      • Exhibit 92: Data Table on Europe - Market size and forecast 2023-2028 ($ billion)
      • Exhibit 93: Chart on Europe - Year-over-year growth 2023-2028 (%)
      • Exhibit 94: Data Table on Europe - Year-over-year growth 2023-2028 (%)
    • 9.6 South America - Market size and forecast 2023-2028
      • Exhibit 95: Chart on South America - Market size and forecast 2023-2028 ($ billion)
      • Exhibit 96: Data Table on South America - Market size and forecast 2023-2028 ($ billion)
      • Exhibit 97: Chart on South America - Year-over-year growth 2023-2028 (%)
      • Exhibit 98: Data Table on South America - Year-over-year growth 2023-2028 (%)
    • 9.7 Middle East and Africa - Market size and forecast 2023-2028
      • Exhibit 99: Chart on Middle East and Africa - Market size and forecast 2023-2028 ($ billion)
      • Exhibit 100: Data Table on Middle East and Africa - Market size and forecast 2023-2028 ($ billion)
      • Exhibit 101: Chart on Middle East and Africa - Year-over-year growth 2023-2028 (%)
      • Exhibit 102: Data Table on Middle East and Africa - Year-over-year growth 2023-2028 (%)
    • 9.8 US - Market size and forecast 2023-2028
      • Exhibit 103: Chart on US - Market size and forecast 2023-2028 ($ billion)
      • Exhibit 104: Data Table on US - Market size and forecast 2023-2028 ($ billion)
      • Exhibit 105: Chart on US - Year-over-year growth 2023-2028 (%)
      • Exhibit 106: Data Table on US - Year-over-year growth 2023-2028 (%)
    • 9.9 China - Market size and forecast 2023-2028
      • Exhibit 107: Chart on China - Market size and forecast 2023-2028 ($ billion)
      • Exhibit 108: Data Table on China - Market size and forecast 2023-2028 ($ billion)
      • Exhibit 109: Chart on China - Year-over-year growth 2023-2028 (%)
      • Exhibit 110: Data Table on China - Year-over-year growth 2023-2028 (%)
    • 9.10 Germany - Market size and forecast 2023-2028
      • Exhibit 111: Chart on Germany - Market size and forecast 2023-2028 ($ billion)
      • Exhibit 112: Data Table on Germany - Market size and forecast 2023-2028 ($ billion)
      • Exhibit 113: Chart on Germany - Year-over-year growth 2023-2028 (%)
      • Exhibit 114: Data Table on Germany - Year-over-year growth 2023-2028 (%)
    • 9.11 UK - Market size and forecast 2023-2028
      • Exhibit 115: Chart on UK - Market size and forecast 2023-2028 ($ billion)
      • Exhibit 116: Data Table on UK - Market size and forecast 2023-2028 ($ billion)
      • Exhibit 117: Chart on UK - Year-over-year growth 2023-2028 (%)
      • Exhibit 118: Data Table on UK - Year-over-year growth 2023-2028 (%)
    • 9.12 Japan - Market size and forecast 2023-2028
      • Exhibit 119: Chart on Japan - Market size and forecast 2023-2028 ($ billion)
      • Exhibit 120: Data Table on Japan - Market size and forecast 2023-2028 ($ billion)
      • Exhibit 121: Chart on Japan - Year-over-year growth 2023-2028 (%)
      • Exhibit 122: Data Table on Japan - Year-over-year growth 2023-2028 (%)
    • 9.13 Market opportunity by geography
      • Exhibit 123: Market opportunity by geography ($ billion)
      • Exhibit 124: Data Tables on Market opportunity by geography ($ billion)
    • 11.14 Canada - Market size and forecast (2023-2028)
      • Chart on Canada - Market size and forecast (2023-2028) ($ billion)
      • Data Table on Canada - Market size and forecast (2023-2028) ($ billion)
      • Chart on Canada - Year-over-year growth (2023-2028) (%)
      • Data Table on Canada - Year-over-year growth (2023-2028) (%)
    • 11.15 Italy - Market size and forecast (2023-2028)
      • Chart on Italy - Market size and forecast (2023-2028) ($ billion)
      • Data Table on Italy - Market size and forecast (2023-2028) ($ billion)
      • Chart on Italy - Year-over-year growth (2023-2028) (%)
      • Data Table on Italy - Year-over-year growth (2023-2028) (%)
    • 11.16 France - Market size and forecast (2023-2028)
      • Chart on France - Market size and forecast (2023-2028) ($ billion)
      • Data Table on France - Market size and forecast (2023-2028) ($ billion)
      • Chart on France - Year-over-year growth (2023-2028) (%)
      • Data Table on France - Year-over-year growth (2023-2028) (%)
    • 11.17 India - Market size and forecast (2023-2028)
      • Chart on India - Market size and forecast (2023-2028) ($ billion)
      • Data Table on India - Market size and forecast (2023-2028) ($ billion)
      • Chart on India - Year-over-year growth (2023-2028) (%)
      • Data Table on India - Year-over-year growth (2023-2028) (%)
    • 11.18 Brazil - Market size and forecast (2023-2028)
      • Chart on Brazil - Market size and forecast (2023-2028) ($ billion)
      • Data Table on Brazil - Market size and forecast (2023-2028) ($ billion)
      • Chart on Brazil - Year-over-year growth (2023-2028) (%)
      • Data Table on Brazil - Year-over-year growth (2023-2028) (%)
    • 11.19 Egypt - Market size and forecast (2023-2028)
      • Chart on Egypt - Market size and forecast (2023-2028) ($ billion)
      • Data Table on Egypt - Market size and forecast (2023-2028) ($ billion)
      • Chart on Egypt - Year-over-year growth (2023-2028) (%)
      • Data Table on Egypt - Year-over-year growth (2023-2028) (%)
    • 11.20 UAE - Market size and forecast (2023-2028)
      • Chart on UAE - Market size and forecast (2023-2028) ($ billion)
      • Data Table on UAE - Market size and forecast (2023-2028) ($ billion)
      • Chart on UAE - Year-over-year growth (2023-2028) (%)
      • Data Table on UAE - Year-over-year growth (2023-2028) (%)
    • 11.21 Oman - Market size and forecast (2023-2028)
      • Chart on Oman - Market size and forecast (2023-2028) ($ billion)
      • Data Table on Oman - Market size and forecast (2023-2028) ($ billion)
      • Chart on Oman - Year-over-year growth (2023-2028) (%)
      • Data Table on Oman - Year-over-year growth (2023-2028) (%)
    • 11.22 Argentina - Market size and forecast (2023-2028)
      • Chart on Argentina - Market size and forecast (2023-2028) ($ billion)
      • Data Table on Argentina - Market size and forecast (2023-2028) ($ billion)
      • Chart on Argentina - Year-over-year growth (2023-2028) (%)
      • Data Table on Argentina - Year-over-year growth (2023-2028) (%)
    • 11.23 KSA - Market size and forecast (2023-2028)
      • Chart on KSA - Market size and forecast (2023-2028) ($ billion)
      • Data Table on KSA - Market size and forecast (2023-2028) ($ billion)
      • Chart on KSA - Year-over-year growth (2023-2028) (%)
      • Data Table on KSA - Year-over-year growth (2023-2028) (%)
    • 11.24 Rest of World (ROW) - Market size and forecast (2023-2028)
      • Chart on Rest of World (ROW) - Market size and forecast (2023-2028) ($ billion)
      • Data Table on Rest of World (ROW) - Market size and forecast (2023-2028) ($ billion)
      • Chart on Rest of World (ROW) - Year-over-year growth (2023-2028) (%)
      • Data Table on Rest of World (ROW) - Year-over-year growth (2023-2028) (%)

    10 Drivers, Challenges, and Trends

    • 10.1 Market drivers
      • 10.2 Market challenges
        • 10.3 Impact of drivers and challenges
          • Exhibit 125: Impact of drivers and challenges in 2023 and 2028
        • 10.4 Market trends

          11 Vendor Landscape

          • 11.1 Overview
            • 11.2 Vendor landscape
              • Exhibit 126: Overview on Criticality of inputs and Factors of differentiation
            • 11.3 Landscape disruption
              • Exhibit 127: Overview on factors of disruption
            • 11.4 Industry risks
              • Exhibit 128: Impact of key risks on business

            12 Vendor Analysis

            • 12.1 Vendors covered
              • Exhibit 129: Vendors covered
            • 12.2 Market positioning of vendors
              • Exhibit 130: Matrix on vendor position and classification
            • 12.3 Advanced Food Systems Inc.
              • Exhibit 131: Advanced Food Systems Inc. - Overview
              • Exhibit 132: Advanced Food Systems Inc. - Product / Service
              • Exhibit 133: Advanced Food Systems Inc. - Key offerings
            • 12.4 Archer Daniels Midland Co.
              • Exhibit 134: Archer Daniels Midland Co. - Overview
              • Exhibit 135: Archer Daniels Midland Co. - Business segments
              • Exhibit 136: Archer Daniels Midland Co. - Key offerings
              • Exhibit 137: Archer Daniels Midland Co. - Segment focus
            • 12.5 Ashland Inc.
              • Exhibit 138: Ashland Inc. - Overview
              • Exhibit 139: Ashland Inc. - Business segments
              • Exhibit 140: Ashland Inc. - Key news
              • Exhibit 141: Ashland Inc. - Key offerings
              • Exhibit 142: Ashland Inc. - Segment focus
            • 12.6 Axiom Foods Inc.
              • Exhibit 143: Axiom Foods Inc. - Overview
              • Exhibit 144: Axiom Foods Inc. - Product / Service
              • Exhibit 145: Axiom Foods Inc. - Key offerings
            • 12.7 Barentz International BV
              • Exhibit 146: Barentz International BV - Overview
              • Exhibit 147: Barentz International BV - Product / Service
              • Exhibit 148: Barentz International BV - Key offerings
            • 12.8 Cargill Inc.
              • Exhibit 149: Cargill Inc. - Overview
              • Exhibit 150: Cargill Inc. - Product / Service
              • Exhibit 151: Cargill Inc. - Key news
              • Exhibit 152: Cargill Inc. - Key offerings
            • 12.9 Chr Hansen Holding AS
              • Exhibit 153: Chr Hansen Holding AS - Overview
              • Exhibit 154: Chr Hansen Holding AS - Business segments
              • Exhibit 155: Chr Hansen Holding AS - Key news
              • Exhibit 156: Chr Hansen Holding AS - Key offerings
              • Exhibit 157: Chr Hansen Holding AS - Segment focus
            • 12.10 DuPont de Nemours Inc.
              • Exhibit 158: DuPont de Nemours Inc. - Overview
              • Exhibit 159: DuPont de Nemours Inc. - Business segments
              • Exhibit 160: DuPont de Nemours Inc. - Key news
              • Exhibit 161: DuPont de Nemours Inc. - Key offerings
              • Exhibit 162: DuPont de Nemours Inc. - Segment focus
            • 12.11 Fonterra Cooperative Group Ltd.
              • Exhibit 163: Fonterra Cooperative Group Ltd. - Overview
              • Exhibit 164: Fonterra Cooperative Group Ltd. - Business segments
              • Exhibit 165: Fonterra Cooperative Group Ltd. - Key offerings
              • Exhibit 166: Fonterra Cooperative Group Ltd. - Segment focus
            • 12.12 Givaudan SA
              • Exhibit 167: Givaudan SA - Overview
              • Exhibit 168: Givaudan SA - Business segments
              • Exhibit 169: Givaudan SA - Key offerings
              • Exhibit 170: Givaudan SA - Segment focus
            • 12.13 Ingredion Inc.
              • Exhibit 171: Ingredion Inc. - Overview
              • Exhibit 172: Ingredion Inc. - Business segments
              • Exhibit 173: Ingredion Inc. - Key news
              • Exhibit 174: Ingredion Inc. - Key offerings
              • Exhibit 175: Ingredion Inc. - Segment focus
            • 12.14 Kerry Group Plc
              • Exhibit 176: Kerry Group Plc - Overview
              • Exhibit 177: Kerry Group Plc - Business segments
              • Exhibit 178: Kerry Group Plc - Key offerings
              • Exhibit 179: Kerry Group Plc - Segment focus
            • 12.15 Koninklijke DSM NV
              • Exhibit 180: Koninklijke DSM NV - Overview
              • Exhibit 181: Koninklijke DSM NV - Business segments
              • Exhibit 182: Koninklijke DSM NV - Key news
              • Exhibit 183: Koninklijke DSM NV - Key offerings
              • Exhibit 184: Koninklijke DSM NV - Segment focus
            • 12.16 Sensient Technologies Corp.
              • Exhibit 185: Sensient Technologies Corp. - Overview
              • Exhibit 186: Sensient Technologies Corp. - Business segments
              • Exhibit 187: Sensient Technologies Corp. - Key offerings
              • Exhibit 188: Sensient Technologies Corp. - Segment focus
            • 12.17 Tate and Lyle PLC
              • Exhibit 189: Tate and Lyle PLC - Overview
              • Exhibit 190: Tate and Lyle PLC - Business segments
              • Exhibit 191: Tate and Lyle PLC - Key news
              • Exhibit 192: Tate and Lyle PLC - Key offerings
              • Exhibit 193: Tate and Lyle PLC - Segment focus

            13 Appendix

            • 13.1 Scope of the report
              • 13.2 Inclusions and exclusions checklist
                • Exhibit 194: Inclusions checklist
                • Exhibit 195: Exclusions checklist
              • 13.3 Currency conversion rates for US$
                • Exhibit 196: Currency conversion rates for US$
              • 13.4 Research methodology
                • Exhibit 197: Research methodology
                • Exhibit 198: Validation techniques employed for market sizing
                • Exhibit 199: Information sources
              • 13.5 List of abbreviations
                • Exhibit 200: List of abbreviations

              Research Methodology

              Technavio presents a detailed picture of the market by way of study, synthesis, and summation of data from multiple sources. The analysts have presented the various facets of the market with a particular focus on identifying the key industry influencers. The data thus presented is comprehensive, reliable, and the result of extensive research, both primary and secondary.

              INFORMATION SOURCES

              Primary sources

              • Manufacturers and suppliers
              • Channel partners
              • Industry experts
              • Strategic decision makers

              Secondary sources

              • Industry journals and periodicals
              • Government data
              • Financial reports of key industry players
              • Historical data
              • Press releases

              DATA ANALYSIS

              Data Synthesis

              • Collation of data
              • Estimation of key figures
              • Analysis of derived insights

              Data Validation

              • Triangulation with data models
              • Reference against proprietary databases
              • Corroboration with industry experts

              REPORT WRITING

              Qualitative

              • Market drivers
              • Market challenges
              • Market trends
              • Five forces analysis

              Quantitative

              • Market size and forecast
              • Market segmentation
              • Geographical insights
              • Competitive landscape

              Interested in this report?

              Get your sample now to see our research methodology and insights!

              Download Now

              Frequently Asked Questions

              Specialty Food Ingredients market growth will increase by $ 59.02 bn during 2024-2028 .

              The Specialty Food Ingredients market is expected to grow at a CAGR of 6.94% during 2024-2028 .

              Specialty Food Ingredients market is segmented by Product( Nutraceutical Ingredients, Flavors, Specialty starches, Acidulants, Others) Application( Bakery and confectionary, Beverages, Sauces and condiments, Others, MEA)

              Advanced Food Systems Inc., Archer Daniels Midland Co., Ashland Inc., Axiom Foods Inc., Barentz International BV, Cargill Inc., Chr Hansen Holding AS, DuPont de Nemours Inc., Fonterra Cooperative Group Ltd., Givaudan SA, Ingredion Inc., Kerry Group Plc, Koninklijke DSM NV, Nagase and Co. Ltd., Roquette Freres SA, Sensient Technologies Corp., SubNutra Food Ingredients Pvt. Ltd., Tate and Lyle PLC, Woodland Foods Ltd. are a few of the key vendors in the Specialty Food Ingredients market.

              North America will register the highest growth rate of 28% among the other regions. Therefore, the Specialty Food Ingredients market in North America is expected to garner significant business opportunities for the vendors during the forecast period.

              US, Canada, Germany, UK, Italy, France, China, India, Japan, Brazil, Egypt, UAE, Oman, Argentina, KSA, UAE, Brazil, Rest of World (ROW)

              • Growing demand for plant-based specialty food ingredientsPlant-based ingredients are emerging as a significant driver in the global specialty food ingredient market is the driving factor this market.
              • fueled by shifting consumer preferences towards healthier is the driving factor this market.
              • sustainable is the driving factor this market.
              • and ethically sourced food options. With the rising popularity of plant-based diets and increased awareness of the environmental and ethical implications of animal agriculture is the driving factor this market.
              • the demand for plant-derived ingredients is experiencing unprecedented growth. Consumers are seeking alternatives to traditional animal-based ingredients is the driving factor this market.
              • such as proteins is the driving factor this market.
              • fats is the driving factor this market.
              • fibers is the driving factor this market.
              • flavors is the driving factor this market.
              • and colors is the driving factor this market.
              • driving innovation in plant-based specialty food ingredients. Manufacturers are responding by developing a diverse range of plant-based ingredients sourced from grains is the driving factor this market.
              • legumes is the driving factor this market.
              • nuts is the driving factor this market.
              • seeds is the driving factor this market.
              • fruits is the driving factor this market.
              • and vegetables is the driving factor this market.
              • offering functional properties and nutritional benefits comparable to their animal-derived counterparts. As the shift to plant-based diets continues to gain momentum is the driving factor this market.
              • plant-based ingredients are poised to play a pivotal role in shaping the future of the global specialty food ingredients market is the driving factor this market.
              • driving growth is the driving factor this market.
              • innovation is the driving factor this market.
              • and opportunities for manufacturers is the driving factor this market.
              • retailers is the driving factor this market.
              • and consumers alike. Thus is the driving factor this market.
              • the global specialty food ingredients market will witness positive growth during the forecast period. is the driving factor this market.

              The Specialty Food Ingredients market vendors should focus on grabbing business opportunities from the Nutraceutical Ingredients segment as it accounted for the largest market share in the base year.