
Specialty Pulp And Paper Chemicals Market Size 2026-2030
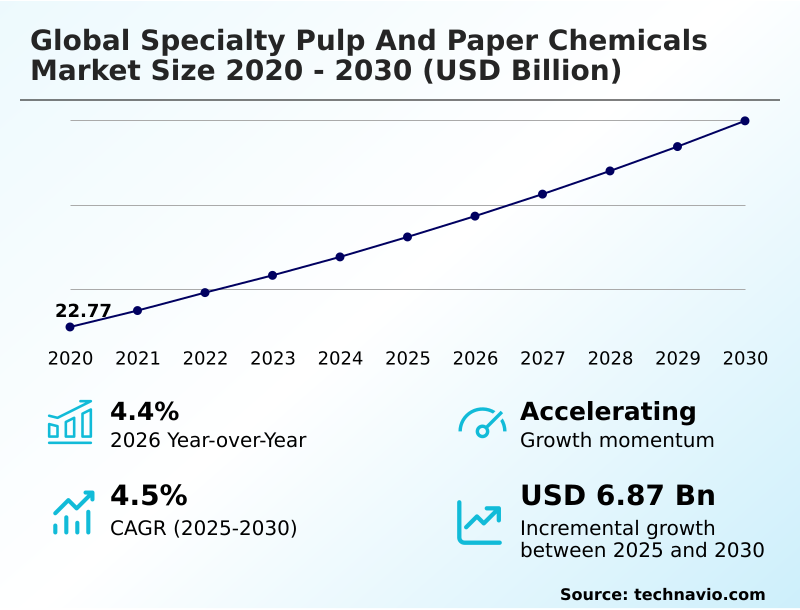
The specialty pulp and paper chemicals market size is valued to increase by USD 6.87 billion, at a CAGR of 4.5% from 2025 to 2030. Escalation of high strength additives for recycled fiber enhancement will drive the specialty pulp and paper chemicals market.
Major Market Trends & Insights
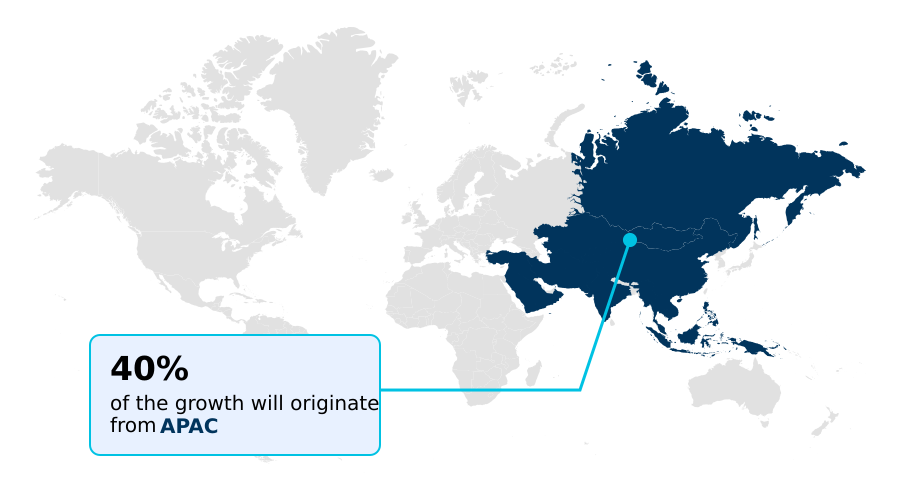
- APAC dominated the market and accounted for a 39.5% growth during the forecast period.
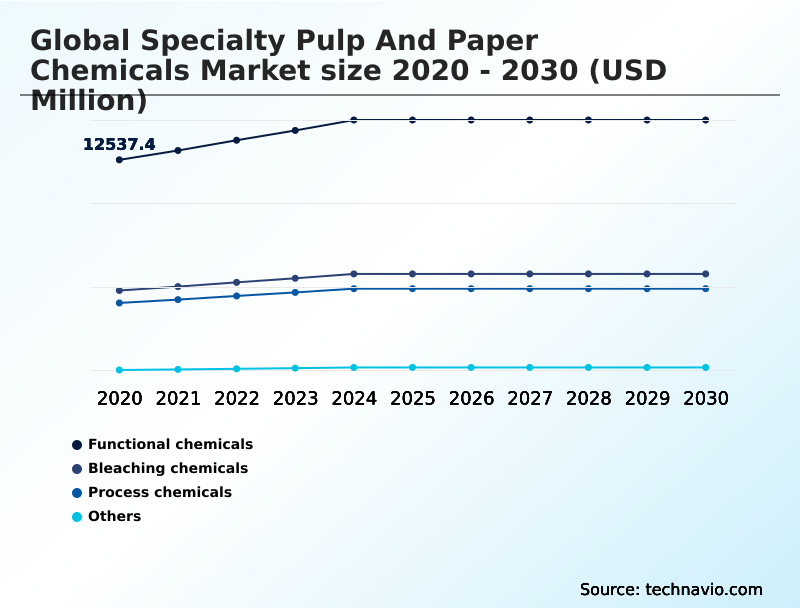
- By Type - Functional chemicals segment was valued at USD 14.79 billion in 2024
- By Application - Printing and writing segment accounted for the largest market revenue share in 2024
Market Size & Forecast
- Market Opportunities: USD 12.18 billion
- Market Future Opportunities: USD 6.87 billion
- CAGR from 2025 to 2030 : 4.5%
Market Summary
- The specialty pulp and paper chemicals market is undergoing a structural transformation, driven by the imperative to support a circular economy. Demand is shifting from conventional process aids to advanced functional additives that enable the use of recycled fibers and the replacement of single-use plastics.
- Key drivers include the need for superior barrier coatings in packaging and high-strength resins that maintain product integrity. In one business scenario, a paper mill integrates automated dosing systems to precisely apply de-inking agents and strength enhancers, allowing it to process a higher percentage of post-consumer waste while still meeting client specifications for high-quality containerboard.
- This trend is balanced by challenges such as raw material price volatility and stringent regulations mandating the phase-out of certain legacy chemicals. Concurrently, innovation is focused on bio-based and biodegradable solutions that improve both the performance and environmental profile of paper products, ensuring the industry's alignment with global sustainability goals.
- The development of green chemistry solutions is paramount for long-term resilience.
What will be the Size of the Specialty Pulp And Paper Chemicals Market during the forecast period?
Get Key Insights on Market Forecast (PDF) Get Free Sample
How is the Specialty Pulp And Paper Chemicals Market Segmented?
The specialty pulp and paper chemicals industry research report provides comprehensive data (region-wise segment analysis), with forecasts and estimates in "USD million" for the period 2026-2030, as well as historical data from 2020-2024 for the following segments.
- Type
- Functional chemicals
- Bleaching chemicals
- Process chemicals
- Others
- Application
- Printing and writing
- Packaging
- Tissue and hygiene
- Others
- Form factor
- Liquid
- Powder
- Granules
- End-user
- Paper mills
- Recycled paper processing
- Specialty paper manufacturers
- Geography
- APAC
- China
- Japan
- India
- North America
- US
- Canada
- Mexico
- Europe
- Germany
- UK
- France
- South America
- Brazil
- Argentina
- Middle East and Africa
- Saudi Arabia
- UAE
- South Africa
- Rest of World (ROW)
- APAC
By Type Insights
The functional chemicals segment is estimated to witness significant growth during the forecast period.
The functional chemicals segment is pivotal, directly imparting performance characteristics to final paper products.
These additives, including wet-strength resins and sizing agents, are crucial for improving paperboard strength properties to meet the demands of the e-commerce sector, which requires high corrugated box integrity.
The market is moving toward high-performance functional agents that permit the use of lighter-weight packaging materials without sacrificing durability. This shift is driven by the need for enhanced moisture resistance in food-grade container solutions.
For instance, advanced polymeric structures enable a 15% reduction in fiber usage while maintaining required tensile strength, aligning with sustainability and cost-efficiency goals through effective wet-end chemistry optimization.
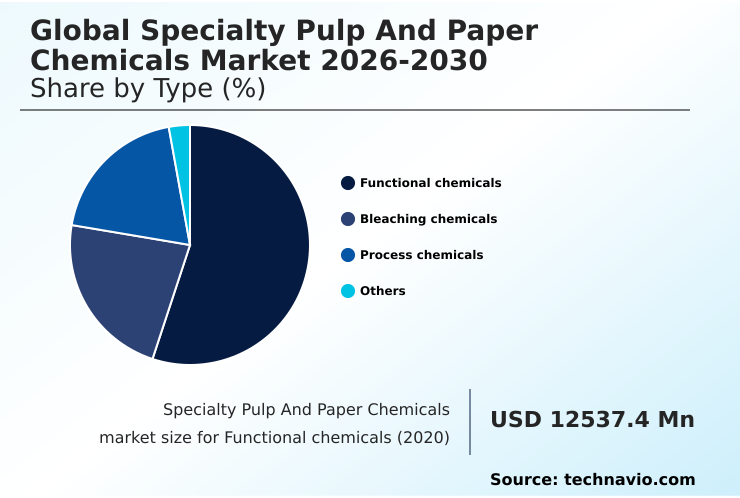
The Functional chemicals segment was valued at USD 14.79 billion in 2024 and showed a gradual increase during the forecast period.
Regional Analysis
APAC is estimated to contribute 39.5% to the growth of the global market during the forecast period.Technavio’s analysts have elaborately explained the regional trends and drivers that shape the market during the forecast period.
See How Specialty Pulp And Paper Chemicals Market Demand is Rising in APAC Get Free Sample
The geographic landscape is characterized by distinct regional priorities. In APAC, market expansion is driven by industrial-scale production, where investments in new facilities prioritize high-volume output of bleaching chemicals and process aids to support the region’s growing demand for packaging.
This region accounts for nearly 40% of the market's incremental growth. In contrast, North America and Europe focus on modernizing existing infrastructure with automated dosing architectures and closed-loop water systems, driven by stringent environmental regulations.
European mills, for example, have achieved a 20% reduction in water usage through such upgrades.
This divergence highlights a global market where growth in developing regions is based on capacity, while mature markets focus on efficiency, sustainability, and high-value applications like food-grade container solutions and premium printing and writing paper quality.
Market Dynamics
Our researchers analyzed the data with 2025 as the base year, along with the key drivers, trends, and challenges. A holistic analysis of drivers will help companies refine their marketing strategies to gain a competitive advantage.
- Strategic development in the global specialty pulp and paper chemicals market 2026-2030 is increasingly centered on balancing performance with sustainability. The focus on improving paper recycling efficiency with chemicals is driving significant research into advanced formulations. Innovations in bio-based additives for papermaking are becoming crucial as the industry moves away from traditional inputs.
- This transition is most evident in the development of specialty chemicals for food packaging, where there is intense pressure to eliminate harmful substances. The cost of pfas-free barrier coating remains a key consideration, but regulatory mandates are accelerating its adoption. Mills are investing in technologies that support these green initiatives while also targeting operational gains.
- For instance, implementing advanced systems for reducing paper mill water consumption has shown to decrease water use by over 15% compared to legacy processes. This dual focus on ecological compliance and economic efficiency underscores the industry's trajectory.
- As a result, chemical suppliers that offer comprehensive solutions addressing both performance and environmental impact are gaining a competitive advantage, shaping the future of paper and packaging production.
What are the key market drivers leading to the rise in the adoption of Specialty Pulp And Paper Chemicals Industry?
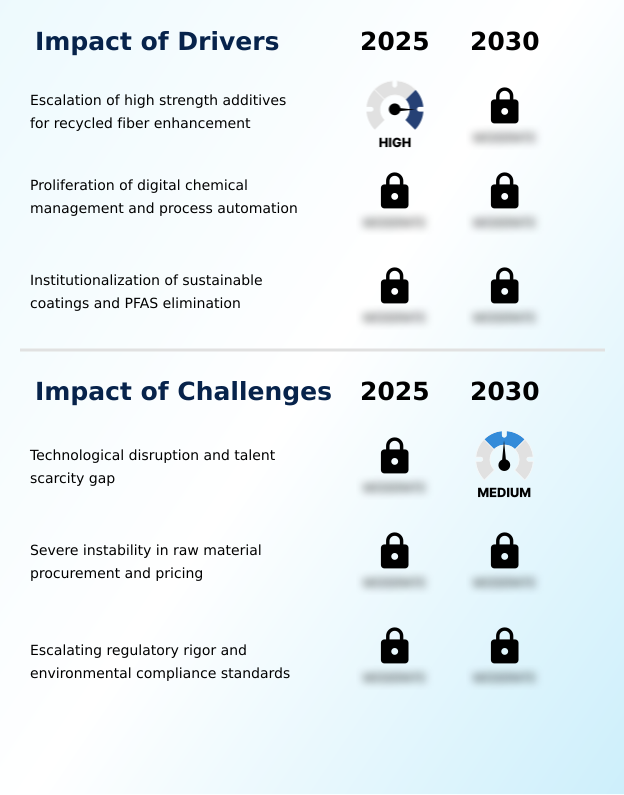
- A key market driver is the escalating demand for high-strength additives that enhance the quality and performance of recycled fibers.
- Market growth is significantly driven by the demand for high-performance strength additives, which are essential for recycled fiber enhancement.
- As manufacturers increase their use of secondary fibers, these chemicals enable them to maintain corrugated box integrity and overall paperboard strength properties, allowing for up to a 20% increase in recycled content without performance loss.
- Another major driver is the institutionalization of sustainable barrier coatings as circular economy enablers. The mandatory phase-out of legacy chemicals under pfas elimination rules has spurred innovation in eco-friendly alternatives.
- This transition allows paper-based materials to effectively replace plastics in many applications, meeting both regulatory requirements and consumer preferences for sustainable packaging solutions.
What are the market trends shaping the Specialty Pulp And Paper Chemicals Industry?
- The market is witnessing a significant trend toward the rise of intelligent process automation and the adoption of real-time control systems to enhance manufacturing efficiency.
- Key trends are reshaping the market, led by the integration of intelligent process automation for wet-end chemistry optimization. This shift toward real-time chemical control allows mills to manage the variable characteristics of pulp slurry with unprecedented precision, with some operators reporting a 15% reduction in additive consumption.
- Concurrently, the adoption of bio-based functional chemicals is accelerating, driven by demand for sustainable fiber-based substrates. The use of biodegradable coating additives is not only a response to regulatory pressure but also a market differentiator, improving a product's circular economy profile. These innovations in green chemistry solutions are critical for developing next-generation packaging with enhanced moisture resistance and strength.
What challenges does the Specialty Pulp And Paper Chemicals Industry face during its growth?
- A significant challenge affecting industry growth is the ongoing technological disruption coupled with a scarcity of specialized technical talent.
- The industry faces considerable challenges, including the talent scarcity gap for managing advanced digital chemical management systems, which can delay the adoption of efficiency-improving technologies. Severe instability in raw material procurement leads to price volatility, compressing margins by as much as 10% in some quarters. Furthermore, escalating regulatory rigor requires continuous investment in R&D to ensure non-toxic material compliance.
- The development of effective effluent treatment chemicals is now a baseline requirement to meet stricter discharge limits. This complex environment forces manufacturers to balance innovation and cost control, making strategic sourcing and workforce development critical for maintaining competitiveness and navigating the path to more sustainable operations.
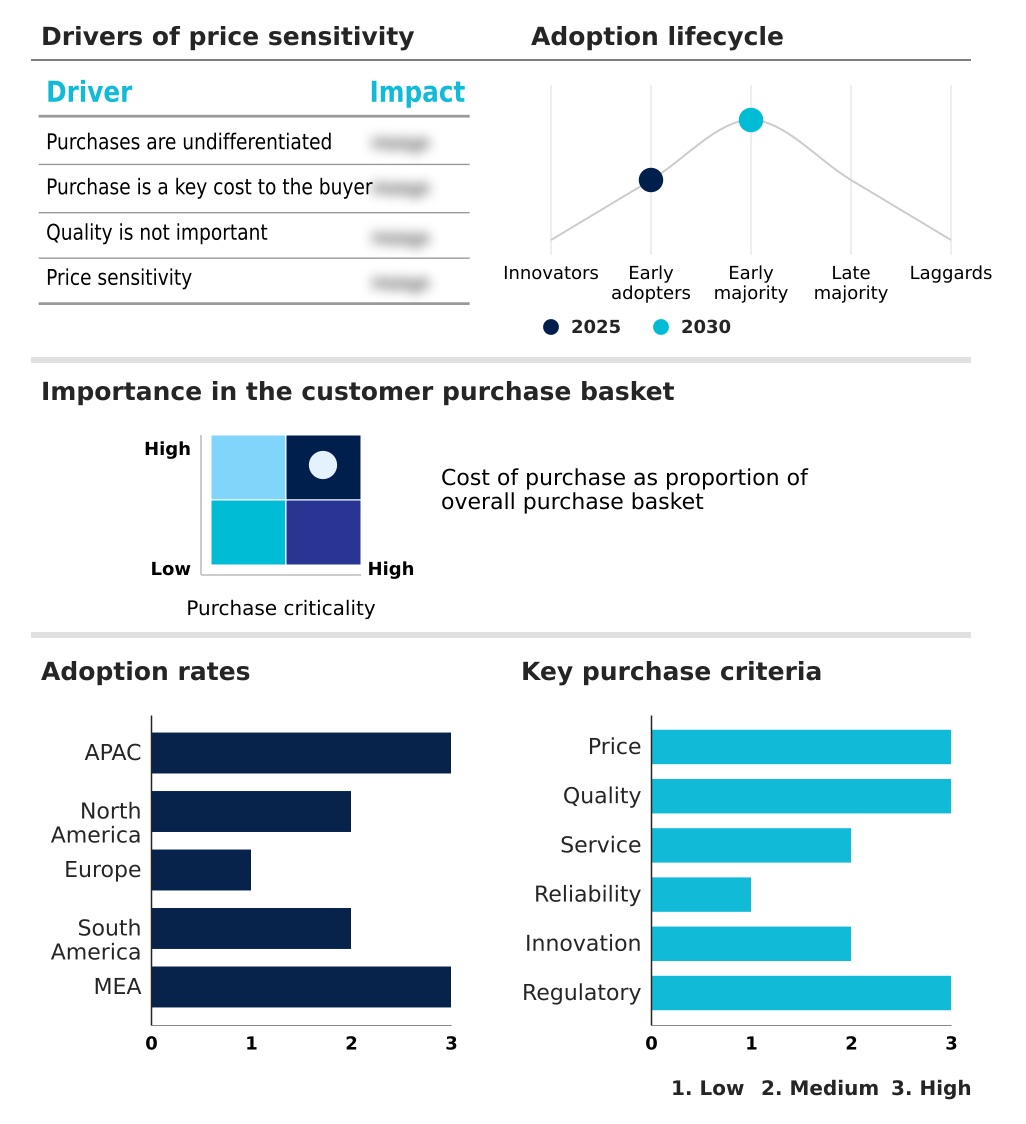
Exclusive Technavio Analysis on Customer Landscape
The specialty pulp and paper chemicals market forecasting report includes the adoption lifecycle of the market, covering from the innovator’s stage to the laggard’s stage. It focuses on adoption rates in different regions based on penetration. Furthermore, the specialty pulp and paper chemicals market report also includes key purchase criteria and drivers of price sensitivity to help companies evaluate and develop their market growth analysis strategies.
Customer Landscape of Specialty Pulp And Paper Chemicals Industry
Competitive Landscape
Companies are implementing various strategies, such as strategic alliances, specialty pulp and paper chemicals market forecast, partnerships, mergers and acquisitions, geographical expansion, and product/service launches, to enhance their presence in the industry.
Archroma Management - Delivering specialized chemical solutions for the packaging, paper, and coatings industries, focusing on enhanced product performance and aesthetic quality across various applications.
The industry research and growth report includes detailed analyses of the competitive landscape of the market and information about key companies, including:
- Archroma Management
- BASF SE
- Buckman Laboratories
- Cargill Inc.
- Dow Chemical Co.
- Ecolab Inc.
- ERCO Worldwide
- Evonik Industries AG
- Feralco AB
- Harima Chemicals Group
- Imerys S.A.
- Kemira Oyj
- Kurita Water Industries Ltd
- Nouryon Chemicals Holding B.V.
- Olin Corp.
- Omya International AG
- Roquette Freres SA
- SNF Group
- Solenis
- The Chemours Co.
Qualitative and quantitative analysis of companies has been conducted to help clients understand the wider business environment as well as the strengths and weaknesses of key industry players. Data is qualitatively analyzed to categorize companies as pure play, category-focused, industry-focused, and diversified; it is quantitatively analyzed to categorize companies as dominant, leading, strong, tentative, and weak.
Recent Development and News in Specialty pulp and paper chemicals market
- In March 2025, Kemira announced a significant expansion of its production capacity for paper and board chemicals in Thailand to meet growing regional and global demand for functional packaging additives.
- In April 2025, Clariant launched Ceridust 1310, a bio-based deinking aid derived from renewable fatty acids, which serves as a critical substitution for synthetic chemical surfactants in the recycling process.
- In March 2025, Nouryon unveiled Eka HP Puroxide, a hydrogen peroxide product with a significantly low carbon footprint, designed to help pulp and paper clients reduce their Scope 3 greenhouse gas emissions.
- In August 2025, the European Union imposed significant new tariffs on specific paper-based products from international trading partners to address environmental and trade imbalances.
Dive into Technavio’s robust research methodology, blending expert interviews, extensive data synthesis, and validated models for unparalleled Specialty Pulp And Paper Chemicals Market insights. See full methodology.
| Market Scope | |
|---|---|
| Page number | 329 |
| Base year | 2025 |
| Historic period | 2020-2024 |
| Forecast period | 2026-2030 |
| Growth momentum & CAGR | Accelerate at a CAGR of 4.5% |
| Market growth 2026-2030 | USD 6867.3 million |
| Market structure | Fragmented |
| YoY growth 2025-2026(%) | 4.4% |
| Key countries | China, Japan, India, South Korea, Indonesia, Australia, US, Canada, Mexico, Germany, UK, France, Italy, Spain, The Netherlands, Brazil, Argentina, Chile, Saudi Arabia, UAE, South Africa, Turkey and Israel |
| Competitive landscape | Leading Companies, Market Positioning of Companies, Competitive Strategies, and Industry Risks |
Research Analyst Overview
- The specialty pulp and paper chemicals market is advancing beyond mere commodity supply to become a critical enabler of the circular economy. This evolution is defined by the integration of intelligent process automation and sophisticated digital chemical management systems.
- Boardroom decisions are increasingly influenced by the need to adopt green chemistry solutions, not just for compliance with regulations like PFAS elimination, but as a strategic imperative for operational resilience. For example, deploying automated dosing architectures for functional chemicals such as wet-strength resins and sizing agents can reduce chemical waste by 25%.
- This move toward precision is vital for optimizing process chemicals like retention aids and defoamers. The development of advanced aqueous-based coatings and bio-based binders is facilitating the shift to sustainable fiber-based packaging. Innovations like enzymatic bleaching platforms, alkyl ketene dimer, and alkenyl succinic anhydride are improving fiber quality while minimizing environmental impact.
- The industry's trajectory is toward high-performance strength additives and specialized agents like hydrogen peroxide, sodium chlorate, and chlorine dioxide that enhance efficiency and product quality.
What are the Key Data Covered in this Specialty Pulp And Paper Chemicals Market Research and Growth Report?
-
What is the expected growth of the Specialty Pulp And Paper Chemicals Market between 2026 and 2030?
-
USD 6.87 billion, at a CAGR of 4.5%
-
-
What segmentation does the market report cover?
-
The report is segmented by Type (Functional chemicals, Bleaching chemicals, Process chemicals, and Others), Application (Printing and writing, Packaging, Tissue and hygiene, and Others), Form Factor (Liquid, Powder, and Granules), End-user (Paper mills, Recycled paper processing, and Specialty paper manufacturers) and Geography (APAC, North America, Europe, South America, Middle East and Africa)
-
-
Which regions are analyzed in the report?
-
APAC, North America, Europe, South America and Middle East and Africa
-
-
What are the key growth drivers and market challenges?
-
Escalation of high strength additives for recycled fiber enhancement, Technological disruption and talent scarcity gap
-
-
Who are the major players in the Specialty Pulp And Paper Chemicals Market?
-
Archroma Management, BASF SE, Buckman Laboratories, Cargill Inc., Dow Chemical Co., Ecolab Inc., ERCO Worldwide, Evonik Industries AG, Feralco AB, Harima Chemicals Group, Imerys S.A., Kemira Oyj, Kurita Water Industries Ltd, Nouryon Chemicals Holding B.V., Olin Corp., Omya International AG, Roquette Freres SA, SNF Group, Solenis and The Chemours Co.
-
Market Research Insights
- Market dynamics are increasingly shaped by the push for sustainability and operational efficiency. The adoption of renewable sizing agents and biodegradable coating additives is becoming standard as companies aim for non-toxic material compliance, with successful implementation leading to a 10% improvement in product recyclability ratings. This shift supports the development of new food-grade container solutions.
- Furthermore, enhancing corrugated box integrity through advanced chemicals allows manufacturers to reduce material weight by up to 15% without compromising strength. The focus on tissue and hygiene softness continues to drive innovation in debonders, while improvements in printing and writing paper quality are tied to specialized surface treatments. Firms that successfully optimize their chemical use can achieve significant operational gains.
We can help! Our analysts can customize this specialty pulp and paper chemicals market research report to meet your requirements.
 RIA -
RIA - 
