Sponge And Scouring Pads Market Size 2025-2029
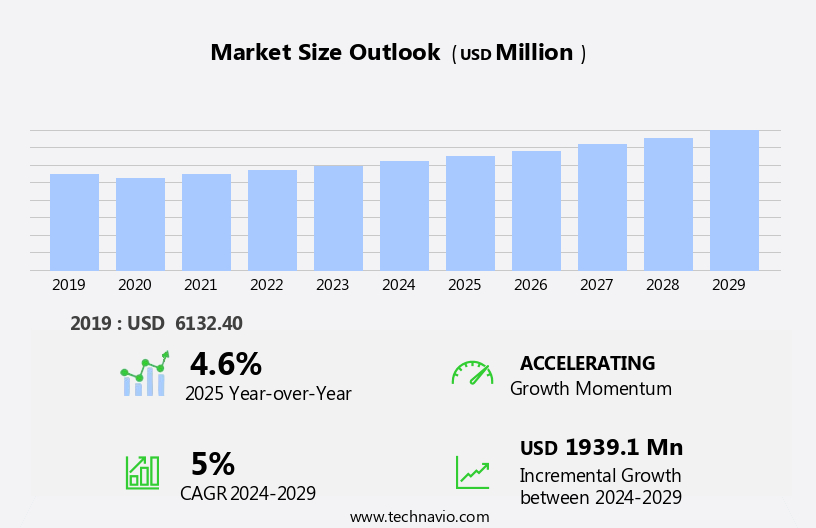
The sponge and scouring pads market size is forecast to increase by USD 1.94 billion at a CAGR of 5% between 2024 and 2029.
- The market is experiencing significant growth, driven by the increasing adoption of online sales channels. Consumers are increasingly turning to e-commerce platforms to purchase household essentials, including sponge and scouring pads, due to the convenience and accessibility offered. Moreover, the introduction of eco-friendly sponge and scouring pads made from sustainable raw materials is another key trend in the market. However, the market faces challenges, including regulatory hurdles that impact adoption due to stringent regulations regarding the use of certain raw materials. Additionally, the presence of counterfeit products in the market can negatively impact the reputation of legitimate brands and pose a threat to consumer safety. Electronics cleaning wipes, cleanroom wipes, and medical device cleaning wipes address industry-specific requirements.
- Companies seeking to capitalize on market opportunities must focus on innovation, ensuring compliance with regulations, and implementing robust supply chain management strategies to mitigate the risk of counterfeit products entering the market. Single-use wipes, including sanitizing, personal care, and antibacterial variants, prioritize germ protection and convenience. By addressing these challenges and leveraging the growing online sales trend, players in the market can effectively navigate the competitive landscape and capture market share.
What will be the Size of the Sponge And Scouring Pads Market during the forecast period?
- The market exhibits dynamic purchasing habits, with consumers increasingly prioritizing product quality and brand loyalty. Renewable resources, such as melamine foam and bio-based materials, are gaining traction due to consumer trends toward sustainability. Product comparisons, driven by customer reviews and industry regulations, favor stainless steel scouring pads and non-woven fabric sponges for their durability and cleaning efficiency. Manufacturing processes are innovating with the integration of abrasive particles, synthetic fibers, and natural fibers to cater to diverse customer needs. Cleaning agents and anti-microbial/anti-bacterial agents are essential components, ensuring effective cleaning solutions. Industry regulations and social media marketing play a significant role in product awareness and performance standards. Bleach, chlorine, and alcohol wipes serve specific disinfection needs.
- The product life cycle is evolving, with a focus on manufacturing efficiency and circular economy principles. Sustainability initiatives, such as using recycled materials and reducing environmental impact, are becoming key differentiators. Digital marketing and online shopping platforms facilitate customer access to a wide range of cleaning solutions, enabling informed purchasing decisions. The innovation pipeline includes advanced materials and technologies, ensuring the market remains competitive and responsive to consumer demands.
How is this Sponge And Scouring Pads Industry segmented?
The sponge and scouring pads industry research report provides comprehensive data (region-wise segment analysis), with forecasts and estimates in "USD million" for the period 2025-2029, as well as historical data from 2019-2023 for the following segments.
- End-user
- Residential
- Non residential
- Distribution Channel
- Offline
- Online
- Product
- Natural
- Synthetic
- Geography
- North America
- US
- Canada
- Europe
- France
- Germany
- Italy
- UK
- APAC
- China
- India
- Japan
- South Korea
- Rest of World (ROW)
- North America
By End-user Insights
The residential segment is estimated to witness significant growth during the forecast period. The market is driven by the residential segment due to the importance of hygiene and cleanliness in households. These products are essential for mild to moderate cleaning tasks, particularly in kitchens where they are used for utensil cleaning, cookware, metal-finished surfaces, glassware, ovens, and grills. APAC holds a significant market share, primarily due to the large average household size and increasing household expenditure. The manufacturing process ensures high cleaning power and durability, making these products a valuable addition to kitchens. Distribution channels include retail and online marketplaces, ensuring easy accessibility for customers. Supermarkets, hypermarkets, convenience stores, and wholesale distributors offer various pack sizes, brands, and material options, enabling consumers to physically evaluate product quality and compare features. Brands focus on product innovation, performance testing, and recycled materials to enhance the value proposition and brand awareness.
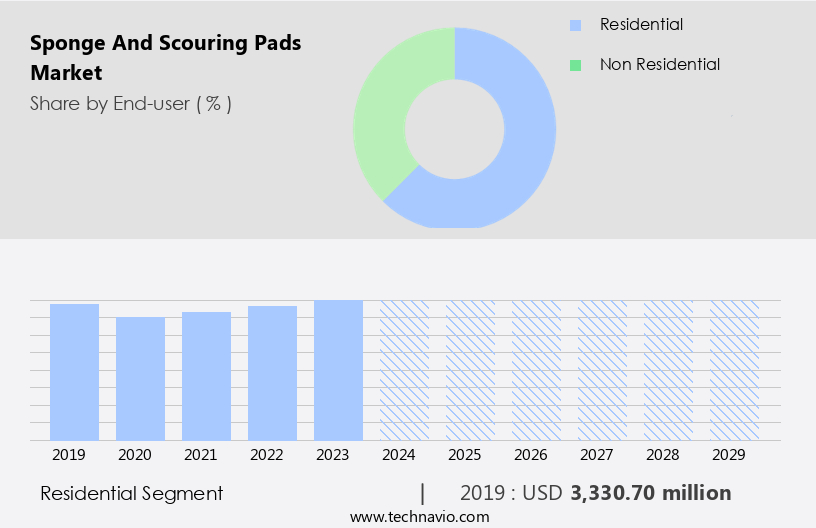
The Residential segment was valued at USD 3.33 billion in 2019 and showed a gradual increase during the forecast period. The market's growth is further fueled by the increasing demand for personal care wipes, such as baby wipes and antibacterial wipes, which offer convenience and germ protection. Industrial and commercial sectors also utilize sponges and scouring pads for heavy-duty cleaning tasks such as commercial kitchens, bathrooms, and industrial equipment. Marketing strategies product differentiation through abrasive cleaning levels, odor removal, grease removal, and stain removal capabilities. Pricing strategies and supply chain management are crucial to maintain competitiveness. The demand for household cleaning products, including sponge wipes, is expected to increase. Material science plays a significant role in enhancing germ protection, food safety, and shelf life, ensuring customer satisfaction.
Regional Analysis
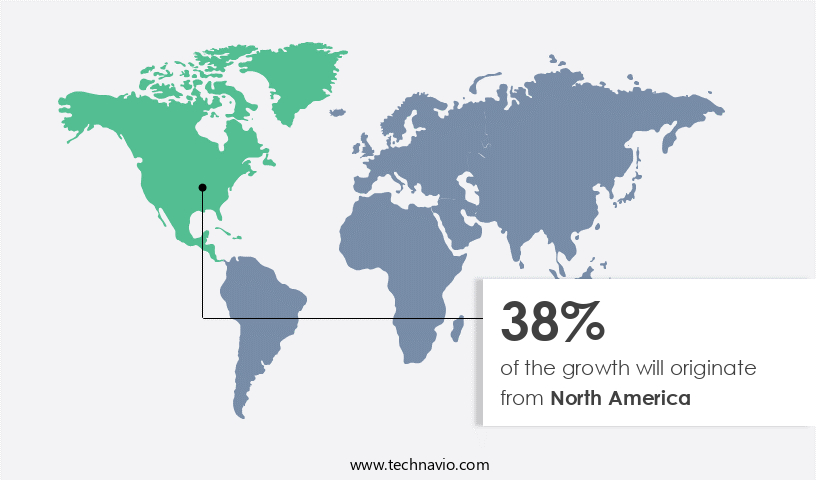
North America is estimated to contribute 38% to the growth of the global market during the forecast period. Technavio's analysts have elaborately explained the regional trends and drivers that shape the market during the forecast period.
The sponges and scouring pads market in APAC is experiencing significant growth due to the expanding food service industry and increasing consumer demand for effective cleaning solutions. China, Japan, and India are the major contributors to this market's growth, with China being the leading consumer of these products. The large populations in India and China increase per-unit consumption, making these countries essential markets for manufacturers. Manufacturing processes focus on ensuring high-quality products with excellent cleaning power for various applications, including utensil cleaning, household cleaning, and industrial cleaning. Distribution channels prioritize efficient supply chain management to meet the increasing demand. In the commercial sector, industries such as healthcare, hospitality, food service, and retail have significantly heightened their hygiene protocols.
Brands invest in marketing strategies to increase brand awareness and differentiate their products through innovation and performance testing. Products cater to diverse needs, such as odor removal, grease removal, and stain removal, making them suitable for kitchen cleaning, commercial cleaning, bathroom cleaning, and surface cleaning. Retail packaging plays a crucial role in attracting customers, while recycled materials and competitive pricing strategies cater to eco-conscious consumers. Material science and food safety are essential considerations in the manufacturing process to ensure germ protection and long shelf life. Performance testing is crucial to meet the evolving needs of customers, who increasingly rely on product reviews and online marketplaces for purchasing decisions.
The market's focus on value proposition, abrasive cleaning, and water absorption continues to drive innovation and growth. Companies are investing in product development, ensuring their offerings cater to various industries, including food service and commercial cleaning. The market's competitive landscape remains dynamic, with manufacturers continually seeking to differentiate their products and maintain a competitive advantage.
Market Dynamics
Our researchers analyzed the data with 2024 as the base year, along with the key drivers, trends, and challenges. A holistic analysis of drivers will help companies refine their marketing strategies to gain a competitive advantage.
What are the Sponge And Scouring Pads market drivers leading to the rise in the adoption of Industry?
- The significant growth in the adoption of online sales channels is the primary factor fueling market expansion. The global market for sponges and scouring pads is experiencing significant growth due to several factors. With the rise of online shopping, consumers now have a multitude of choices and convenience at their fingertips. They can easily compare prices and make informed decisions from the comfort of their homes. This shift to online purchasing channels is driving market growth, enabling companies to expand their customer base beyond geographical boundaries. Additionally, the evolution of the retail industry is providing opportunities for businesses to target new segments and retain existing customers through innovative online strategies.
- Furthermore, the demand for sponges and scouring pads remains high in both utensil cleaning and household cleaning applications. The manufacturing process continues to prioritize customer satisfaction and cleaning power to meet the evolving needs of consumers in industrial and household settings. Companies are focusing on brand awareness and operational efficiencies to remain competitive in this market.
What are the Sponge And Scouring Pads market trends shaping the Industry?
- The introduction of eco-friendly sponges and scouring pads made from sustainable raw materials is a significant market trend. This shift towards more environmentally conscious household cleaning solutions is gaining momentum. The market for sponges and scouring pads, particularly those made of natural and eco-friendly materials, has experienced significant growth in recent years due to increasing consumer awareness and concerns regarding health and environmental impacts. These products, made from renewable resources like wood pulp and cotton fiber, offer a sustainable alternative to traditional plastic or polyester sponges and scouring pads. The biodegradable nature of these materials ensures fewer toxins are released during use and they can easily decompose after disposal. In terms of performance, eco-friendly sponges and scouring pads deliver effective odor removal and grease cutting capabilities, making them suitable for both residential and food service industries.
- Product innovation and rigorous performance testing are crucial in this market to meet the evolving needs of consumers and businesses. Positive product reviews further fuel demand, making eco-friendly sponges and scouring pads a smart choice for those seeking a responsible and effective kitchen cleaning solution.
How does Sponge And Scouring Pads market faces challenges face during its growth?
- The proliferation of counterfeit products poses a significant challenge to the industry's growth trajectory. It is essential for businesses to implement robust anti-counterfeiting measures to safeguard their brand reputation and consumer trust. This issue not only undermines the industry's revenue potential but also jeopardizes the health and safety of consumers. Consequently, collaboration between industry stakeholders, regulatory bodies, and law enforcement agencies is crucial in mitigating the impact of counterfeit products on the industry. The market faces challenges from the proliferation of counterfeit products. These imitation items, available primarily through online marketplaces, pose risks to consumers due to their unknown origins and potentially harmful ingredients. Despite their lower prices, these counterfeits undermine the competitive advantage of genuine brands in terms of stain removal efficiency, water absorption capacity, and product durability. Counterfeit products often mimic the branding of reputable companies, making it difficult for consumers to distinguish them. The me-too branding strategy employed by counterfeiters further complicates matters. These products, while visually similar to authentic ones, may not meet safety standards and can be hazardous to use.
- The online marketplace's vast and unregulated nature exacerbates the issue, as it is more challenging to monitor and enforce regulations compared to traditional retail channels. As a result, consumers are advised to exercise caution and verify the authenticity of products before making a purchase. In commercial cleaning applications, particularly in bathroom cleaning, it is crucial to use genuine sponge and scouring pads to maintain hygiene and ensure effective cleaning. Product differentiation is essential in this market, with authentic brands focusing on abrasive cleaning technologies, innovative materials, and safety certifications to distinguish themselves from counterfeits.
Exclusive Customer Landscape
The sponge and scouring pads market forecasting report includes the adoption lifecycle of the market, covering from the innovator's stage to the laggard's stage. It focuses on adoption rates in different regions based on penetration. Furthermore, the sponge and scouring pads market report also includes key purchase criteria and drivers of price sensitivity to help companies evaluate and develop their market growth analysis strategies.

Customer Landscape
Key Companies & Market Insights
Companies are implementing various strategies, such as strategic alliances, sponge and scouring pads market forecast, partnerships, mergers and acquisitions, geographical expansion, and product/service launches, to enhance their presence in the industry.
3M Co. - The company specializes in providing high-quality cleaning solutions, including sponge and scouring pads such as the 3M kitchen cleaning pad, restroom cleaning pad, and ScotchBrite scrub net sponge.
The industry research and growth report includes detailed analyses of the competitive landscape of the market and information about key companies, including:
- 3M Co.
- Americo Manufacturing Co.
- Amway Corp.
- ARIX POLSKA SP.zo.o.
- Armaly Brands Inc.
- Bio90 Manufacturing Canada Inc.
- Bombril
- Corazzi Fibre Srl
- Freudenberg and Co. KG
- Fuller Brush Co.
- Henkel AG and Co. KGaA
- Jyothy Labs Ltd.
- Kiwi Scourers Ltd.
- Newell Brands Inc.
- Scrub Daddy Inc.
- Sponge Technology Corp. LLC
- The Clorox Co.
- The Crown Choice
- The Libman Co.
- Weiman Products LLC
Qualitative and quantitative analysis of companies has been conducted to help clients understand the wider business environment as well as the strengths and weaknesses of key industry players. Data is qualitatively analyzed to categorize companies as pure play, category-focused, industry-focused, and diversified; it is quantitatively analyzed to categorize companies as dominant, leading, strong, tentative, and weak.
Recent Development and News in Sponge And Scouring Pads Market
- In February 2023, Dyson, a leading technology company, expanded its product portfolio by introducing the new Dyson SpongeScourer, a reusable and recyclable sponge made from plant-based materials. This innovative product aims to reduce plastic waste in the cleaning industry (Dyson, 2023).
- In May 2024, 3M, a prominent industrial corporation, announced a strategic partnership with Ecover, a leading European eco-friendly cleaning products manufacturer. The collaboration focuses on co-creating new scouring pad solutions using 3M's advanced abrasive technologies and Ecover's sustainable production methods (3M, 2024).
- In October 2024, Berkshire Hathaway, through its subsidiary, 3BH Labs, acquired Scour-Lock, a leading manufacturer of industrial scouring pads. This acquisition strengthens Berkshire Hathaway's presence in the industrial cleaning market and provides Scour-Lock with access to significant resources for growth and innovation (Berkshire Hathaway, 2024).
- In March 2025, the European Union implemented a new regulation banning the use of microplastics in cleaning products, including scouring pads, from 2027. This regulatory initiative is expected to significantly impact the market, driving demand for eco-friendly alternatives made from natural materials (European Commission, 2025).
Research Analyst Overview
The sponge and scouring pad market continues to evolve, driven by customer satisfaction and advancements in manufacturing processes. These essential tools find applications in various sectors, including utensil cleaning, household cleaning, industrial cleaning, and commercial cleaning. The value proposition of sponges and scouring pads lies in their ability to provide superior cleaning power, with applications ranging from bathroom cleaning to kitchen surfaces. Brand awareness and marketing strategy are crucial factors in the market's dynamics. Manufacturers invest in product innovation, performance testing, odor removal, grease removal, and stain removal to differentiate their offerings. Product reviews and online marketplaces play a significant role in shaping consumer preferences.
The use of recycled materials and sustainable pricing strategies contribute to the market's growth. Supply chain management and water absorption capabilities are essential considerations for manufacturers seeking a competitive advantage. Material science and germ protection are also key areas of focus, with food safety and shelf life being critical factors in the food service and retail packaging industries. The market's continuous unfolding is reflected in the ongoing development of abrasive cleaning technologies and the integration of advanced performance features. The evolving patterns in the market highlight the importance of staying attuned to customer needs and market trends to remain competitive.
Dive into Technavio's strong research methodology, blending expert interviews, extensive data synthesis, and validated models for unparalleled Sponge And Scouring Pads Market insights. See full methodology.
|
Market Scope |
|
|
Report Coverage |
Details |
|
Page number |
214 |
|
Base year |
2024 |
|
Historic period |
2019-2023 |
|
Forecast period |
2025-2029 |
|
Growth momentum & CAGR |
Accelerate at a CAGR of 5% |
|
Market growth 2025-2029 |
USD 1.94 billion |
|
Market structure |
Fragmented |
|
YoY growth 2024-2025(%) |
4.6 |
|
Key countries |
US, China, Japan, India, UK, South Korea, France, Germany, Italy, and Canada |
|
Competitive landscape |
Leading Companies, Market Positioning of Companies, Competitive Strategies, and Industry Risks |
What are the Key Data Covered in this Sponge And Scouring Pads Market Research and Growth Report?
- CAGR of the Sponge And Scouring Pads industry during the forecast period
- Detailed information on factors that will drive the growth and forecasting between 2025 and 2029
- Precise estimation of the size of the market and its contribution of the industry in focus to the parent market
- Accurate predictions about upcoming growth and trends and changes in consumer behaviour
- Growth of the market across APAC, North America, Europe, Middle East and Africa, and South America
- Thorough analysis of the market's competitive landscape and detailed information about companies
- Comprehensive analysis of factors that will challenge the sponge and scouring pads market growth of industry companies
We can help! Our analysts can customize this sponge and scouring pads market research report to meet your requirements.
 RIA -
RIA - 
