Spoolable Pipes Market Size 2024-2028
The spoolable pipes market size is forecast to increase by USD 616.8 million, at a CAGR of 5.2% between 2023 and 2028.
- The market is witnessing significant growth, driven primarily by the increasing trend towards ultra-deep drilling activities. This technique, which involves drilling beyond 30,000 feet, necessitates the use of flexible pipes, such as spoolable pipes, to ensure efficient and cost-effective drilling operations. However, the market also faces challenges due to the fragility of spoolable pipes. These pipes, which are made of thermoplastic materials, are susceptible to damage from high temperatures and pressures, requiring careful handling and maintenance. As the drilling industry continues to push the boundaries of deep drilling, companies must address these challenges to capitalize on the market's potential.
- Effective solutions could include the development of more durable materials, advanced manufacturing techniques, and improved installation and maintenance processes. By addressing these challenges, market participants can seize opportunities in the expanding ultra-deep drilling sector and stay competitive in the dynamic the market.
What will be the Size of the Spoolable Pipes Market during the forecast period?

Explore in-depth regional segment analysis with market size data - historical 2018-2022 and forecasts 2024-2028 - in the full report.
Request Free Sample
The market continues to evolve, driven by advancements in technology and the expanding applications across various sectors. Protective coatings play a crucial role in ensuring the longevity and performance of these pipes, with entities such as polyurethane and epoxy coatings gaining prominence. Pipe fittings, including electrofusion welding and flanged connections, facilitate seamless integration in pipeline networks. Pneumatic testing, fluid dynamics, and pressure testing are essential components of pipeline management systems, ensuring optimal flow rate and pressure drop. Corrosion inhibitors and pipe rehabilitation techniques, including fiber-reinforced polymer pipes and pipe lining, mitigate the impact of corrosion on pipeline integrity.
Industrial pipelines, including high-pressure pipes and chemical pipelines, require robust solutions for insulation, with acoustic and thermal insulation proving effective. Mechanical engineering innovations, such as directional drilling and trenchless technology, enable efficient pipe installation and minimize disruption. Pipeline networks encompass a diverse range of applications, from water pipelines and oil pipelines to gas pipelines and hydrostatic testing. The ongoing development of pipeline management systems, welding techniques, and non-destructive testing ensures continuous improvement in pipeline integrity management. Material science advances continue to influence the market, with an emphasis on corrosion resistance and the use of reinforced pipes. Ball valves, check valves, globe valves, and butterfly valves ensure efficient control and maintenance of pipeline systems.
The market's continuous dynamism is further reflected in the adoption of innovative technologies, such as pipe bursting and pipe pigging, and the ongoing research and development in pipeline networks and fluid dynamics.
How is this Spoolable Pipes Industry segmented?
The spoolable pipes industry research report provides comprehensive data (region-wise segment analysis), with forecasts and estimates in "USD million" for the period 2024-2028, as well as historical data from 2018-2022 for the following segments.
- Type
- Thermoplastic
- Thermoset
- Geography
- North America
- US
- Canada
- Europe
- France
- Germany
- Spain
- UK
- APAC
- China
- India
- Japan
- South Korea
- Rest of World (ROW)
- North America
By Type Insights
The thermoplastic segment is estimated to witness significant growth during the forecast period.
Spoolable thermoplastic pipes, including reinforced thermoplastic pipes (RTP), offer durability and strength comparable to steel pipes. With corrosion resistance and the ability to withstand pressures ranging from 200-4,000 psi, these pipes are a viable alternative. Available in diameters from 2 inches to 8 inches, their multi-layer coatings ensure enhanced durability. The top coating is typically a thermoplastic barrier. Varieties of spoolable composite RTPs exist, such as glass fiber, carbon fiber, aramid fiber, and tape-reinforced plastic pipes. Manufactured from PE and PEX, these pipes provide reliable solutions in various industries. Fluid dynamics, pipe installation, and pipeline networks in civil engineering benefit from the flexibility and ease of installation offered by spoolable pipes.
Trenchless technology, including directional drilling, is facilitated by these pipes, reducing the need for extensive excavation. Additionally, pipe rehabilitation and pipe bursting are enhanced by their robust nature. Pipe fittings, including electrofusion welding and solvent welding, can be easily integrated, while non-destructive testing ensures pipeline integrity. Thermal insulation and pipe insulation maintain optimal temperatures, and pressure testing ensures safety. Pipe inspection and leak detection are facilitated by these pipes, ensuring minimal downtime. Ball valves, check valves, and globe valves are seamlessly integrated, providing efficient control. Pressure drop and pipe bends are effectively managed, ensuring optimal flow rate in industrial pipelines, chemical pipelines, oil pipelines, and pipeline networks.
Material science continues to advance, enhancing the properties of these pipes.
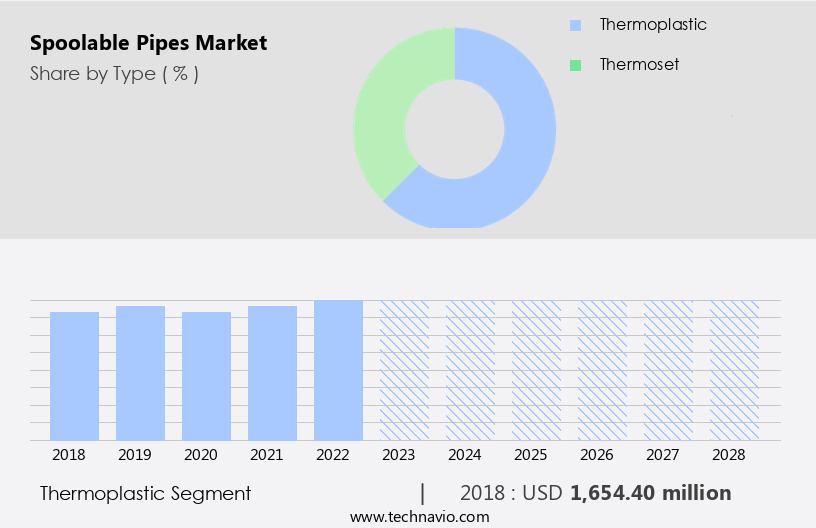
The Thermoplastic segment was valued at USD 1654.40 million in 2018 and showed a gradual increase during the forecast period.
Regional Analysis
North America is estimated to contribute 40% to the growth of the global market during the forecast period.Technavio’s analysts have elaborately explained the regional trends and drivers that shape the market during the forecast period.

The midstream sector in North America's oil and gas industry is experiencing notable growth, primarily driven by the expansion of shale oil resources in the region. This upstream sector growth is catalyzing investments in various infrastructure areas, including oil and gas storage facilities, gathering and processing facilities, export terminals, and pipelines. New investments span oil and gas pipelines, refineries, and oil product pipelines, as well as surface and lease equipment. The US is expected to account for a significant portion of these investments, with an estimated capital expenditure of approximately USD790-USD800 million between 2018 and 2035. Advancements in civil engineering techniques, such as trenchless technology and directional drilling, facilitate efficient pipe installation and minimize environmental impact.
High-pressure pipes, including steel, PVC, and reinforced pipes, are increasingly being used for gas pipelines to ensure optimal flow rate and pressure drop. Corrosion resistance is a crucial factor in pipe selection, leading to the widespread use of epoxy coatings, polyurethane coatings, and pipe lining. Pipeline networks require regular maintenance and inspection to ensure their integrity. Non-destructive testing (NDT) techniques, such as ultrasonic testing and X-ray inspection, are essential for detecting leaks and pipe damage. Hydrostatic testing and pneumatic testing are used to ensure pipeline pressure resistance and prevent potential bursts. Flexible pipes, such as fiber-reinforced polymer pipes, are gaining popularity due to their flexibility and resistance to external forces.
Industrial pipelines, including chemical and oil pipelines, require specialized materials and welding techniques, such as electrofusion welding and butt fusion welding, for their construction. Pipeline management systems and pipeline integrity management are crucial for maintaining pipeline performance and safety. Material science plays a significant role in developing new pipe materials and coatings to enhance pipeline durability and efficiency. Pipeline pigging, a process used to clean and maintain pipelines, is essential for maintaining optimal flow rates and preventing pipe corrosion. Ball valves, check valves, and globe valves are commonly used for pipeline control and regulation. In conclusion, the North American oil and gas industry's midstream sector is undergoing significant growth, driven by the development of shale oil resources.
Innovations in pipe materials, installation techniques, and pipeline management systems are essential for ensuring pipeline efficiency, safety, and longevity.
Market Dynamics
Our researchers analyzed the data with 2023 as the base year, along with the key drivers, trends, and challenges. A holistic analysis of drivers will help companies refine their marketing strategies to gain a competitive advantage.
What are the key market drivers leading to the rise in the adoption of Spoolable Pipes Industry?
- The primary advantage of spoolable pipes over traditional metallic pipes is the key market driver, as spoolable pipes offer benefits such as easier installation, reduced project costs, and increased efficiency in construction.
- Spoolable pipes, including composite pipes and Reels of Tape Pipes (RTPs), have gained significant traction in various industries such as oil and gas, irrigation, sewage, and water supply. In the oil and gas sector, these pipes are becoming increasingly preferred over traditional metallic pipes due to their numerous advantages. One of the primary reasons for this shift is their superior corrosion resistance, which is a significant issue with metallic pipes like iron and steel. Additionally, spoolable pipes are lighter in weight, resulting in reduced transportation and installation costs.
- Furthermore, these pipes exhibit enhanced fatigue resistance, making them an economical alternative to welded steel line pipes, which can save up to 30%-70% on installation and maintenance costs. Overall, the adoption of spoolable pipes is driven by their ability to offer improved performance, durability, and cost savings compared to conventional metallic pipes.
What are the market trends shaping the Spoolable Pipes Industry?
- Ultra-deep drilling activities are experiencing a significant increase and are becoming the latest market trend in the oil and gas industry. This upward trend is driven by advancements in technology and the potential for discovering substantial resources at greater depths.
- The oil and gas industry continues to explore and develop ultra-deep-water fields, pushing pipeline technology to new depths. Spanning from 3,000 to 5,000 feet below the surface, these fields require advanced technologies and equipment for pipe installation. In response, the industry is upgrading pipeline systems, including production flowlines, injection lines, and transportation pipelines. Spoolable thermoplastic pipes, both onshore and offshore, play a crucial role in this evolution. These pipes offer advantages such as high burst pressure, flexibility, and ease of installation using trenchless technology. Additionally, they can be insulated with acoustic materials, ensuring efficient performance in extreme conditions. High-pressure pipes, including steel and PVC varieties, are also enhanced with pipe coating for durability and protection during hydrostatic testing.
- Directional drilling and civil engineering techniques further facilitate pipe installation in challenging terrains. Overall, the oil and gas industry's focus on deep-sea drilling necessitates continuous advancements in pipeline technology, with spoolable thermoplastic pipes being a significant contributor to this progress.
What challenges does the Spoolable Pipes Industry face during its growth?
- The fragility of spoolable pipes poses a significant challenge to the industry's growth, necessitating continuous research and innovation to enhance their durability and reliability.
- Spoolable pipes, consisting of composite and reinforced thermoplastic varieties, are susceptible to failure due to installation-related issues and two primary damaging factors: pipe abrasion and pipe impact. Pipe abrasion arises from the presence of sharp objects, such as rocks and rough soil, which come into contact with the pipes and cause wear and tear. Conversely, pipe impact results from the collision of heavy objects, like large rocks, onto the pipes during backfilling. To mitigate these risks, protective coatings, corrosion inhibitors, and pipe fittings are employed. Protective coatings, such as polyurethane, shield pipes from external damage.
- Corrosion inhibitors prevent internal damage caused by chemical reactions. Pipe fittings ensure a secure connection between pipe sections and enhance the overall pipe system's structural integrity. Advancements in technologies like electrofusion welding, pneumatic testing, and fluid dynamics have improved the manufacturing and installation processes, reducing the likelihood of installation-related deficiencies. Additionally, pipeline management systems, including gate valves and mechanical engineering, facilitate efficient pipeline operation and maintenance. Fiber-reinforced polymer pipes and high-density polyethylene (HDPE) pipes have gained popularity due to their durability and resistance to external factors, making them suitable alternatives to traditional steel pipes.
- Industrial pipelines, including water pipelines and pipe rehabilitation projects, increasingly utilize these advanced materials and technologies to minimize the risks of pipe failure.
Exclusive Customer Landscape
The spoolable pipes market forecasting report includes the adoption lifecycle of the market, covering from the innovator’s stage to the laggard’s stage. It focuses on adoption rates in different regions based on penetration. Furthermore, the spoolable pipes market report also includes key purchase criteria and drivers of price sensitivity to help companies evaluate and develop their market growth analysis strategies.

Customer Landscape
Key Companies & Market Insights
Companies are implementing various strategies, such as strategic alliances, spoolable pipes market forecast, partnerships, mergers and acquisitions, geographical expansion, and product/service launches, to enhance their presence in the industry.
Baker Hughes Co. - The company specializes in manufacturing and supplying Cosmoplast PPR pipes and fittings, available in sizes from 20mm to 160mm, delivering reliable and efficient solutions for various industries. These products ensure durability, resistance to chemicals, and ease of installation. The company's commitment to quality and innovation sets it apart in the market.
The industry research and growth report includes detailed analyses of the competitive landscape of the market and information about key companies, including:
- Baker Hughes Co.
- Changchun Gaoxiang Special Pipe Co. Ltd.
- Cosmoplast Ind. Co. LLC
- Flexpipe Modular Material Handing System
- FlexSteel Pipeline Technologies Inc.
- Future Pipe Industries
- Hebei Heng An Tai Pipeline Co. Ltd.
- NOV Inc.
- Mattr Corp.
- Smartpipe Technologies
- Strohm B.V.
- TechnipFMC plc
- Victrex Plc
- Wienerberger AG
Qualitative and quantitative analysis of companies has been conducted to help clients understand the wider business environment as well as the strengths and weaknesses of key industry players. Data is qualitatively analyzed to categorize companies as pure play, category-focused, industry-focused, and diversified; it is quantitatively analyzed to categorize companies as dominant, leading, strong, tentative, and weak.
Recent Development and News in Spoolable Pipes Market
- In January 2024, Nextep, a leading spoolable pipes manufacturer, announced the launch of its new XtraFlex product line, featuring enhanced durability and flexibility for oil and gas applications. This development was aimed at catering to the increasing demand for efficient and cost-effective piping solutions in the energy sector (Nextep Press Release, 2024).
- In March 2024, Saipem, a major player in engineering and construction, entered into a strategic partnership with Spooltech, a spoolable pipes specialist, to expand its offerings in the oil and gas market. This collaboration aimed to leverage Spooltech's expertise in manufacturing and Saipem's strengths in engineering and project execution (Saipem Press Release, 2024).
- In May 2024, Tenaris, a global steel tubes and related services company, completed the acquisition of Pipelife, a European pipe manufacturer specializing in spoolable pipes. This strategic move aimed to strengthen Tenaris' presence in the European market and expand its product portfolio (Tenaris Press Release, 2024).
- In February 2025, the U.S. Department of Energy granted a USD5 million grant to a consortium led by Tuboscope, a spoolable pipes provider, to develop advanced materials for spoolable pipes, aiming to enhance their performance and reduce their environmental impact (U.S. Department of Energy Press Release, 2025).
Research Analyst Overview
- The market encompasses various pipeline manufacturing processes, including centrifugal casting and pipe laying barges, which facilitate efficient production. Pipeline design standards, such as API and ASME, ensure safety and integrity. UV curing and pipe threading machines expedite manufacturing, while pipe bending machines and pipe cutting machines enable customization. Pipeline construction equipment, like pipe laying barges and pipe laying equipment, are essential for installation. Pipeline safety regulations mandate the use of leak detection sensors, corrosion monitoring systems, and emergency pipeline repair kits. Environmental regulations necessitate the adoption of eco-friendly pipe materials, such as epoxy resins, in pipeline design.
- Pipeline integrity assessment and fatigue analysis are crucial for maintaining pipeline safety and longevity. Remote monitoring, SCADA systems, and pipeline stress analysis enable real-time tracking and proactive maintenance. Pipe rehabilitation technologies, including pipe support systems and pipe repair kits, extend pipeline life. Pipeline security and pipeline safety regulations require the implementation of advanced welding equipment and pipe threading machines to ensure secure connections. Spiral wound pipes and pipe manufacturing processes cater to the growing demand for lightweight and durable piping solutions. Pipe laying barges and pipe bending machines facilitate the installation of pipe rehabilitation technologies, ensuring minimal disruption to operations.
- UV curing and pipe stress analysis contribute to the overall efficiency and effectiveness of pipeline construction projects.
Dive into Technavio’s robust research methodology, blending expert interviews, extensive data synthesis, and validated models for unparalleled Spoolable Pipes Market insights. See full methodology.
|
Market Scope |
|
|
Report Coverage |
Details |
|
Page number |
172 |
|
Base year |
2023 |
|
Historic period |
2018-2022 |
|
Forecast period |
2024-2028 |
|
Growth momentum & CAGR |
Accelerate at a CAGR of 5.2% |
|
Market growth 2024-2028 |
USD 616.8 million |
|
Market structure |
Concentrated |
|
YoY growth 2023-2024(%) |
4.8 |
|
Key countries |
US, Germany, UK, Canada, China, Japan, France, India, Spain, and South Korea |
|
Competitive landscape |
Leading Companies, Market Positioning of Companies, Competitive Strategies, and Industry Risks |
What are the Key Data Covered in this Spoolable Pipes Market Research and Growth Report?
- CAGR of the Spoolable Pipes industry during the forecast period
- Detailed information on factors that will drive the growth and forecasting between 2024 and 2028
- Precise estimation of the size of the market and its contribution of the industry in focus to the parent market
- Accurate predictions about upcoming growth and trends and changes in consumer behaviour
- Growth of the market across North America, APAC, Europe, Middle East and Africa, and South America
- Thorough analysis of the market’s competitive landscape and detailed information about companies
- Comprehensive analysis of factors that will challenge the spoolable pipes market growth of industry companies
We can help! Our analysts can customize this spoolable pipes market research report to meet your requirements.
 RIA -
RIA - 
