
Flexible Pipes Market Size 2025-2029
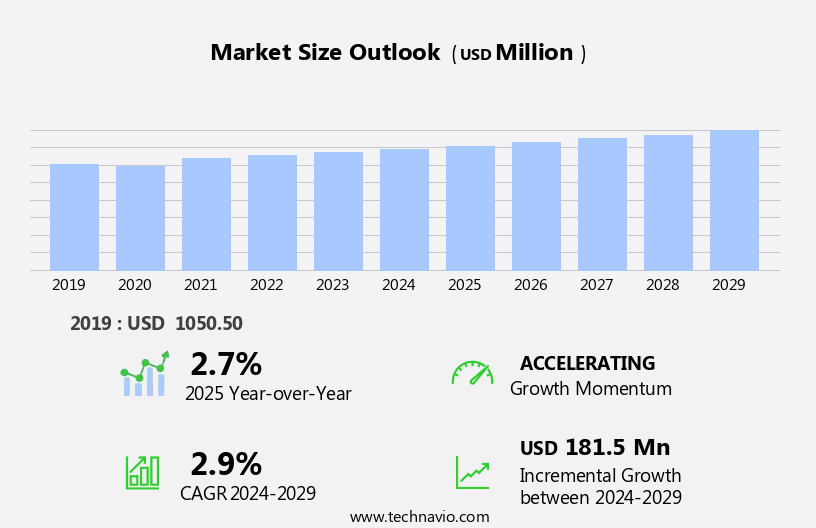
The flexible pipes market size is forecast to increase by USD 181.5 million at a CAGR of 2.9% between 2024 and 2029.
- The market is experiencing significant growth, driven primarily by the increasing investment in upstream oil and gas activities worldwide. This trend is particularly noticeable in regions with complex geological structures and harsh environmental conditions, where traditional rigid pipes face challenges in transportation and installation. Another key trend in the market is the growing adoption of carbon composite materials in the production of flexible pipes, which offers enhanced strength and durability. However, the high initial cost associated with the manufacturing and installation of these pipes remains a significant challenge for market growth. Companies seeking to capitalize on this market opportunity must focus on optimizing production costs and improving the technological capabilities of their flexible pipe solutions to meet the evolving demands of the oil and gas industry. The mechanization of agriculture and the expansion of the agriculture machinery market are driving the demand for hydraulic hoses and fittings.
- Additionally, collaborations and partnerships with key stakeholders, including oil and gas companies and pipe manufacturers, can help companies navigate the competitive landscape and stay ahead of emerging trends. Overall, the market presents significant growth potential for companies able to effectively address the challenges of cost and technological innovation while meeting the evolving demands of the oil and gas industry. Hydraulic hoses and fittings are manufactured from rubber and thermoplastic materials, ensuring durability and resistance to weather, abrasion, oil, and chemicals.
What will be the Size of the Flexible Pipes Market during the forecast period?
- Flexible pipe components play a crucial role in the efficient transportation of various fluids in industries such as oil and gas, water, and chemicals. Hose assembly standards and innovation are driving the market forward, with technology advancements enabling improved performance and safety. Regulations, such as those governing hose assembly replacement, traceability, and certification, ensure compliance and consumer confidence. Flexible pipe systems offer numerous opportunities, including enhanced flexibility, durability, and cost savings. However, challenges persist, including maintenance requirements, design complexities, and installation and testing safety concerns. Hose assembly fabrication and repair solutions are essential to mitigate these challenges and ensure optimal system functionality. These components are integral to the transfer of hydraulic fluid under high-pressure conditions, enabling the operation of machinery in industries such as heavy construction, material handling, aerospace, automotive, agricultural, mining, and coal mining.
- Hose assembly technology continues to evolve, with a focus on design innovation, installation techniques, and safety enhancements. Regulations and industry best practices guide these advancements, ensuring that flexible pipe components meet the highest standards for performance and reliability. By staying informed of these trends and addressing the unique challenges of hose assembly, businesses can optimize their operations and maintain a competitive edge.
How is this Flexible Pipes Industry segmented?
The flexible pipes industry research report provides comprehensive data (region-wise segment analysis), with forecasts and estimates in "USD million" for the period 2025-2029, as well as historical data from 2019-2023 for the following segments.
- Product Type
- HDPE
- PA
- PVDF
- Others
- Type
- Single wall
- Multi wall
- Double wall
- End-user
- Oil and gas
- Chemical and petrochemicals
- Water treatment plants
- Mining
- Others
- Geography
- North America
- US
- Europe
- Norway
- Russia
- UK
- Middle East and Africa
- UAE
- APAC
- China
- India
- Japan
- South America
- Brazil
- Rest of World (ROW)
- North America
By Product Type Insights
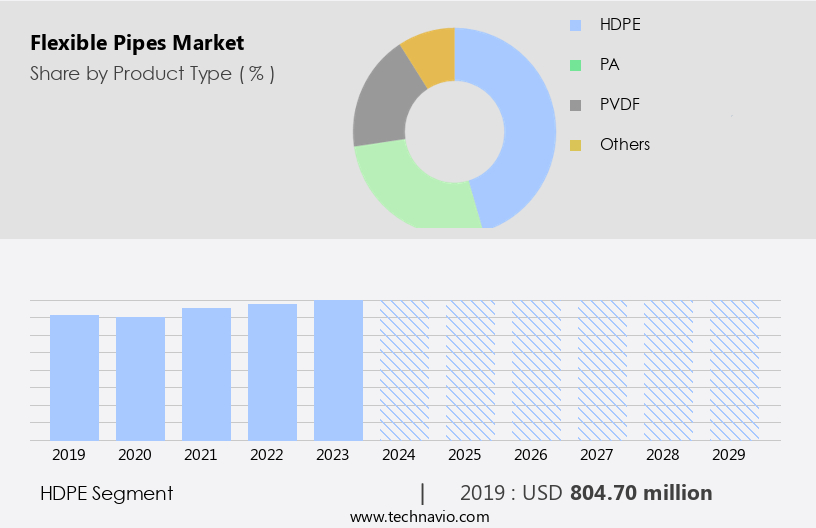
The HDPE segment is estimated to witness significant growth during the forecast period. The market for industrial hoses, including flexible connectors, pipe fittings, pneumatic hoses, and reinforced hoses, is experiencing significant growth due to increasing demands for fluid transfer in various industries. Hose manufacturing companies are focusing on producing high-performance hoses that offer superior chemical compatibility, flow rate, and hose life cycle. Materials such as stainless steel, thermoplastic, and advanced composites are utilized to create hoses that meet the stringent requirements of industries like oil and gas, food and beverage, and chemical processing. Safety and maintenance are crucial considerations in the hose market. Hose safety features, such as pressure rating, hose end fittings, and hose clamps, are essential to prevent hose failure and ensure efficient operation. The market encompasses hydraulic hoses and fittings, essential components for various types of machinery used in construction projects, such as excavators, compactors, concrete and cement machines, drilling rigs, and wheel loaders.
Hose maintenance practices, including hose inspection, hose testing, and hose repair, are also gaining importance to minimize downtime and extend hose life. Hose trends include the development of custom hose assemblies, engineered hose solutions, and hose technology innovations like hose crimping, hose performance optimization, and hose traceability. These advancements aim to address the unique needs of various applications, such as heavy-duty applications, high-pressure hoses, and hydraulic hoses. Regulations and certifications, such as hose regulations and hose certification, are essential to ensure hose safety and quality. Companies are investing in research and development to meet these standards and offer hose solutions that comply with industry requirements. The construction sector's expansion is influenced by factors like low interest rates, a favorable global economic climate, and institutional investors' increased direct real estate investments.
In the realm of hose technology, there is a growing emphasis on process automation, temperature resistance, and abrasive resistance. Hose reels, burst pressure, and spiral hoses are some of the other essential components in the hose market. In summary, the industrial hose market is witnessing continuous growth due to the increasing demand for fluid transfer and the development of advanced hose solutions that cater to various industries' unique requirements. Companies are focusing on innovation, sustainability, and safety to meet the evolving needs of the market.
Get a glance at the market report of share of various segments Request Free Sample
The HDPE segment was valued at USD 804.70 million in 2019 and showed a gradual increase during the forecast period.
Regional Analysis
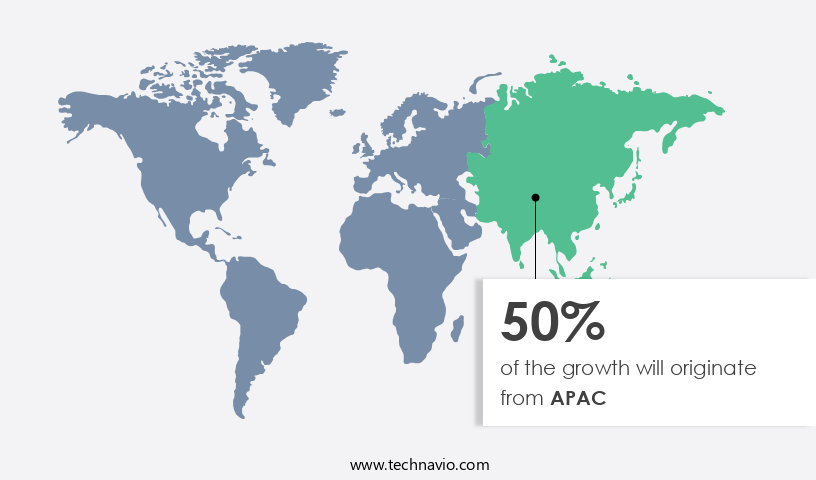
APAC is estimated to contribute 50% to the growth of the global market during the forecast period. Technavio's analysts have elaborately explained the regional trends and drivers that shape the market during the forecast period.
For more insights on the market size of various regions, Request Free Sample
The global market for industrial hoses, including flexible connectors, pipe fittings, pneumatic hoses, and reinforced hoses, among others, experiences significant growth due to the increasing demand for fluid transfer in various industries. In the oil and gas sector, the rising energy consumption in Asia Pacific (APAC) countries, such as China and India, fuels the demand for high-performance hoses, pressure hoses, and stainless steel hoses. According to the International Energy Agency (IEA), the APAC region's oil demand reached 104.7 million barrels per day (mbpd) in 2024, a notable increase from 102.21 mbpd in 2023. India's crude oil demand grew by 4.6% in 2023 compared to the previous year, while China's crude oil demand saw a 10% increase during the same period.
These trends necessitate the use of advanced materials, such as composite hoses and thermoplastic hoses, for improved abrasive resistance, temperature resistance, and pressure rating. Additionally, the need for hose safety, hose maintenance, and hose certification is increasingly important in industries handling hazardous fluids, such as chemical processing. Hose manufacturing companies focus on innovation, hose performance optimization, and hose technology to cater to the evolving market needs. Engineered hose solutions, hose design, and hose installation services are becoming increasingly popular to ensure proper hose routing and minimize hose failure. Furthermore, the demand for hose assemblies, including hydraulic hoses and custom hose assemblies, is on the rise due to their ability to improve process automation and reduce hose cost.
The market for hoses is diverse, encompassing various applications, such as material handling, fluid transfer, and industrial processes. The demand for hoses in industries like oil and gas, food and beverage, and chemical processing is expected to remain strong, driving the growth of the overall market. Hose trends include the development of multi-layer hoses, spiral hoses, and hose reels for improved hose life cycle and hose safety. Hose clamps, hose end fittings, and hose regulations play crucial roles in ensuring hose performance and safety. The market for industrial hoses is witnessing substantial growth due to the increasing demand for fluid transfer in various industries, particularly in the oil and gas sector. For instance, India's infrastructure spending is on the rise, leading to a growing demand for construction equipment, including hydraulic hoses and fittings. In the context of sustainability, green infrastructure projects, such as solar and wind energy, also contribute to the market's growth. Companies specializing in hose manufacturing, hose design, and hose installation services are focusing on innovation and performance optimization to cater to the evolving market needs. The demand for advanced materials, such as composite hoses and thermoplastic hoses, is on the rise, and the market is expected to remain diverse and dynamic.
Market Dynamics
Our researchers analyzed the data with 2024 as the base year, along with the key drivers, trends, and challenges. A holistic analysis of drivers will help companies refine their marketing strategies to gain a competitive advantage.
What are the key market drivers leading to the rise in the adoption of Flexible Pipes Industry?
- Rising investment in upstream oil and gas activity is the key driver of the market. The market is experiencing notable expansion due to escalating investments in upstream oil and gas projects. Flexible pipes serve a vital role in the oil and gas sector, facilitating the transportation of fluids and gases under extreme pressure and challenging environmental circumstances. The growing energy demand and the quest for efficient and cost-effective extraction methods have fueled a substantial increase in upstream investments. By 2024, global upstream oil and gas investments are anticipated to reach USD570 billion, marking a 7% growth from 2023. This expansion is primarily attributed to the heightened spending from Middle Eastern and Asian National Oil Companies, who have significantly boosted their oil and gas investments since 2017. Infrastructure projects, including buildings and renewable energy installations like solar and wind projects, contribute significantly to the market's growth.
What are the market trends shaping the Flexible Pipes Industry?
- Increased use of carbon composite to increase strength is the upcoming market trend. Flexible composite pipes have gained significant traction in the oil and gas industry due to their suitability for shallow and long horizontal wells. These pipes are advantageous as they can be easily retracted from such wells, which is a critical factor in the current industry landscape. The oil and gas sector is witnessing a shift towards directional drilling, with horizontal drilling growing at a faster pace than vertical drilling. The increased production rate of horizontal wells, which is more than double that of vertical wells, presents a lucrative growth opportunity for the market. Moreover, the harsh subsea environment necessitates the use of high-strength and effective flexible pipes that can ensure continuous operation. The demand for such pipes is increasing as oil and gas companies prioritize reliability and efficiency in their operations. The increasing number of horizontal wells is a significant factor driving the market growth. Hydraulic hoses and fittings must meet various performance standards, including temperature resistance, pressure ratings, and compatibility with various hydraulic fluids.
What challenges does the Flexible Pipes Industry face during its growth?
- High initial cost associated with flexible pipes is a key challenge affecting the industry growth. Flexible pipes are a vital solution in industries such as offshore oil and gas exploration, water management, and chemical processing due to their durability and adaptability in challenging environments. However, the high initial cost is a significant barrier to their adoption, particularly in price-sensitive industries like agriculture and small-scale ranching. For instance, flexible PVC pipes from companies like TechnipFMC plc range from USD 1.50 to USD 5.00 per foot, while HDPE pipes, favored for their strength and resistance to corrosion, cost between USD 2.00 and USD 3.00 per foot. This upfront investment can be prohibitive for some companies. Despite the challenge, flexible pipes offer numerous benefits, including reduced installation costs, improved flexibility, and enhanced safety. As research continues to explore the potential of these advanced piping solutions, it is essential for businesses to weigh the benefits against the initial investment to determine if flexible pipes are the right choice for their specific needs.
Exclusive Customer Landscape
The flexible pipes market forecasting report includes the adoption lifecycle of the market, covering from the innovator's stage to the laggard's stage. It focuses on adoption rates in different regions based on penetration. Furthermore, the flexible pipes market report also includes key purchase criteria and drivers of price sensitivity to help companies evaluate and develop their market growth analysis strategies.

Customer Landscape
Key Companies & Market Insights
Companies are implementing various strategies, such as strategic alliances, flexible pipes market forecast, partnerships, mergers and acquisitions, geographical expansion, and product/service launches, to enhance their presence in the industry.
Baker Hughes Co. - The company offers flexible pipes such as risers, jumpers, flowlines, and fluid transfer lines designed for reliable, robust production solutions in subsea environments.
The industry research and growth report includes detailed analyses of the competitive landscape of the market and information about key companies, including:
- BRUGG GROUP AG
- Changchun Gaoxiang Special Pipe Co. Ltd.
- Continental AG
- FlexSteel Pipeline Technologies Inc.
- Future Pipe Industries
- MAGMA GLOBAL Ltd.
- Mattr Corp.
- NOV Inc.
- Prysmian SpA
- Saudi Arabian Amiantit Co.
- SoluForce B.V.
- Strohm B.V.
- TechnipFMC plc
- Tianjin Pipe International Economic and Trading Corp.
Qualitative and quantitative analysis of companies has been conducted to help clients understand the wider business environment as well as the strengths and weaknesses of key industry players. Data is qualitatively analyzed to categorize companies as pure play, category-focused, industry-focused, and diversified; it is quantitatively analyzed to categorize companies as dominant, leading, strong, tentative, and weak.
Research Analyst Overview
Flexible pipes and their associated components, including flexible connectors, pipe fittings, pneumatic hoses, and multi-layer hoses, play a crucial role in various industries by facilitating fluid transfer and material handling. These solutions offer versatility and adaptability, making them essential for applications where rigidity is not a requirement. Manufacturers of flexible piping continuously innovate to meet the evolving demands of industries such as food and beverage, chemical processing, oil and gas, and material handling. Reinforced hoses, composite hoses, and high-performance hoses are among the offerings that cater to the diverse requirements of these sectors. Hose inspection, maintenance, and safety are essential aspects of the flexible pipe market. Rubber and steel are the primary raw materials used in manufacturing these components, making the market susceptible to price fluctuations.
Hose life cycle management, hose testing, and hose replacement are integral parts of ensuring hose performance optimization and minimizing downtime. Hose regulations and certification are also crucial to maintaining safety and compliance in various industries. Hose design and installation considerations include factors such as flow rate, working pressure, temperature resistance, and abrasive resistance. Custom hose assemblies cater to specific application needs, while hose clamps and hose end fittings ensure secure connections. The flexible pipe market is characterized by continuous innovation, with advancements in materials, hose design, and hose technology driving growth. High-pressure hoses, spiral hoses, and engineered hose solutions are some of the recent developments in this space.
Process automation and the integration of hose technology into industrial applications are key trends in the flexible pipe market. The use of advanced materials and hose crimping technology contributes to improved hose performance and cost reduction. Flexible pipes and their components undergo rigorous testing to ensure compliance with industry standards and to analyze hose failure. Hose traceability and hose assemblies are essential for maintaining accountability and ensuring the integrity of fluid transfer systems. In the realm of fluid transfer, flexible piping solutions offer adaptability, reliability, and efficiency. From hydraulic hoses and chemical handling applications to oil and gas and water treatment, the flexible pipe market continues to evolve to meet the unique demands of various industries.
StartFragment lexible Pipes Market s hose assembly design and hose assembly testing for reliability. Hose assembly installation and hose assembly maintenance ensure performance. Hose assembly repair addresses issues, while hose assembly regulations uphold standards. Hose assembly safety and hose assembly certification guarantee trustworthiness. Hose assembly traceability ensures accountability, while hose assembly innovation drives advancements. Flexible pipe challenges include operational durability, while flexible pipe opportunities explore new applications. The Flexible Pipes Market thrives on addressing hose assembly design, hose assembly testing, hose assembly installation, hose assembly maintenance, and hose assembly repair comprehensively. Hose assembly regulations and hose assembly safety ensure compliance, while hose assembly traceability and hose assembly certification uphold reliability. Flexible pipe challenges and flexible pipe opportunities shape market growth.EndFragment
|
Market Scope |
|
|
Report Coverage |
Details |
|
Page number |
233 |
|
Base year |
2024 |
|
Historic period |
2019-2023 |
|
Forecast period |
2025-2029 |
|
Growth momentum & CAGR |
Accelerate at a CAGR of 2.9% |
|
Market growth 2025-2029 |
USD 181.5 million |
|
Market structure |
Fragmented |
|
YoY growth 2024-2025(%) |
2.7 |
|
Key countries |
China, US, Saudi Arabia, UAE, India, UK, Japan, Brazil, Norway, and Russia |
|
Competitive landscape |
Leading Companies, Market Positioning of Companies, Competitive Strategies, and Industry Risks |
What are the Key Data Covered in this Flexible Pipes Market Research and Growth Report?
- CAGR of the Flexible Pipes industry during the forecast period
- Detailed information on factors that will drive the growth and forecasting between 2025 and 2029
- Precise estimation of the size of the market and its contribution of the industry in focus to the parent market
- Accurate predictions about upcoming growth and trends and changes in consumer behaviour
- Growth of the market across APAC, Middle East and Africa, North America, Europe, and South America
- Thorough analysis of the market's competitive landscape and detailed information about companies
- Comprehensive analysis of factors that will challenge the flexible pipes market growth and forecasting
We can help! Our analysts can customize this flexible pipes market research report to meet your requirements.
 RIA -
RIA - 
