
Sports Analytics Market Size 2026-2030
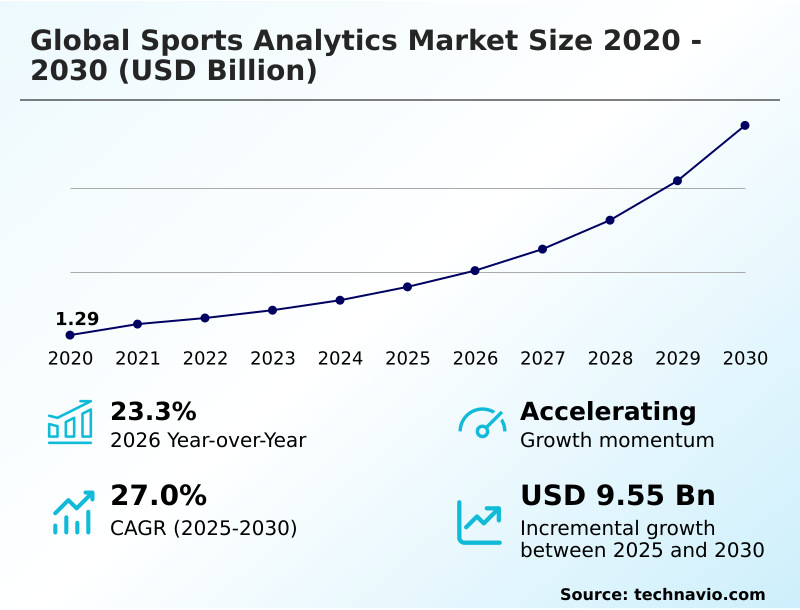
The sports analytics market size is valued to increase by USD 9.55 billion, at a CAGR of 27% from 2025 to 2030. Increasing investment in smart stadiums will drive the sports analytics market.
Major Market Trends & Insights
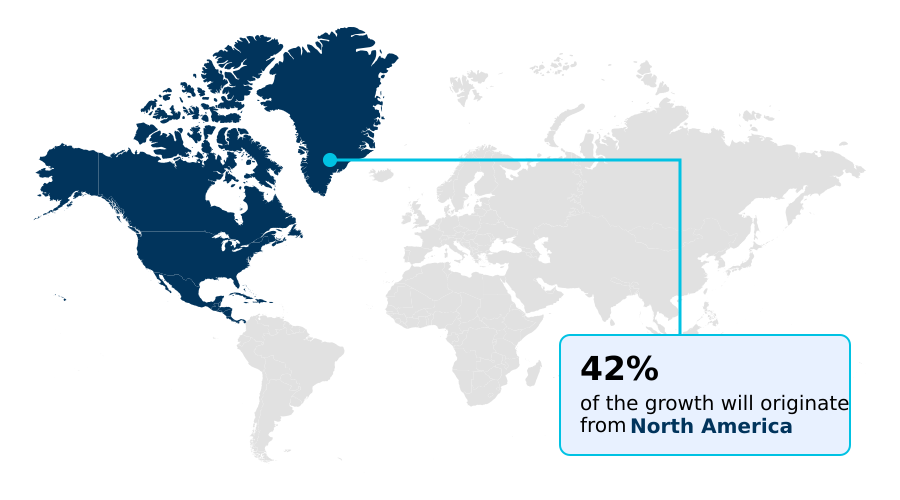
- North America dominated the market and accounted for a 42.2% growth during the forecast period.
- By Type - Football segment was valued at USD 1.47 billion in 2024
- By Solution - Player analysis segment accounted for the largest market revenue share in 2024
Market Size & Forecast
- Market Opportunities: USD 12.40 billion
- Market Future Opportunities: USD 9.55 billion
- CAGR from 2025 to 2030 : 27%
Market Summary
- The sports analytics market is defined by the systematic application of advanced software and data science to enhance athletic performance and optimize business functions. This involves collecting extensive data from sources like wearable sensors and high-speed cameras, which is then processed to generate actionable intelligence.
- Core trends include the adoption of computer vision technology for precise match analysis and real-time integration of wearable sensor data for immediate physiological insights. Key drivers are the increasing investment in smart stadium infrastructure, the critical need for player safety and injury reduction, and the global expansion of sports betting.
- For example, a professional team can implement predictive analytics models using biometric markers to forecast potential injuries, allowing for proactive interventions that preserve player health and protect financial investments in talent. However, the industry faces challenges such as ensuring data privacy, integrating complex multi-source data streams, and overcoming the financial constraints faced by smaller organizations.
- The market's evolution is geared toward creating a holistic data ecosystem that informs everything from on-field strategy to fan engagement.
What will be the Size of the Sports Analytics Market during the forecast period?
Get Key Insights on Market Forecast (PDF) Get Free Sample
How is the Sports Analytics Market Segmented?
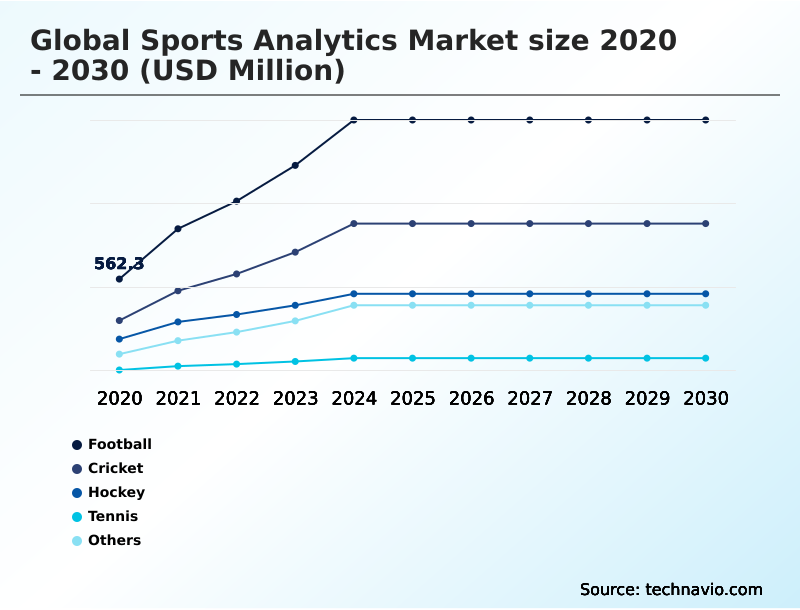
The sports analytics industry research report provides comprehensive data (region-wise segment analysis), with forecasts and estimates in "USD million" for the period 2026-2030, as well as historical data from 2020-2024 for the following segments.
- Type
- Football
- Cricket
- Hockey
- Tennis
- Others
- Solution
- Player analysis
- Team performance analysis
- Health assessment
- Fan engagement analysis
- Others
- Component
- Software
- Services
- Geography
- North America
- US
- Canada
- Mexico
- APAC
- China
- Japan
- India
- Europe
- UK
- Germany
- Spain
- South America
- Brazil
- Argentina
- Middle East and Africa
- UAE
- Saudi Arabia
- South Africa
- Rest of World (ROW)
- North America
By Type Insights
The football segment is estimated to witness significant growth during the forecast period.
The football segment leads the sports analytics market, driven by the global scale of the sport and its advanced adoption of data-driven recruitment strategies.
Teams leverage sophisticated biomechanical analysis tools to evaluate prospects and utilize kinematic data analysis to refine on-field tactics. Integrating biometric markers monitoring with high-frequency betting analytics provides a dual-purpose data stream for performance and commercial operations.
This approach includes impact sensing technology to manage player health, as effective player management through physiological data streaming has been shown to reduce non-contact injuries by up to 30%.
The use of high-density wireless networks in stadiums further supports real-time data integrity verification, which is critical for both coaching decisions and crowd flow management.
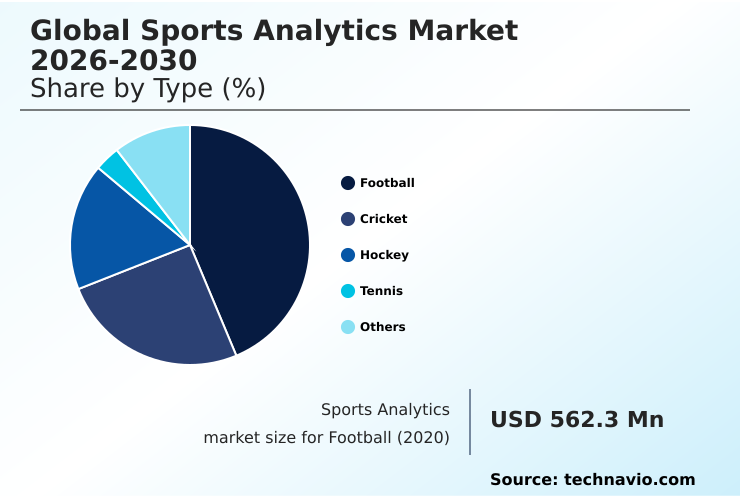
The Football segment was valued at USD 1.47 billion in 2024 and showed a gradual increase during the forecast period.
Regional Analysis
North America is estimated to contribute 42.2% to the growth of the global market during the forecast period.Technavio’s analysts have elaborately explained the regional trends and drivers that shape the market during the forecast period.
See How Sports Analytics Market Demand is Rising in North America Get Free Sample
The geographic landscape of the sports analytics market is led by North America, where a mature ecosystem built around major professional leagues drives innovation in data-driven decision making.
The region's market is projected to grow at a rate of 28.5%, outpacing Europe's 25.8% growth, which is heavily influenced by elite football. APAC is the fastest-growing region, leveraging talent identification models and widespread digital adoption.
Across these markets, performance monitoring systems are standard, with optical tracking systems used for metrics like shot arc tracking and defensive spacing metrics. Machine learning algorithms enhance everything from set piece optimization to sponsorship valuation.
The use of rfid tracking technologies for real-time player location and global positioning systems for athlete management is becoming widespread, supporting both on-field tactics and venue management optimization.
Market Dynamics
Our researchers analyzed the data with 2025 as the base year, along with the key drivers, trends, and challenges. A holistic analysis of drivers will help companies refine their marketing strategies to gain a competitive advantage.
- The sports analytics market has evolved significantly beyond basic statistics, with organizations now leveraging sophisticated player performance data analysis tools to gain a competitive edge. The implementation of real-time player tracking in basketball, for instance, allows coaches to analyze spatial data and make immediate tactical adjustments.
- A core focus is the use of wearable sensor data for injury prevention, where tracking athlete workload and biomechanics helps mitigate physical strain. This is complemented by the growing use of computer vision for tactical analysis, which automates the process of breaking down opponent strategies.
- Simultaneously, ai models for predicting game outcomes are becoming crucial for both teams and the sports betting analytics for odds setting industry. Off the field, fan engagement analytics for sports teams are essential for personalizing content and driving revenue, often using augmented reality for sports broadcasting to create immersive viewer experiences.
- The backbone of these operations relies on robust cloud platforms for sports data management, which are critical for integrating multiple data sources in sports. Organizations that successfully unify these platforms reduce data preparation time by more than half compared to those using siloed systems.
- This integration of rfid technology for asset tracking in venues, software for managing player workload, and health assessment tools in sports medicine creates a holistic operational view. As the industry matures, addressing data privacy solutions for athlete biometrics remains a paramount concern for maintaining trust and compliance.

What are the key market drivers leading to the rise in the adoption of Sports Analytics Industry?
- Substantial and growing investments in smart stadium infrastructure are a primary driver for the sports analytics market.
- Market growth is propelled by strategic investments in technology that yield measurable returns. The build-out of smart stadium infrastructure, equipped with internet of things sensors, is enabling new revenue streams from sources like targeted in-game advertising and optimized commercial operations.
- These intelligent venues have demonstrated the ability to lower energy costs by over 20%. A second major driver is the focus on player health, where predictive analytics models and injury prevention software are used to analyze early signs of fatigue.
- This proactive approach has been shown to achieve up to a 30% non-contact injury reduction, safeguarding valuable player assets and ensuring roster stability.
- Finally, the expanding legal sports betting market creates immense demand for reliable, low-latency sports betting data feeds, which are powered by cloud-based analytics platforms designed for high-volume processing and player workload management.
What are the market trends shaping the Sports Analytics Industry?
- The adoption of computer vision for match analysis represents a significant market trend. This technology enables automated, high-precision tracking of player and ball movements.
- Key market trends are redefining performance optimization and fan interaction. The adoption of computer vision technology, supported by high-resolution cameras, is enabling automated data collection and sophisticated skeletal movements analysis. This approach has reduced post-match analysis time from hours to minutes compared to manual methods.
- Concurrently, the integration of wearable sensor data provides real-time data visualization of digital health signatures through local area networks, allowing for immediate interventions based on physiological metrics. This shift toward personalized training programs helps improve athlete availability by over 15% by preventing overexertion.
- In parallel, fan engagement platforms are creating immersive second screen experiences by incorporating augmented reality overlays and using a three-dimensional coordinate system to display live player statistics, deepening spectator involvement.
What challenges does the Sports Analytics Industry face during its growth?
- Navigating data privacy regulations and ethical considerations surrounding athlete information presents a key challenge to industry growth.
- The market faces significant operational and regulatory hurdles that can impede growth. The complexity of multi-source data integration remains a primary obstacle, with data scientists spending over 60% of their time on data cleaning and preparation due to data silos. This inefficiency limits the effectiveness of ai-powered analytics and tactical analysis software.
- Achieving seamless video and wearable data integration requires interoperable systems standards, which are not yet universal. Furthermore, navigating biometric information privacy laws is critical, as non-compliance can result in fines exceeding 4% of global turnover. Organizations must invest in secure data vault solutions and unified data architectures to ensure both compliance and analytical cohesion.
- Without addressing these challenges, the full potential of player tracking systems and advanced media valuation metrics will remain unrealized.
Exclusive Technavio Analysis on Customer Landscape
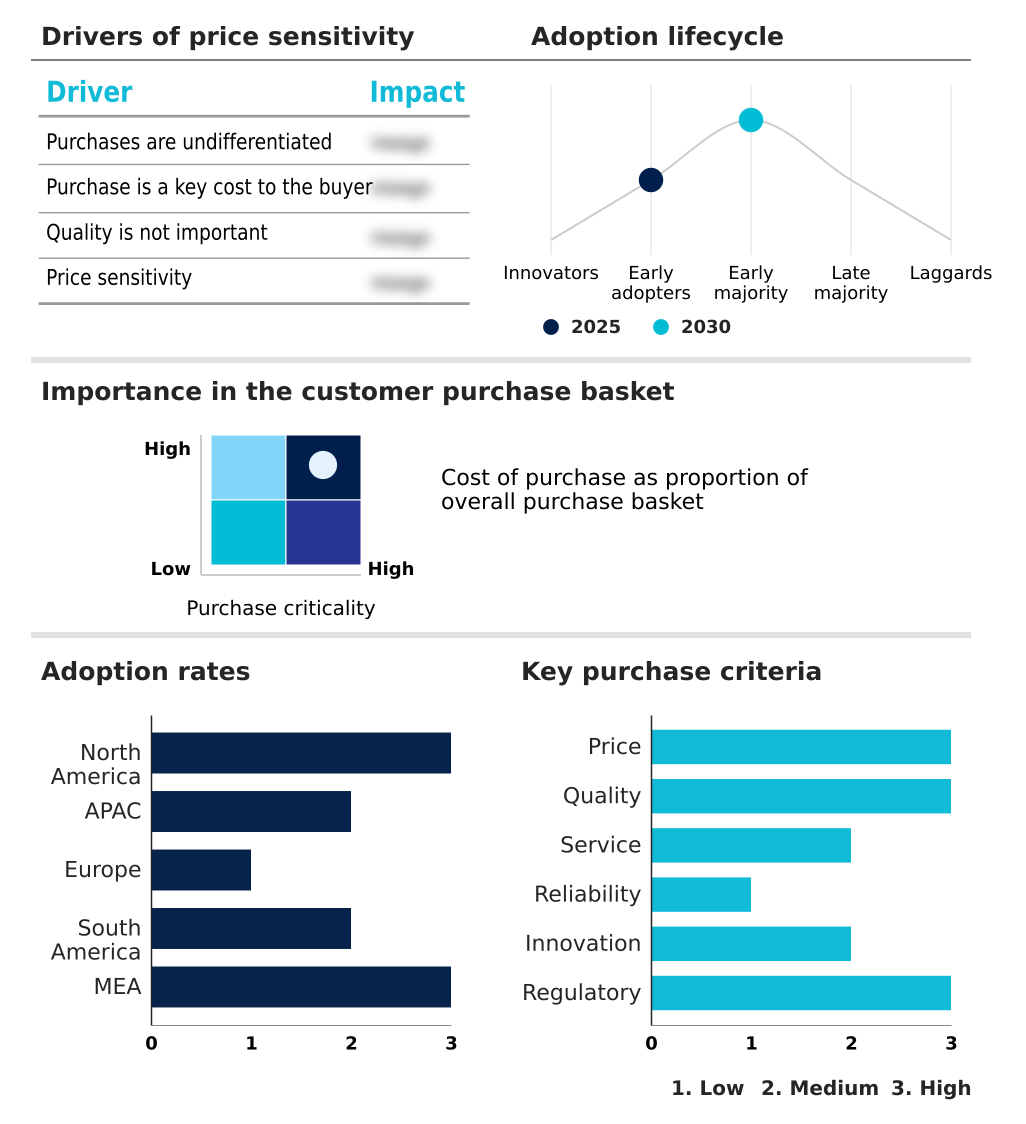
The sports analytics market forecasting report includes the adoption lifecycle of the market, covering from the innovator’s stage to the laggard’s stage. It focuses on adoption rates in different regions based on penetration. Furthermore, the sports analytics market report also includes key purchase criteria and drivers of price sensitivity to help companies evaluate and develop their market growth analysis strategies.
Customer Landscape of Sports Analytics Industry
Competitive Landscape
Companies are implementing various strategies, such as strategic alliances, sports analytics market forecast, partnerships, mergers and acquisitions, geographical expansion, and product/service launches, to enhance their presence in the industry.
Blinkfire Analytics Inc. - Offers sports analytics through real-time data visualization and player tracking systems, delivering performance analysis for broadcast and team-level applications.
The industry research and growth report includes detailed analyses of the competitive landscape of the market and information about key companies, including:
- Blinkfire Analytics Inc.
- Catapult Group
- ChyronHego Corp.
- Deltatre SpA
- ExlService Holdings Inc.
- Experfy Inc.
- IBM Corp.
- iSportsAnalysis Ltd.
- Oracle Corp.
- Qualitas Global Services B.V.
- Salesforce Inc.
- SAP SE
- SAS Institute Inc.
- Sportcor
- Sportradar Group AG
- SportsSource Analytics
- Stats Perform group of Co
- The Nielsen Co. LLC
- TruMedia Networks Inc.
- Zebra Technologies Corp.
Qualitative and quantitative analysis of companies has been conducted to help clients understand the wider business environment as well as the strengths and weaknesses of key industry players. Data is qualitatively analyzed to categorize companies as pure play, category-focused, industry-focused, and diversified; it is quantitatively analyzed to categorize companies as dominant, leading, strong, tentative, and weak.
Recent Development and News in Sports analytics market
- In August 2024, Sportradar Group AG launched an advanced live data platform for international cricket, delivering real-time insights on bowler and batter matchups to broadcasters and teams.
- In September 2024, Oracle Corp introduced a new secure data vault for sensitive athlete information, ensuring that only authorized personnel can access biometric profiles to address privacy concerns.
- In October 2024, Salesforce Inc launched a new integration hub to promote unified data architectures, enabling sports organizations to connect disparate data streams into a single dashboard.
- In January 2025, the National Basketball Association (NBA) participated in a $5 million Series A funding round for Springbok Analytics, a company specializing in AI applications for sports performance.
Dive into Technavio’s robust research methodology, blending expert interviews, extensive data synthesis, and validated models for unparalleled Sports Analytics Market insights. See full methodology.
| Market Scope | |
|---|---|
| Page number | 310 |
| Base year | 2025 |
| Historic period | 2020-2024 |
| Forecast period | 2026-2030 |
| Growth momentum & CAGR | Accelerate at a CAGR of 27% |
| Market growth 2026-2030 | USD 9546.9 million |
| Market structure | Fragmented |
| YoY growth 2025-2026(%) | 23.3% |
| Key countries | US, Canada, Mexico, China, Japan, India, South Korea, Australia, Indonesia, UK, Germany, Spain, France, Italy, The Netherlands, Brazil, Argentina, Chile, UAE, Saudi Arabia, South Africa, Egypt and Israel |
| Competitive landscape | Leading Companies, Market Positioning of Companies, Competitive Strategies, and Industry Risks |
Research Analyst Overview
- The sports analytics market is advancing from descriptive statistics to integrated, predictive frameworks that drive high-stakes decisions. The use of ai-powered analytics and sophisticated machine learning algorithms is now standard for applications ranging from tactical analysis software to data-driven recruitment.
- Boardroom conversations are increasingly focused on leveraging performance monitoring systems and wearable sensor data to mitigate financial risk; the ability to use predictive analytics models and biometric markers monitoring for player workload management directly impacts asset value and availability.
- For instance, teams implementing comprehensive injury prevention software, informed by biomechanical analysis tools and physiological data streaming, have achieved up to a 30% reduction in non-contact injuries. This shift transforms analytics from a coaching tool into a core business strategy.
- The market’s trajectory is toward fully unified platforms that combine optical tracking systems, impact sensing technology, and rfid tracking technologies to provide a single source of truth for both on-field performance and commercial operations.
What are the Key Data Covered in this Sports Analytics Market Research and Growth Report?
-
What is the expected growth of the Sports Analytics Market between 2026 and 2030?
-
USD 9.55 billion, at a CAGR of 27%
-
-
What segmentation does the market report cover?
-
The report is segmented by Type (Football, Cricket, Hockey, Tennis, and Others), Solution (Player analysis, Team performance analysis, Health assessment, Fan engagement analysis, and Others), Component (Software, and Services) and Geography (North America, APAC, Europe, South America, Middle East and Africa)
-
-
Which regions are analyzed in the report?
-
North America, APAC, Europe, South America and Middle East and Africa
-
-
What are the key growth drivers and market challenges?
-
Increasing investment in smart stadiums, Data privacy and ethical barriers
-
-
Who are the major players in the Sports Analytics Market?
-
Blinkfire Analytics Inc., Catapult Group, ChyronHego Corp., Deltatre SpA, ExlService Holdings Inc., Experfy Inc., IBM Corp., iSportsAnalysis Ltd., Oracle Corp., Qualitas Global Services B.V., Salesforce Inc., SAP SE, SAS Institute Inc., Sportcor, Sportradar Group AG, SportsSource Analytics, Stats Perform group of Co, The Nielsen Co. LLC, TruMedia Networks Inc. and Zebra Technologies Corp.
-
Market Research Insights
- The sports analytics market is shaped by a dynamic interplay between technological innovation and operational demands. The implementation of smart stadium infrastructure, featuring internet of things sensors, improves venue management optimization, with some facilities achieving over 20% reduction in energy costs.
- Concurrently, data-driven decision-making in player health, supported by early signs of fatigue detection, has led to a decrease in non-contact injury rates by up to 30% for teams using advanced injury prevention software. This focus on athlete welfare is critical, as it directly impacts team financial stability.
- The expansion of regulated sports betting further accelerates demand for solutions with minimal real-time data latency. These dynamics push organizations toward unified data architectures and interoperable systems standards to maximize the value derived from performance and operational data.
We can help! Our analysts can customize this sports analytics market research report to meet your requirements.
 RIA -
RIA - 
