
Sports Leagues Market Size and Growth Forecast 2026-2030
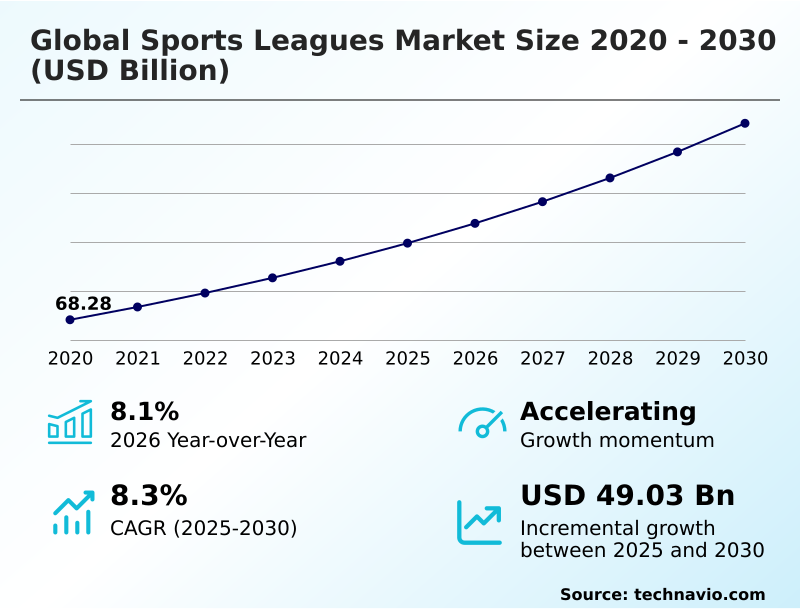
The Sports Leagues Market size was valued at USD 99.62 billion in 2025 growing at a CAGR of 8.3% during the forecast period 2026-2030.
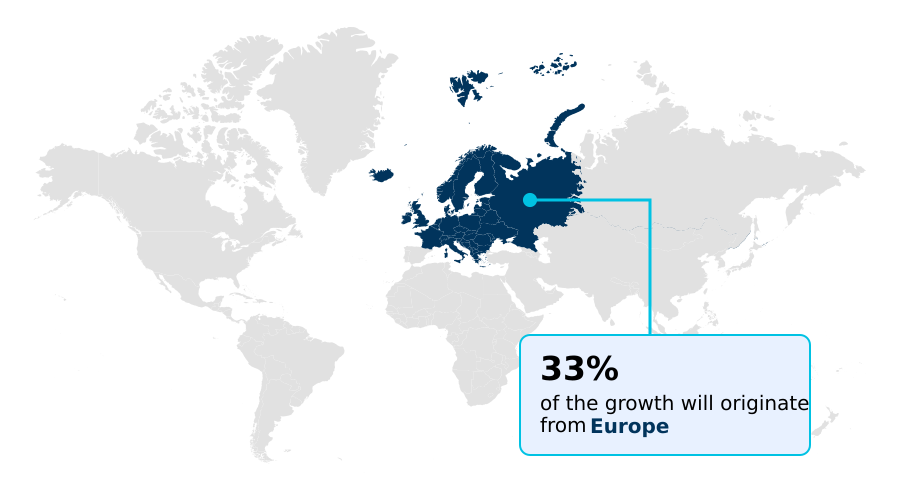
Europe accounts for 32.7% of incremental growth during the forecast period. The Relegation leagues segment by Type was valued at USD 42.39 billion in 2024, while the Football segment holds the largest revenue share by Product Type.
The market is projected to grow by USD 80.37 billion from 2020 to 2030, with USD 49.03 billion of the growth expected during the forecast period of 2025 to 2030.
Get Key Insights on Market Forecast (PDF) Request Free Sample
Sports Leagues Market Overview
The sports leagues market is undergoing a significant operational shift, driven by the need to optimize global broadcasting and fan engagement. With an 8.1% year-over-year growth, the emphasis is on creating sustainable revenue streams beyond traditional ticket sales. Leagues are now sophisticated media entities leveraging over-the-top technology for direct-to-consumer streaming, which is particularly effective in APAC, the fastest-growing region. This digital transformation initiatives allows for intellectual property monetization on a global scale. A primary application is seen in new stadium builds, where a biometric entry system is integrated with a central fan engagement platform. This not only enhances security but also enables the use of dynamic pricing models based on real-time attendance data, typically improving matchday revenue optimization by double-digit percentages. Such data-driven fan insights are crucial for tailoring sponsorship activation and content. However, this expansion brings challenges, requiring robust league governance frameworks to manage everything from media rights to athlete welfare.
Drivers, Trends, and Challenges in the Sports Leagues Market
Strategic decision-making in the sports leagues market is increasingly complex, balancing the impact of sports wagering on viewership with long-term brand integrity. The direct-to-consumer streaming platform launch has become a standard tactic for intellectual property monetization, but it intensifies the challenge of managing media rights fragmentation.
Inside a league’s operational headquarters, organizational network analysis is used to optimize communication between commercial and technical departments, ensuring that the rollout of generative AI in live sports broadcasting aligns with sponsorship commitments. This is critical as the private equity impact on league valuation pushes for higher returns.
This pressure often leads to schedule expansion, creating a direct conflict with athlete welfare, a concern that must be managed under collective bargaining agreements and institutional policies like the FIFPRO Post-Season Break Policy, which mandates a minimum rest period. The implementation of biometric technology for stadium security, while improving efficiency, also requires significant capital expenditure and careful data management.
For instance, a league adopting this technology sees a higher initial cost than one focusing solely on NFTs and digital collectibles in sports, but the former provides tangible operational data for future planning. Sustainability reporting in league operations is another growing pressure point, especially for leagues pursuing a sports league internationalization strategy that involves extensive travel.
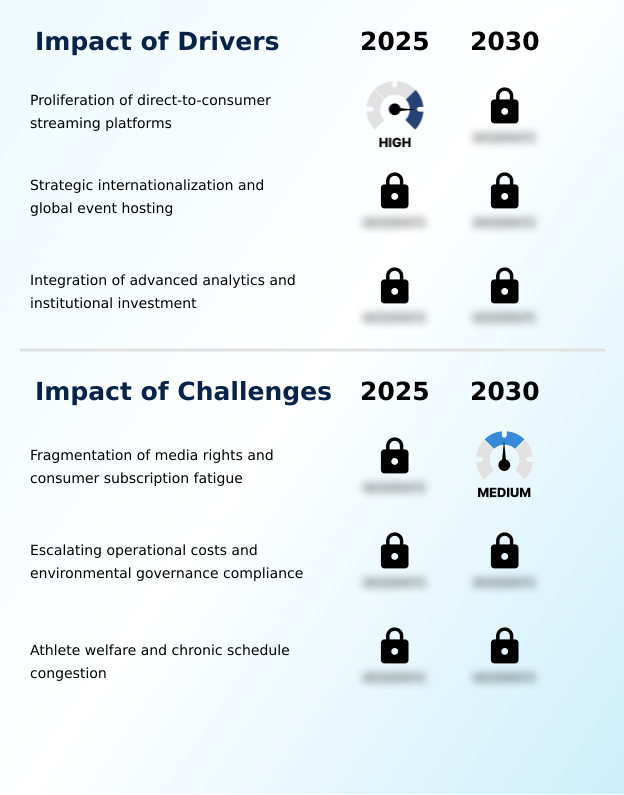
Primary Growth Driver: The proliferation of direct-to-consumer streaming platforms is a primary market driver, enabling leagues to bypass traditional broadcasters and cultivate a direct relationship with their global fan base.
The market's expansion is heavily driven by new ownership models and global expansion. The influx of institutional investment from private equity and sovereign wealth funds provides the capital for significant digital transformation initiatives and global brand-building.
This internationalization strategy is exemplified by North American leagues, which are growing at 8.4%, staging regular-season games in new territories to cultivate a global fan base. This strategy relies on sophisticated digital asset management to deliver localized content.
This shift professionalizes league governance frameworks and accelerates the adoption of technologies that support global operations, such as cloud broadcasting for direct-to-consumer streaming platforms, further fueling the cycle of growth and investment.
Emerging Market Trend: The sports leagues market is increasingly defined by a strategic shift toward hyper-personalization, driven by the integration of immersive technologies and generative artificial intelligence to deepen fan engagement.
A primary trend is the adoption of immersive technologies to drive hyper-personalization in the fan experience. Leagues are deploying augmented reality and virtual reality to create interactive stadium environments accessible from anywhere, a key component of their digital content monetization strategy. This is coupled with the use of generative artificial intelligence to deliver customized real-time commentary and highlights.
In Europe, which accounts for 32.7% of market growth, clubs are integrating these technologies into their mobile applications to deepen engagement. This shift allows for more effective sponsorship activation, providing partners with granular data on user interactions.
The trend is moving the market from a broadcast-centric model to a data-driven fan insights model, where every interaction is a potential revenue source.
Key Industry Challenge: Significant market challenges arise from the fragmentation of media rights and resulting consumer subscription fatigue, complicating viewership and testing fan loyalty.
A significant challenge is the rising operational complexity tied to environmental governance compliance and athlete welfare management. Leagues face mounting pressure to implement sustainability measures, such as those outlined in the UNFCCC's Sports for Climate Action Framework, which adds cost and logistical hurdles, particularly for leagues with an aggressive internationalization strategy.
Simultaneously, schedule congestion from expanded competitions leads to higher injury rates and physical burnout, prompting labor disputes and legal challenges from player unions over violations of collective bargaining agreements. This forces a difficult balancing act between maximizing commercial revenue diversification and ensuring the long-term health of athletes, a core component of the on-field product.
These issues directly impact financial planning and risk management at the highest levels of league administration.
Explore Full Market Dynamics Analysis Request Free Sample
Sports Leagues Market Segmentation
The sports leagues industry research report provides comprehensive data including region-wise segment analysis, with forecasts and analysis for the period 2026-2030, as well as historical data from 2020-2024 for the following segments.
Type Segment Analysis
The relegation leagues segment is estimated to witness significant growth during the forecast period.
The relegation leagues segment operates on a performance-based system of promotion and demotion, a structure that ensures high-stakes competition.
This model, which accounted for a significant 45.8% share of the market in 2024, fosters intense fan engagement but introduces financial volatility for clubs facing demotion. To mitigate this, league governance frameworks often include solidarity payments.
Decision-makers must balance the meritocratic appeal with the need for financial stability.
For instance, following the Union of European Football Associations (UEFA) Financial Sustainability Regulations, leagues are revising financial distribution to maintain competitive balance, a core component of commercial rights management.
This data-driven approach to revenue sharing, supported by enterprise resource planning, is critical for the long-term health of leagues that rely on this dynamic structure and a robust talent development pipeline.
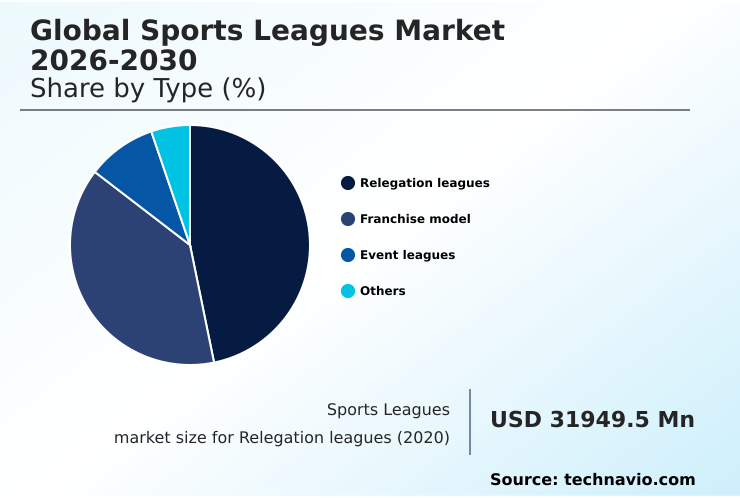
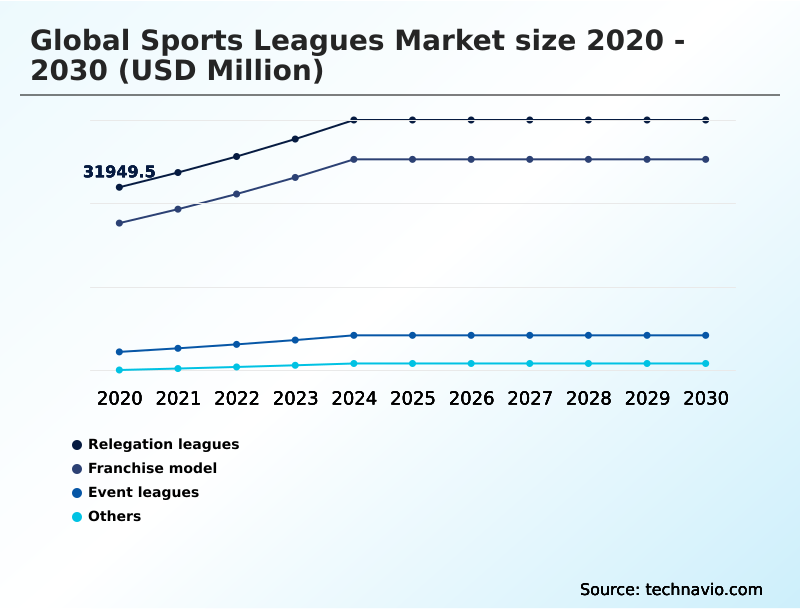
The Relegation leagues segment was valued at USD 42.39 billion in 2024 and showed a gradual increase during the forecast period.
Sports Leagues Market by Region: Europe Leads with 32.7% Growth Share
Europe is estimated to contribute 32.7% to the growth of the global market during the forecast period.
The geographic landscape of the sports leagues market is diversifying, with North America and Europe currently commanding over 60% of the market.
Europe, contributing 32.7% to the global incremental growth, leverages its deep-rooted club history and relegation-based systems to drive fan loyalty and stable media rights income.
In contrast, North America's franchise model provides a stable platform for institutional investment and sports wagering integration. Meanwhile, APAC is the fastest-growing region, with its expansion fueled by the rapid adoption of over-the-top technology and mobile-first engagement.
A key aspect is the talent development pipeline, where regions like South America continue to be crucial suppliers, influencing global transfer markets and brand equity management. This global interconnectedness requires sophisticated league governance frameworks to manage disparate regulatory environments.
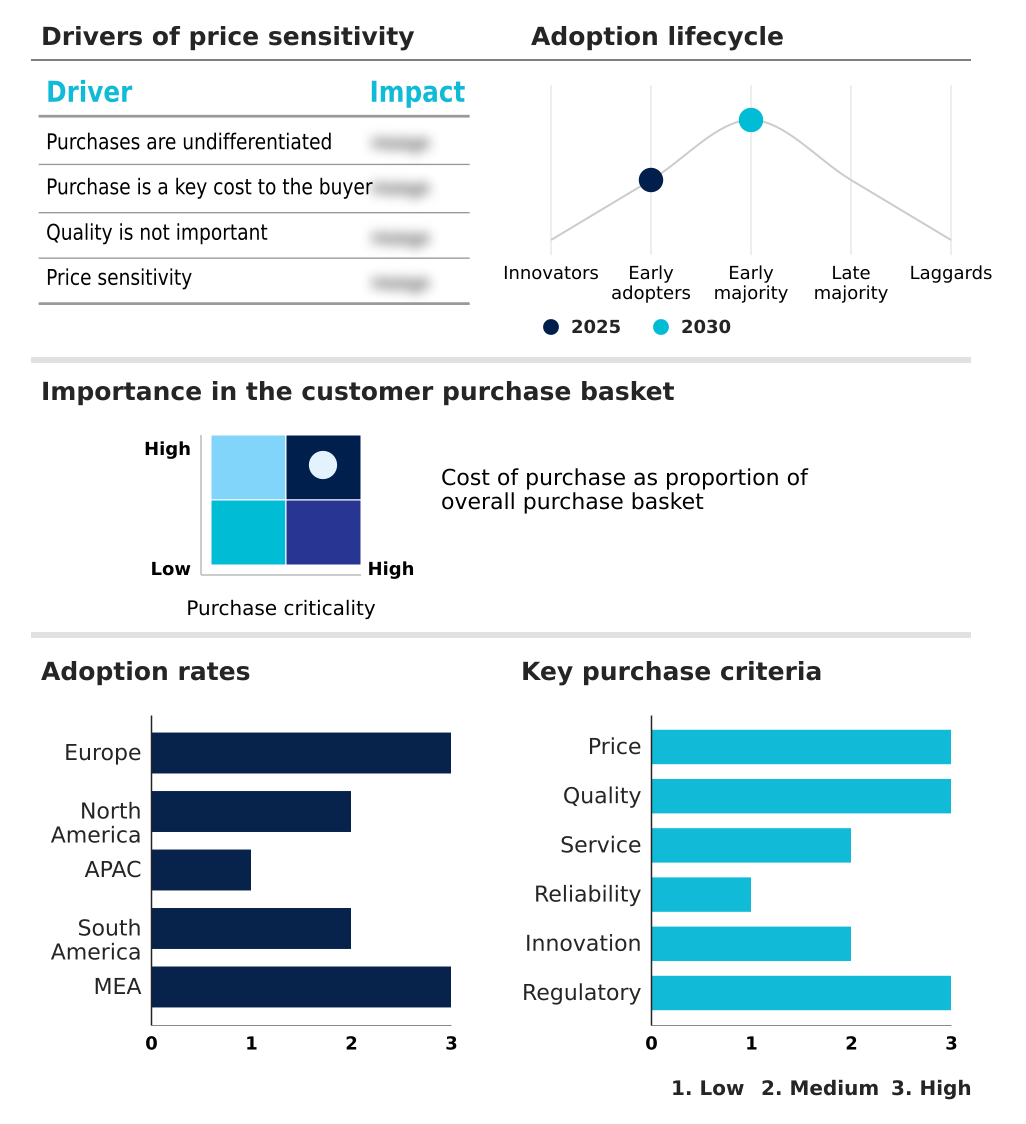
Customer Landscape Analysis for the Sports Leagues Market
The sports leagues market forecasting report includes the adoption lifecycle of the market, covering from the innovator’s stage to the laggard’s stage. It focuses on adoption rates in different regions based on penetration. Furthermore, the sports leagues market report also includes key purchase criteria and drivers of price sensitivity to help companies evaluate and develop their market growth analysis strategies.
Competitive Landscape of the Sports Leagues Market
Companies are implementing various strategies, such as strategic alliances, partnerships, mergers and acquisitions, geographical expansion, and product/service launches, to enhance their presence in the sports leagues market industry.
DORNA SPORTS S.L. - Management of premier motorcycle racing championships, overseeing global commercial rights, media distribution, and event logistics for a high-octane sports technology ecosystem.
The industry research and growth report includes detailed analyses of the competitive landscape of the market and information about key companies, including:
- DORNA SPORTS S.L.
- Electronic Arts Inc.
- Eredivisie CV.
- ESPN Sports Media Ltd.
- Euroleague Ventures SA
- J.LEAGUE Inc.
- Korea Baseball Organization
- LaLiga Group International.
- Lega Calcio Serie A.
- LPGA.
- Major League Soccer L.L.C.
- MLB Advanced Media L.P.
- NHL Interactive CyberEnterprises LLC
- NBA Media Ventures LLC.
- NFL Enterprises LLC.
- Nike Inc.
- PGA TOUR Inc.
- Premier League Ltd.
- Premier Rugby Ltd.
- WTA TOUR INC.
Qualitative and quantitative analysis of companies has been conducted to help clients understand the wider business environment as well as the strengths and weaknesses of key industry players. Data is qualitatively analyzed to categorize companies as pure play, category-focused, industry-focused, and diversified; it is quantitatively analyzed to categorize companies as dominant, leading, strong, tentative, and weak.
Recent Developments in the Sports Leagues Market
- In August 2025, Major League Baseball implemented a new league-wide data integration platform to synchronize player performance metrics with real-time fan engagement tools, enhancing its sports wagering integration capabilities.
- In October 2025, the National Football League successfully conducted its inaugural regular-season fixture in Madrid, Spain, demonstrating the viability of its internationalization strategy in Southern Europe.
- In March 2025, the National Basketball Association launched an updated version of its global digital application, introducing localized streaming interfaces and multi-language commentary for fans in the Indian subcontinent.
- In June 2025, a prominent sovereign wealth fund finalized a significant minority investment in a newly restructured global tennis circuit, providing capital to equalize prize money and enhance the tour's technological capabilities.
Research Analyst Overview: Sports Leagues Market
The sports leagues market is evolving into a technology-driven entertainment business where data-driven fan insights are the core asset. Boardroom decisions now center on the high capital expenditures required for stadium infrastructure modernization, weighing the ROI of a biometric entry system against launching a proprietary fan engagement platform.
The market's 8.1% year-over-year growth is largely propelled by this digital transformation initiative. North America, for instance, is leveraging its mature market to pioneer sports wagering integration, a move that requires strict adherence to state-level regulations like those set by the Nevada Gaming Control Board. This involves complex data handling and generative artificial intelligence for creating real-time odds.
The deployment of over-the-top technology for direct-to-consumer streaming is a universal strategy, but it requires significant investment in cloud broadcasting infrastructure and digital asset management. This pivot is essential for intellectual property monetization beyond traditional media deals, turning leagues into global content producers that must master both sports and technology.
Dive into Technavio’s robust research methodology, blending expert interviews, extensive data synthesis, and validated models for unparalleled Sports Leagues Market insights. See full methodology.
| Market Scope | |
|---|---|
| Page number | 311 |
| Base year | 2025 |
| Historic period | 2020-2024 |
| Forecast period | 2026-2030 |
| Growth momentum & CAGR | Accelerate at a CAGR of 8.3% |
| Market growth 2026-2030 | USD 49032.5 million |
| Market structure | Fragmented |
| YoY growth 2025-2026(%) | 8.1% |
| Key countries | UK, Germany, Spain, Italy, France, The Netherlands, US, Canada, Mexico, China, India, Japan, Australia, South Korea, Indonesia, Brazil, Argentina, Colombia, Saudi Arabia, UAE, South Africa, Egypt and Turkey |
| Competitive landscape | Leading Companies, Market Positioning of Companies, Competitive Strategies, and Industry Risks |
Sports Leagues Market: Key Questions Answered in This Report
-
What is the expected growth of the Sports Leagues Market between 2026 and 2030?
-
The Sports Leagues Market is expected to grow by USD 49.03 billion during 2026-2030, registering a CAGR of 8.3%. Year-over-year growth in 2026 is estimated at 8.1%%. This acceleration is shaped by proliferation of direct-to-consumer streaming platforms, which is intensifying demand across multiple end-use verticals covered in the report.
-
-
What segmentation does the market report cover?
-
The report is segmented by Type (Relegation leagues, Franchise model, Event leagues, and Others), Product Type (Football, Basketball, American football, Cricket, and Others), Revenue Stream (Broadcasting and media rights, Sponsorship and commercial revenue, Ticket sales, Merchandising and licensing, and Others) and Geography (Europe, North America, APAC, South America, Middle East and Africa). Among these, the Relegation leagues segment is estimated to witness significant growth during the forecast period, driven by rising adoption across key application areas. Each segment includes detailed qualitative and quantitative analysis, along with historical data from 2020-2024 and forecasts through 2030 with year-over-year growth rates.
-
-
Which regions are analyzed in the report?
-
The report covers Europe, North America, APAC, South America and Middle East and Africa. Europe is estimated to contribute 32.7% to market growth during the forecast period. Country-level analysis includes UK, Germany, Spain, Italy, France, The Netherlands, US, Canada, Mexico, China, India, Japan, Australia, South Korea, Indonesia, Brazil, Argentina, Colombia, Saudi Arabia, UAE, South Africa, Egypt and Turkey, with dedicated market size tables and year-over-year growth for each.
-
-
What are the key growth drivers and market challenges?
-
The primary driver is proliferation of direct-to-consumer streaming platforms, which is accelerating investment and industry demand. The main challenge is fragmentation of media rights and consumer subscription fatigue, creating operational barriers for key market participants. The report quantifies the impact of each driver and challenge across 2026 and 2030 with comparative analysis.
-
-
Who are the major players in the Sports Leagues Market?
-
Key vendors include DORNA SPORTS S.L., Electronic Arts Inc., Eredivisie CV., ESPN Sports Media Ltd., Euroleague Ventures SA, J.LEAGUE Inc., Korea Baseball Organization, LaLiga Group International., Lega Calcio Serie A., LPGA., Major League Soccer L.L.C., MLB Advanced Media L.P., NHL Interactive CyberEnterprises LLC, NBA Media Ventures LLC., NFL Enterprises LLC., Nike Inc., PGA TOUR Inc., Premier League Ltd., Premier Rugby Ltd. and WTA TOUR INC.. The report provides qualitative and quantitative analysis categorizing companies as dominant, leading, strong, tentative, and weak based on their market positioning. Company profiles include business segment analysis, SWOT assessment, key offerings, and recent strategic developments.
-
Sports Leagues Market Research Insights
Market dynamics are shaped by a strategic pivot towards global brand equity management and commercial revenue diversification. Leagues are actively pursuing an internationalization strategy to counter domestic market saturation, a move reflected in North America's 8.4% growth momentum.
This expansion requires sophisticated digital asset management and adherence to diverse regulatory frameworks, such as the EU's General Data Protection Regulation (GDPR) when handling fan data analytics from European viewers. In practice, a North American league staging a regular-season game in Europe must deploy a localized content strategy and ensure its fan engagement platform is compliant.
This focus on mobile-first engagement and cultivating a global fan base is critical as leagues increasingly function as year-round media enterprises, moving beyond the confines of their seasonal calendars.
We can help! Our analysts can customize this sports leagues market research report to meet your requirements.
 RIA -
RIA - 
