
Sports Nutrition Market in South America Size 2024-2028
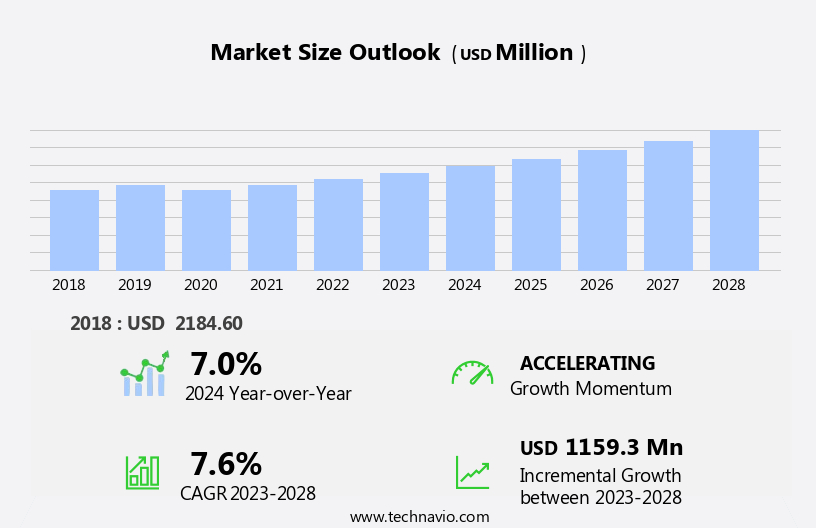
The sports nutrition market in south america size is forecast to increase by USD 1.16 billion, at a CAGR of 7.6% between 2023 and 2028.
- The market is experiencing significant growth, driven by the increasing trend towards healthier lifestyles and heightened awareness regarding the benefits of protein-based sports nutrition products. Consumers are increasingly recognizing the importance of proper nutrition in supporting an active lifestyle, leading to a surge in demand for high-protein, nutrient-dense foods and supplements. However, market expansion is not without challenges. Product recalls have emerged as a significant obstacle, posing a threat to both consumer safety and brand reputation. Companies must prioritize rigorous quality control measures to mitigate this risk and maintain consumer trust. Additionally, navigating the complex regulatory landscape in various South American countries can pose challenges for market entrants.
- To capitalize on the market's potential, companies must stay informed of local regulations and adapt their strategies accordingly. By addressing these challenges and leveraging the growing consumer demand for sports nutrition products, businesses can effectively position themselves for success in this dynamic market.
What will be the Size of the Sports Nutrition Market in South America during the forecast period?
Explore in-depth regional segment analysis with market size data - historical 2018-2022 and forecasts 2024-2028 - in the full report.
Request Free Sample
The market continues to evolve, driven by the growing health-conscious consumer base and increasing participation in various sectors of physical activity. Retail sales of sports nutrition products, including protein powders, bars, and energy gels, have seen significant growth as more active individuals seek to optimize their performance and recovery. Sports nutritionists play a crucial role in this market, providing guidance on nutrition planning and supply chain management to ensure the highest quality products. Casein protein, a slow-digesting protein, and soy protein are popular choices among consumers for muscle growth and weight gain. Distribution channels have expanded to include fitness professionals, who recommend products to their clients and contribute to brand loyalty.
Endurance training and strength training have driven demand for energy bars and pre-workout supplements, while pricing strategies and ethical sourcing have become key differentiators for brands. Manufacturing processes adhere to GMP standards, ensuring product safety and quality control. Ingredient sourcing and dietary strategies have become essential considerations for companies, with a focus on natural and sustainable ingredients. Product innovation continues to be a significant trend, with new supplement formulations, nutritional labeling, and herbal extracts entering the market. Performance enhancement and energy drinks have gained popularity among athletes, while amino acids and meal replacement shakes cater to those seeking overall health and wellness.
The market remains dynamic, with ongoing activities and evolving patterns shaping the landscape. Consumer preferences and trends will continue to influence the market, driving innovation and growth.
How is this Sports Nutrition in South America Industry segmented?
The sports nutrition in south america industry research report provides comprehensive data (region-wise segment analysis), with forecasts and estimates in "USD million" for the period 2024-2028, as well as historical data from 2018-2022 for the following segments.
- Product
- Non-protein sports nutrition
- Protein powder
- Protein RTD
- Protein bar
- Distribution Channel
- Supermarkets
- Online Retail
- Specialty Stores
- Pharmacies
- Offline
- Application
- Muscle Building
- Energy Enhancement
- Weight Management
- Recovery
- End-User
- Athletes
- Fitness Enthusiasts
- Casual Consumers
- Geography
- South America
- Argentina
- Brazil
- Colombia
- South America
By Product Insights
The non-protein sports nutrition segment is estimated to witness significant growth during the forecast period.
In South America, the non-protein sports nutrition market is experiencing steady growth due to the increasing preference for convenient products and the rising number of health-conscious consumers. This segment encompasses various non-protein products such as amino acids, carbohydrates, Beta-alanine, creatine, L-carnitine, and nitric oxide boosters. These nutrients are available in various forms, including powders, bars, RTDs, gels, and tablets. Brazil, Argentina, and Chile are the primary markets for these products. Consumers with specific health conditions, like liver or kidney disorders, may opt for non-protein products, as excessive protein intake could negatively impact their metabolism. Third-party testing, quality control, and ethical sourcing are crucial factors in the sports nutrition industry.
Manufacturers prioritize these aspects to ensure the safety and efficacy of their products. Supply chain management and distribution channels are also essential for maintaining product availability and affordability. Marketing strategies, including sports sponsorships and partnerships with fitness professionals, help boost brand loyalty and reach a wider audience. Product innovation, such as the development of new supplement formulations and nutritional labeling, caters to evolving consumer preferences. Herbal extracts and amino acids are increasingly popular ingredients, with muscle growth and energy enhancement being key performance benefits. Dietary strategies, like meal replacement shakes and weight gainers, cater to various consumer needs.
Pre- and post-workout supplements, energy bars, and electrolyte drinks are popular choices for active individuals undergoing endurance training and strength training. Sports nutritionists and retail sales play a significant role in educating consumers about the benefits and proper usage of these products. Pricing strategies and ingredient sourcing are also essential considerations for manufacturers to remain competitive in the market. Overall, the market is dynamic and evolving, with a focus on providing high-quality, safe, and effective products to cater to the diverse needs of active individuals.
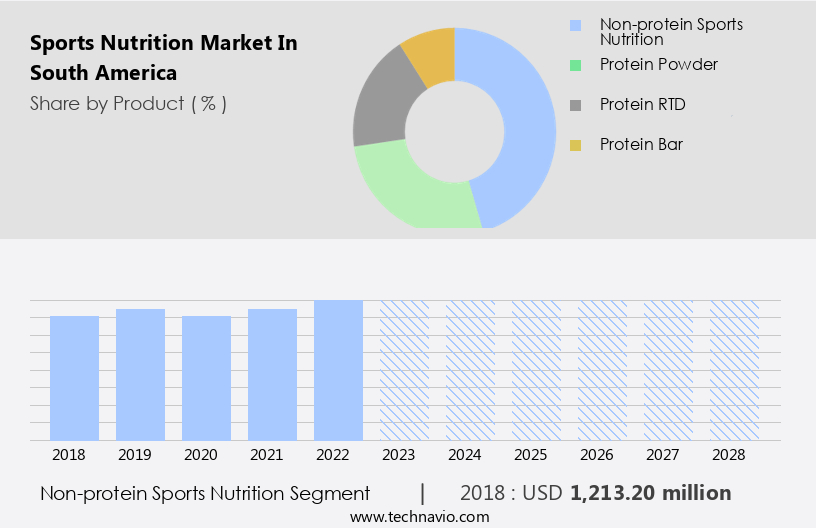
The Non-protein sports nutrition segment was valued at USD 1.21 billion in 2018 and showed a gradual increase during the forecast period.
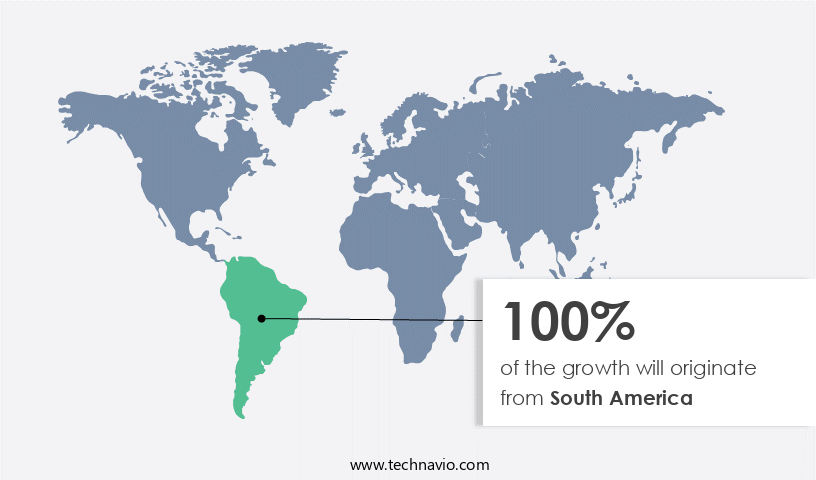
Regional Analysis
South America is estimated to contribute 100% to the growth of the global market during the forecast period.Technavio’s analysts have elaborately explained the regional trends and drivers that shape the market during the forecast period.
The market, specifically in Brazil, is experiencing notable growth due to the rising health consciousness and cultural emphasis on sports and physical activity. The expanding middle class population is driving demand for products that support performance, recovery, and overall wellness. Protein supplements, energy bars, and ready-to-drink (RTD) products dominate the market, with protein powders being the most popular segment. Ethical sourcing and quality control are essential considerations for consumers, leading to increased third-party testing and supply chain management. Nutrition planning and sports nutritionists play a significant role in guiding active individuals in their dietary strategies, which include protein, amino acids, and meal replacement shakes.
The market is innovative, with product offerings ranging from whey and casein protein to herbal extracts and energy gels for endurance training. Manufacturing processes adhere to GMP standards, ensuring supplement formulation and nutritional labeling accuracy. Consumers prioritize health and safety, leading to pricing strategies that cater to various budgets and preferences. Distribution channels have expanded, making sports nutrition products more accessible, including fitness professionals and retail sales. The market continues to evolve, with new product innovations and consumer preferences shaping the landscape.
Market Dynamics
Our researchers analyzed the data with 2023 as the base year, along with the key drivers, trends, and challenges. A holistic analysis of drivers will help companies refine their marketing strategies to gain a competitive advantage.
What are the key market drivers leading to the rise in the adoption of Sports Nutrition in South America Industry?
- The market is significantly driven by the increasing adoption of healthy lifestyle changes, reflecting a growing consumer preference for wellness and nutrition.
- The South American sports nutrition market is experiencing significant growth due to the increasing prioritization of health and wellness. The preference for an active lifestyle, aimed at maintaining physical fitness, is a primary driver for this market. Health clubs and gyms, with their expanding memberships, serve as crucial distribution channels for sports nutrition products. Protein supplements, such as protein powders and soy protein, as well as nutrition bars and energy gels, are popular items sold at these establishments. Dieticians are employed by health clubs to provide nutrition planning and guidance to customers, ensuring they make informed choices regarding sports supplements.
- The market's growth is further fueled by the increasing popularity of sports supplements worldwide. Quality control, ethical sourcing, third-party testing, and rigorous supply chain management are essential components of the sports nutrition industry to ensure the production and distribution of safe and effective products.
What are the market trends shaping the Sports Nutrition in South America Industry?
- The trend in the market is shifting towards increased awareness and adoption of protein-based sports nutrition products. These products are gaining popularity among professionals and fitness enthusiasts due to their effectiveness in supporting muscle growth and recovery.
- The South American sports nutrition market is experiencing significant growth due to the increasing number of health-conscious consumers seeking high-performance nutritional products. Retail sales of sports nutrition products, including casein protein, weight gainers, and endurance training supplements, have seen a steady increase. The market is driven by the growing trend of active individuals prioritizing their health and dietary strategies. Sports nutritionists are playing a pivotal role in recommending these products to their clients. Ingredient sourcing is a critical factor in the pricing strategies of sports nutrition brands in South America. Natural ingredients, such as stevia and other sugar substitutes, are becoming increasingly popular.
- The distribution channels for sports nutrition products are expanding, making these products more accessible to a wider audience. Protein/energy bars have been the fastest-growing segment in the market due to their convenience and nutritional benefits. The launch of new sports nutrition products is also fueling market growth, with companies like Integralmedica in Brazil experiencing success with their niche brand offerings.
What challenges does the Sports Nutrition in South America Industry face during its growth?
- Product recalls pose a significant challenge to industry growth, as companies must address safety concerns and restore consumer trust following the removal of their products from the market.
- In South America's dynamic sports nutrition market, manufacturers face the challenge of ensuring product safety and effectiveness to maintain brand loyalty. Quality issues, such as contamination or low-quality ingredients, have led to recalls, damaging consumer trust. For instance, Decathlon Sports recalled a batch of its chocolate flavor whey protein due to the presence of metallic fragments. The manufacturing process and poor handling during transportation and distribution can negatively impact product quality. These incidents underscore the importance of rigorous quality control measures to meet the demands of fitness professionals and consumers seeking performance enhancement through products like whey protein, fat burners, pre-workout supplements, electrolyte drinks, sports drinks, and post-workout supplements.
- Marketing strategies that prioritize transparency and authenticity can help build trust and differentiate brands in this competitive market.
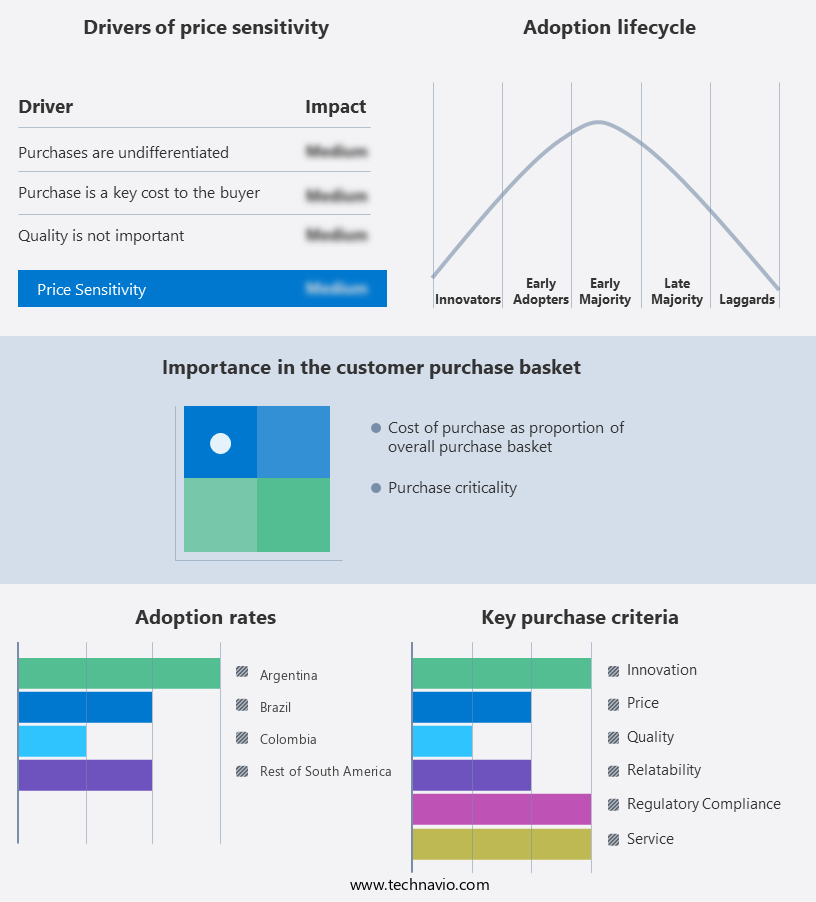
Exclusive Customer Landscape
The sports nutrition market in south america forecasting report includes the adoption lifecycle of the market, covering from the innovator’s stage to the laggard’s stage. It focuses on adoption rates in different regions based on penetration. Furthermore, the sports nutrition market in south america report also includes key purchase criteria and drivers of price sensitivity to help companies evaluate and develop their market growth analysis strategies.
Customer Landscape
Key Companies & Market Insights
Companies are implementing various strategies, such as strategic alliances, sports nutrition market in south america forecast, partnerships, mergers and acquisitions, geographical expansion, and product/service launches, to enhance their presence in the industry.
Amway - This company specializes in the production and distribution of sports nutrition items, including bars, shakes, and supplements, catering to athletes and fitness enthusiasts worldwide. Their offerings aim to enhance performance and support overall wellness through science-backed ingredients and innovative formulations.
The industry research and growth report includes detailed analyses of the competitive landscape of the market and information about key companies, including:
- Amway
- Atlantica Foods
- BioTechUSA
- Bodybuilding.com
- Coca-Cola Company
- General Nutrition Centers
- Glanbia PLC
- Herbalife Nutrition
- Integralmédica
- Iovate Health Sciences
- Max Titanium
- Midway Labs
- Monster Beverage
- Nestlé S.A.
- PepsiCo Inc.
- Probiótica
- Red Bull GmbH
- Universal Nutrition
- USANA Health Sciences
- Weider Global Nutrition
Qualitative and quantitative analysis of companies has been conducted to help clients understand the wider business environment as well as the strengths and weaknesses of key industry players. Data is qualitatively analyzed to categorize companies as pure play, category-focused, industry-focused, and diversified; it is quantitatively analyzed to categorize companies as dominant, leading, strong, tentative, and weak.
Recent Development and News in Sports Nutrition Market In South America
- In January 2024, Brazilian supplement manufacturer, NutriScience Brasil, launched a new line of sports nutrition products, targeting the growing fitness community in South America. The product range, named "PowerFit," includes protein powders, BCAA supplements, and creatine tablets (NutriScience Brasil press release, 2024).
- In March 2024, Argentinean sports nutrition brand, NutriProteina, entered into a strategic partnership with Chilean gym chain, Fitness Factory. This collaboration aimed to offer exclusive discounts on NutriProteina's supplements to Fitness Factory members, expanding the brand's reach in the Chilean market (Fitness Factory press release, 2024).
- In May 2025, Colombian sports nutrition company, NutriSport, secured a Series A funding round of USD5 million from US-based investment firm, Proven Ventures. The funds will be used to expand production capacity and launch new product lines in the South American market (Proven Ventures press release, 2025).
- In the same month, the Argentinean government announced a new regulatory framework for sports nutrition products, requiring all manufacturers to adhere to stricter labeling and safety standards. The initiative aims to ensure consumer protection and boost market transparency (Argentinean Ministry of Health press release, 2025).
Research Analyst Overview
- The South American sports nutrition market is witnessing significant activity and trends, driven by the growing demand for effective products backed by clinical trials and formulation science. Online marketing strategies, including content and influencer marketing, are increasingly popular, ensuring ingredient traceability and consumer trust. Weight management, gut health, and hormonal balance are key areas of focus, with organic protein, nitric oxide boosters, and ergogenic aids leading the charge. Direct-to-consumer sales and retail partnerships are expanding, while product development in concentrate protein, isolate protein, and micellar casein continues.
- Scientific research on metabolic rate, muscle recovery, and performance monitoring fuels innovation, with social media marketing and packaging design playing crucial roles in consumer engagement. Vegan protein and immune system support are also gaining traction, as consumers prioritize health and wellness.
Dive into Technavio’s robust research methodology, blending expert interviews, extensive data synthesis, and validated models for unparalleled Sports Nutrition Market in South America insights. See full methodology.
|
Market Scope |
|
|
Report Coverage |
Details |
|
Page number |
156 |
|
Base year |
2023 |
|
Historic period |
2018-2022 |
|
Forecast period |
2024-2028 |
|
Growth momentum & CAGR |
Accelerate at a CAGR of 7.6% |
|
Market growth 2024-2028 |
USD 1159.3 million |
|
Market structure |
Fragmented |
|
YoY growth 2023-2024(%) |
7.0 |
|
Key countries |
Brazil, Argentina, Colombia, and Rest of South America |
|
Competitive landscape |
Leading Companies, Market Positioning of Companies, Competitive Strategies, and Industry Risks |
What are the Key Data Covered in this Sports Nutrition Market in South America Research and Growth Report?
- CAGR of the Sports Nutrition in South America industry during the forecast period
- Detailed information on factors that will drive the growth and forecasting between 2024 and 2028
- Precise estimation of the size of the market and its contribution of the industry in focus to the parent market
- Accurate predictions about upcoming growth and trends and changes in consumer behaviour
- Growth of the market across South America
- Thorough analysis of the market’s competitive landscape and detailed information about companies
- Comprehensive analysis of factors that will challenge the sports nutrition market in south america growth of industry companies
We can help! Our analysts can customize this sports nutrition market in south america research report to meet your requirements.
 RIA -
RIA - 
