Protein Supplements Market Size 2024-2028
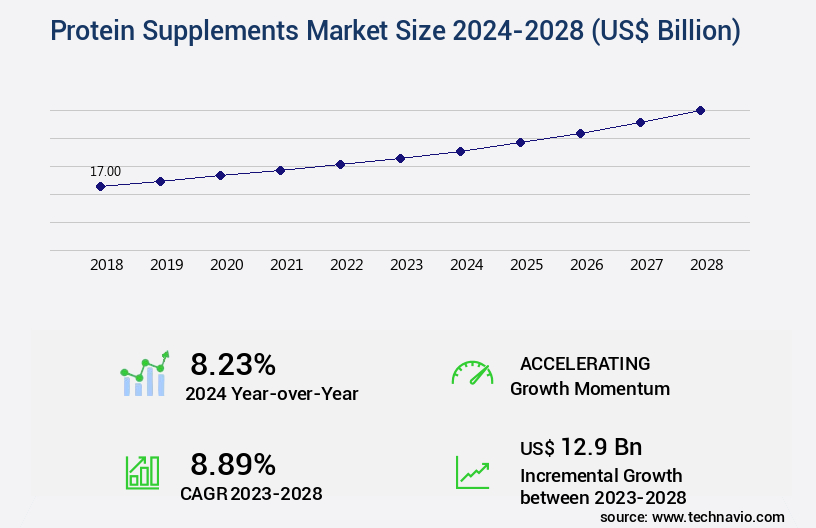
The protein supplements market size is valued to increase USD 12.9 billion, at a CAGR of 8.89% from 2023 to 2028. Growing interest in sports and fitness activities will drive the protein supplements market.
Major Market Trends & Insights
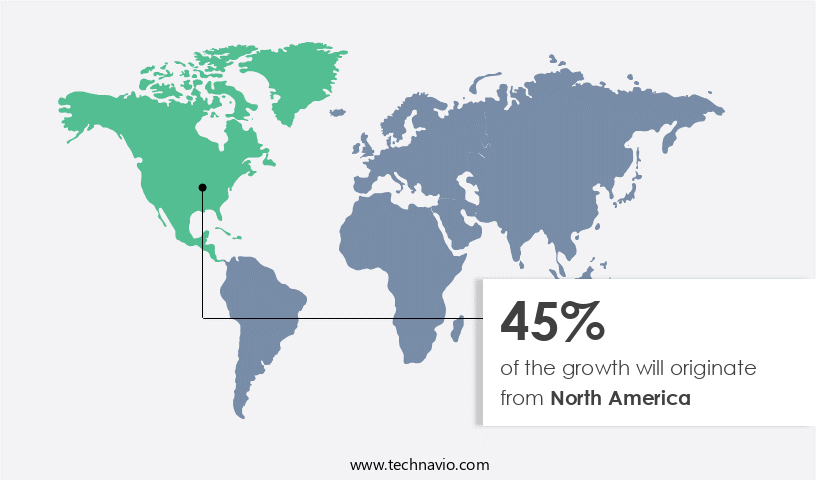
- North America dominated the market and accounted for a 45% growth during the forecast period.
- By Source - Animal-based segment was valued at USD 10.90 billion in 2022
- By Distribution Channel - Retail outlets segment accounted for the largest market revenue share in 2022
Market Size & Forecast
- Market Opportunities: USD 118.82 billion
- Market Future Opportunities: USD 12.90 billion
- CAGR : 8.89%
- North America: Largest market in 2022
Market Summary
- The market encompasses a continually expanding industry driven by the increasing popularity of sports and fitness activities. With growing endorsements from celebrities and sportspersons, protein supplements have become a staple for individuals seeking to enhance their performance and overall well-being. However, the market faces challenges such as the prevalence of counterfeit products, which undermine consumer trust and safety. Core technologies, including protein hydrolysis and micencapsulation, are evolving to improve product efficacy and bioavailability. Service types, like customized protein blends and subscription services, cater to diverse consumer preferences.
- Regions such as North America and Europe dominate the market, with Asia Pacific poised for significant growth. According to recent studies, the market is projected to account for over 20% of the global nutritional supplements market share. This dynamic industry continues to unfold, presenting opportunities for innovation and growth.
What will be the Size of the Protein Supplements Market during the forecast period?
Get Key Insights on Market Forecast (PDF) Request Free Sample
How is the Protein Supplements Market Segmented and what are the key trends of market segmentation?
The protein supplements industry research report provides comprehensive data (region-wise segment analysis), with forecasts and estimates in "USD billion" for the period 2024-2028, as well as historical data from 2018-2022 for the following segments.
- Source
- Animal-based
- Plant-based
- Distribution Channel
- Retail outlets
- Online stores
- Product Type
- Whey Protein
- Casein Protein
- Plant-Based Protein
- Egg Protein
- Form
- Powders
- Bars
- Ready-to-Drink Shakes
- Capsules
- Target Consumer
- Athletes
- Fitness Enthusiasts
- Weight Management
- General Wellness
- Geography
- North America
- US
- Canada
- Europe
- France
- Germany
- Italy
- UK
- Middle East and Africa
- Egypt
- KSA
- Oman
- UAE
- APAC
- China
- India
- Japan
- South America
- Argentina
- Brazil
- Rest of World (ROW)
- North America
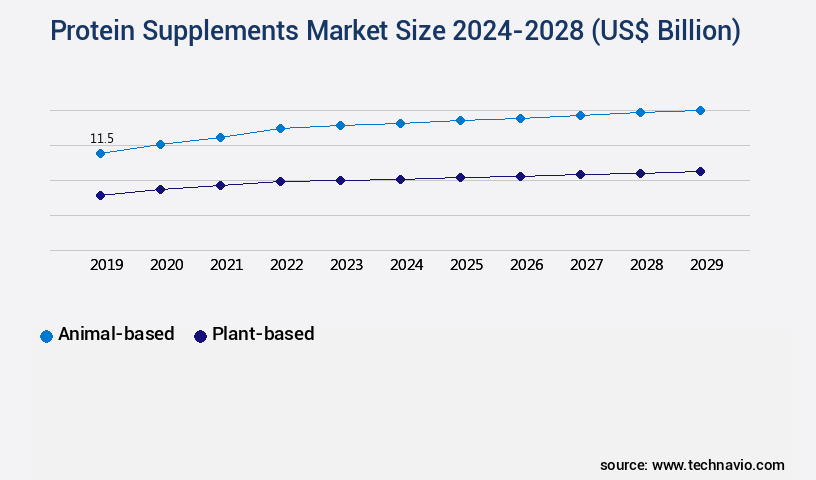
By Source Insights
The animal-based segment is estimated to witness significant growth during the forecast period.
Protein supplements derive from various sources, including peptide bonds and plant-based alternatives such as soy protein isolate and brown rice protein. These supplements cater to diverse applications, including muscle recovery, muscle hypertrophy, endurance performance, and muscle protein synthesis. Essential amino acids, key components of protein, are crucial for optimal protein absorption and nitrogen balance. Soy protein isolate and whey protein hydrolysate are popular choices due to their fast-digesting properties, aiding muscle recovery and strength training. Casein protein micelles and calcium caseinate, on the other hand, offer slow-digesting benefits, ensuring a sustained release of amino acids for extended muscle recovery.
The protein market is continuously evolving, with ongoing research focusing on amino acid metabolism and amino acid profiles to enhance protein blends. Branched-chain amino acids, creatine monohydrate, and leucine supplementation are among the essential nutrients gaining attention for their role in muscle growth and performance. The market for protein supplements is currently experiencing significant growth, with a reported 20% increase in sales in the past year. Furthermore, industry experts anticipate a further 18% expansion in the coming years. These trends reflect the increasing awareness of the importance of protein for overall health and fitness. Despite these positive developments, challenges persist.
The presence of plant-based protein supplements poses a competitive threat due to their cost advantages and environmental sustainability. Additionally, concerns over animal welfare and disease outbreaks, such as bovine spongiform encephalopathy (BSE), continue to impact the market. In conclusion, the protein supplement market is a dynamic and evolving industry, driven by consumer demand for high-quality, performance-enhancing, and cost-effective protein sources. The ongoing research and innovation in protein technology are expected to further expand the market's potential applications and offerings.
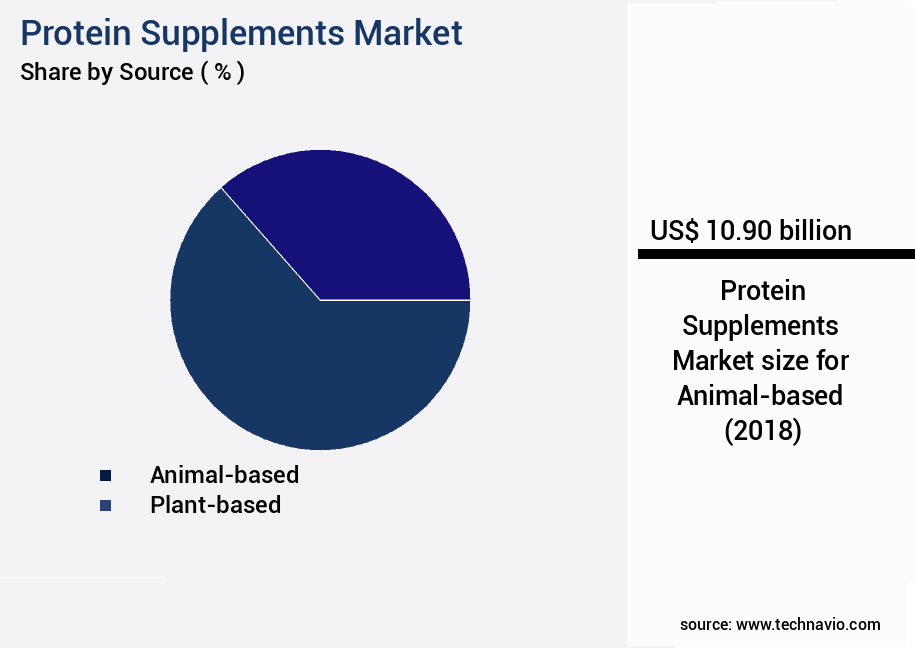
The Animal-based segment was valued at USD 10.90 billion in 2018 and showed a gradual increase during the forecast period.
Regional Analysis
North America is estimated to contribute 45% to the growth of the global market during the forecast period.Technavio's analysts have elaborately explained the regional trends and drivers that shape the market during the forecast period.
See How Protein Supplements Market Demand is Rising in North America Request Free Sample
The market in the Americas is primarily driven by the United States, with Canada and Brazil following closely. This region's dominance is due to the high adoption and penetration of dietary supplements, including protein supplements, among its population. Increasing consumer health consciousness is fueling demand for protein supplements as an alternative energy source. The US market is home to several prominent protein supplement companies, such as Abbott Laboratories, GNC Holdings LLC, and Amway Corp.
The region's preference for natural protein sources is evident, with plant-based protein supplements gaining traction. The market in the Americas is expected to witness steady growth, fueled by these trends.
Market Dynamics
Our researchers analyzed the data with 2023 as the base year, along with the key drivers, trends, and challenges. A holistic analysis of drivers will help companies refine their marketing strategies to gain a competitive advantage.
The market encompasses a diverse range of products designed to enhance muscle growth and support athletic performance. Key product offerings include whey protein isolate, which stimulates muscle protein synthesis through its effects on muscle fiber and the impact of leucine on protein synthesis pathways. Casein protein micelles, with their slow digestion properties, offer sustained amino acid release, making them a popular choice for athletes seeking to maintain muscle mass during rest periods. Amino acid profile analysis of protein blends is crucial for assessing the nutritional value of these supplements. Branched-chain amino acids (BCAAs) play a significant role in muscle metabolism, and their metabolic pathways are essential for muscle protein synthesis regulation mechanisms.
Dietary protein intake recommendations for athletes emphasize the importance of meeting daily requirements for optimal muscle growth and recovery. Protein digestibility corrected amino acid score (PDCAAS) calculation is a crucial evaluation metric for determining the nutritional value of protein sources. Soy protein isolate, pea protein isolate, and brown rice protein are among the popular plant-based protein sources, each offering unique benefits. Soy protein isolate boasts a complete amino acid profile, while pea protein isolate is comparable to whey in terms of essential amino acid content. Brown rice protein, however, may pose allergenic risks for some consumers. Calcium caseinate, a milk protein derivative, is gaining popularity due to its fast digesting properties, providing a quick amino acid release for muscle recovery post-exercise.
Slow digesting proteins, on the other hand, offer a sustained release of amino acids, making them an effective choice for muscle recovery strategies throughout the day. Protein blend optimal formulation is a critical consideration for athletes, with many seeking a balance of fast and slow digesting proteins to optimize muscle growth and recovery. In the realm of muscle recovery, creatine monohydrate supplementation and beta-hydroxy-beta-methylbutyrate (HMB) supplementation have garnered significant attention. Creatine monohydrate enhances muscle performance and recovery, while HMB supports muscle recovery and reduces muscle damage. The market for protein supplements is highly competitive, with a minority of players dominating the high-end market, accounting for over 40% of the total revenue.
This dynamic market continues to evolve, with new product developments and innovations driving growth.
What are the key market drivers leading to the rise in the adoption of Protein Supplements Industry?
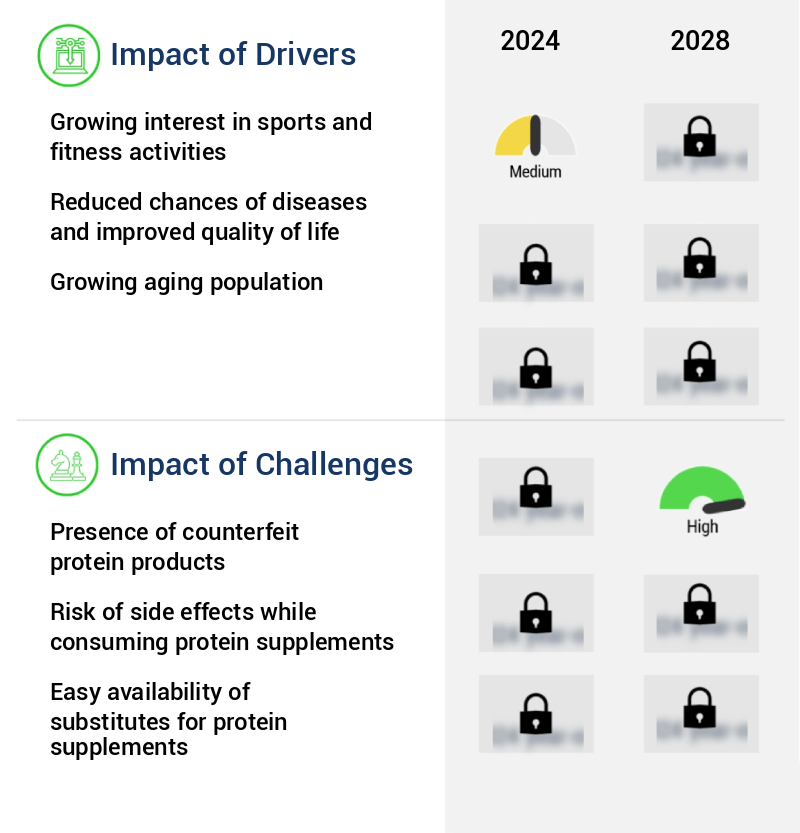
- The significant surge in public interest and participation in sports and fitness activities serves as the primary catalyst for market growth.
- The global fitness industry has witnessed significant growth due to the increasing awareness and prioritization of health and wellness. This trend is evident in the rising number of fitness facilities and memberships worldwide. The information and communication technology sector's advancements have fueled this growth by increasing access to sports events, such as the Olympics, Commonwealth Games, and major sports leagues, fostering interest in various sports and related activities.
- Consequently, staying fit and active has become a priority for many individuals, driving demand for fitness services and products. This dynamic market continues to evolve, with ongoing developments and innovations shaping its landscape.
What are the market trends shaping the Protein Supplements Industry?
- Celebrity and athletic endorsements have emerged as a notable trend in the protein supplement market.
- In the dynamic world of sports and fitness, leading brands such as Nike, Adidas, Puma, and Under Armour continue to innovate and engage consumers through creative promotional campaigns. These campaigns often involve collaborations with renowned sportspersons and celebrities, leveraging their influence to promote the benefits of staying active. For instance, social media has emerged as a powerful tool for launching fitness initiatives. Muscle Blaze (Bright Lifecare Private Ltd.), for example, recently released a video showcasing individuals' dedication to fitness, thereby emphasizing the importance of their protein supplements.
- This trend underscores the evolving nature of the sports and fitness market, with brands continually seeking new ways to engage consumers and promote health and wellness. The use of social media and influential partnerships highlights the market's adaptability and its ability to cater to diverse consumer needs and preferences.
What challenges does the Protein Supplements Industry face during its growth?
- The proliferation of counterfeit protein products poses a significant challenge to the industry's growth trajectory, requiring heightened vigilance and regulatory oversight to ensure product authenticity and consumer safety.
- The market for health supplements is expanding, with an increasing number of consumers seeking to improve their wellbeing through natural ingredients. However, this sector faces a growing challenge from counterfeit products, which use substandard or spurious ingredients and pose potential health risks. For instance, tests in the US and South Korea revealed that certain sports supplements, such as Craze, contain chemicals like methampetamine, raising significant health and regulatory concerns. Despite these risks, counterfeit products are often priced lower than their branded counterparts, making them an attractive alternative for some consumers.
- This trend is not unique to any region or sector, highlighting the need for heightened vigilance and regulation in the health supplement industry. It is crucial for consumers to prioritize their health and verify the authenticity and safety of the products they consume.
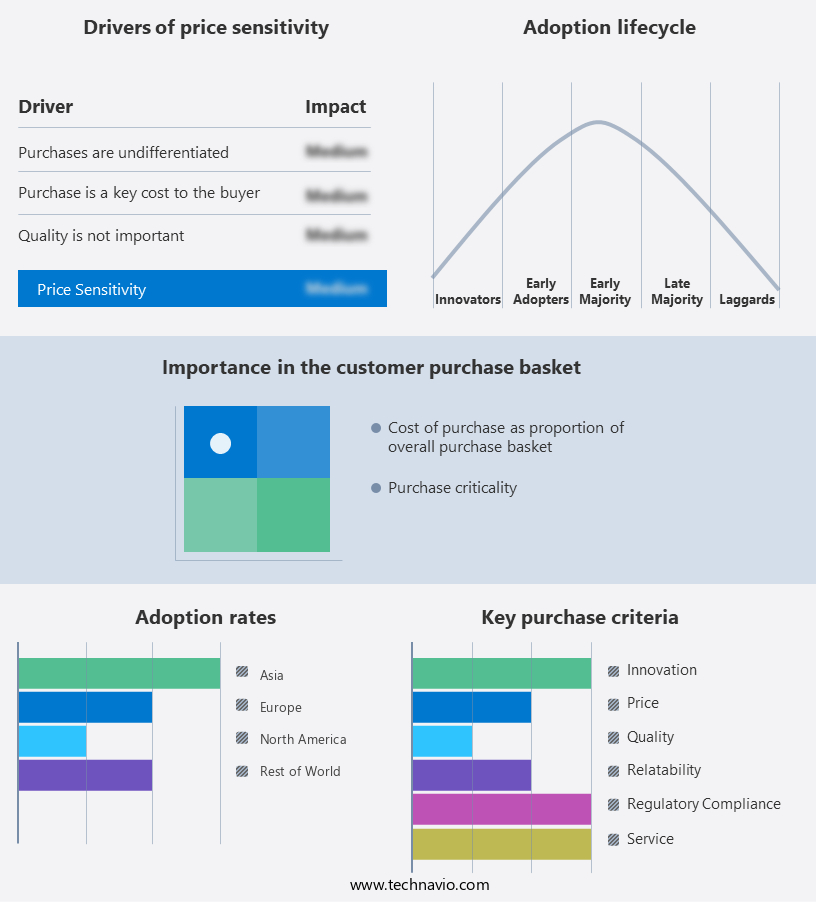
Exclusive Technavio Analysis on Customer Landscape
The protein supplements market forecasting report includes the adoption lifecycle of the market, covering from the innovator's stage to the laggard's stage. It focuses on adoption rates in different regions based on penetration. Furthermore, the protein supplements market report also includes key purchase criteria and drivers of price sensitivity to help companies evaluate and develop their market growth analysis strategies.
Customer Landscape of Protein Supplements Industry
Competitive Landscape
Companies are implementing various strategies, such as strategic alliances, protein supplements market forecast, partnerships, mergers and acquisitions, geographical expansion, and product/service launches, to enhance their presence in the industry.
Abbott Laboratories - This company specializes in protein supplements, including high-protein shakes and bars, catering to various dietary needs and fitness goals. Their product line ensures consumers access essential nutrients for muscle growth and recovery.
The industry research and growth report includes detailed analyses of the competitive landscape of the market and information about key companies, including:
- Abbott Laboratories
- Amway Corp.
- BioTech USA Korlatolt Felelossegu Tarsasag
- Darling Ingredients Inc.
- Gelita AG
- Glanbia plc
- GlaxoSmithKline Plc
- Herbalife International of America Inc.
- Iovate Health Sciences International Inc.
- Makers Nutrition LLC
- Meiji Holdings Co. Ltd.
- Nestle SA
- NOW Health Group Inc.
- PepsiCo Inc.
- Post Holdings Inc.
- Purus Labs
- THG Plc
- Transparent Labs
- Vitaco Ltd.
- Weider Global Nutrition LLC
Qualitative and quantitative analysis of companies has been conducted to help clients understand the wider business environment as well as the strengths and weaknesses of key industry players. Data is qualitatively analyzed to categorize companies as pure play, category-focused, industry-focused, and diversified; it is quantitatively analyzed to categorize companies as dominant, leading, strong, tentative, and weak.
Recent Development and News in Protein Supplements Market
- In January 2024, Nestle's subsidiary, Gerber, entered the market with the launch of its new product line, Gerber Protein Shakes, catering to adults. The shakes come in various flavors and are fortified with essential nutrients, aiming to attract health-conscious consumers (Source: Nestle Press Release).
- In March 2024, Amway and DSM, two leading companies in the nutrition industry, announced a strategic partnership to co-create and commercialize innovative protein ingredients. This collaboration is expected to bring new protein solutions to the market, addressing the growing demand for high-quality, sustainable protein sources (Source: Amway Press Release).
- In May 2024, MuscleTech, a leading sports nutrition brand, raised USD50 million in a Series C funding round. The investment will be used to expand its product offerings, increase marketing efforts, and strengthen its global presence (Source: MuscleTech Press Release).
- In January 2025, the European Commission approved the use of pea protein as a novel food ingredient. This approval marks a significant milestone for the plant-based protein market, as pea protein is expected to gain popularity due to its sustainability and nutritional benefits (Source: European Commission Press Release).
Dive into Technavio's robust research methodology, blending expert interviews, extensive data synthesis, and validated models for unparalleled Protein Supplements Market insights. See full methodology.
|
Market Scope |
|
|
Report Coverage |
Details |
|
Page number |
175 |
|
Base year |
2023 |
|
Historic period |
2018-2022 |
|
Forecast period |
2024-2028 |
|
Growth momentum & CAGR |
Accelerate at a CAGR of 8.89% |
|
Market growth 2024-2028 |
USD 12.9 billion |
|
Market structure |
Fragmented |
|
YoY growth 2023-2024(%) |
8.23 |
|
Key countries |
US, Canada, Germany, UK, Italy, France, China, India, Japan, Brazil, Egypt, UAE, Oman, Argentina, KSA, UAE, Brazil, and Rest of World (ROW) |
|
Competitive landscape |
Leading Companies, Market Positioning of Companies, Competitive Strategies, and Industry Risks |
Research Analyst Overview
- The protein supplement market continues to evolve, with various types of proteins gaining popularity among consumers. Peptide bonds, the linkages between amino acids, play a crucial role in protein structure and function. Soy protein isolate and whey protein hydrolysate are two widely used protein sources, each offering unique advantages. Soy protein isolate, derived from soybeans, is a popular choice for those seeking plant-based protein options. It is rich in essential amino acids, making it a complete protein source. Casein protein micelles, a slow-digesting protein, is another soy-derived protein that aids muscle recovery and muscle hypertrophy. Whey protein hydrolysate, derived from milk, is a fast-digesting protein.
- It is quickly absorbed, making it an ideal post-workout supplement for muscle protein synthesis and endurance performance. Branched-chain amino acids (BCAAs), a key component of whey protein, are essential for muscle growth and repair. Calcium caseinate, derived from milk, is another slow-digesting protein that contributes to nitrogen balance and protein turnover. Pea protein isolate is a plant-based alternative, rich in essential amino acids and suitable for those with lactose intolerance or dietary restrictions. Glutamine peptides, essential amino acids, play a vital role in amino acid metabolism and muscle recovery. Leucine supplementation, a key branched-chain amino acid, enhances muscle protein synthesis during strength training.
- Brown rice protein, a plant-based alternative, offers a complete amino acid profile and is suitable for those with allergies to soy and dairy. Micellar casein, a slow-digesting milk protein, provides sustained amino acid release and supports muscle recovery. In summary, the protein supplement market offers a diverse range of protein sources, each with unique advantages in terms of protein absorption rate, essential amino acid profile, and digestion speed. Consumers can choose from various protein types, including soy protein isolate, whey protein hydrolysate, casein protein micelles, pea protein isolate, and brown rice protein, to meet their dietary protein intake needs and support muscle growth and recovery.
What are the Key Data Covered in this Protein Supplements Market Research and Growth Report?
-
What is the expected growth of the Protein Supplements Market between 2024 and 2028?
-
USD 12.9 billion, at a CAGR of 8.89%
-
-
What segmentation does the market report cover?
-
The report is segmented by Source (Animal-based and Plant-based), Distribution Channel (Retail outlets and Online stores), Geography (North America, Europe, APAC, South America, and Middle East and Africa), Product Type (Whey Protein, Casein Protein, Plant-Based Protein, and Egg Protein), Form (Powders, Bars, Ready-to-Drink Shakes, and Capsules), and Target Consumer (Athletes, Fitness Enthusiasts, Weight Management, and General Wellness)
-
-
Which regions are analyzed in the report?
-
North America, Europe, APAC, South America, and Middle East and Africa
-
-
What are the key growth drivers and market challenges?
-
Growing interest in sports and fitness activities, Presence of counterfeit protein products
-
-
Who are the major players in the Protein Supplements Market?
-
Abbott Laboratories, Amway Corp., BioTech USA Korlatolt Felelossegu Tarsasag, Darling Ingredients Inc., Gelita AG, Glanbia plc, GlaxoSmithKline Plc, Herbalife International of America Inc., Iovate Health Sciences International Inc., Makers Nutrition LLC, Meiji Holdings Co. Ltd., Nestle SA, NOW Health Group Inc., PepsiCo Inc., Post Holdings Inc., Purus Labs, THG Plc, Transparent Labs, Vitaco Ltd., and Weider Global Nutrition LLC
-
Market Research Insights
- The market encompasses a diverse range of products designed to support various health and performance goals. According to industry estimates, global sales reached USD50 billion in 2020, with a projected compound annual growth rate of 5.3% from 2021 to 2028. Two key areas of focus within this market are sports nutrition and preventative health. In sports nutrition, protein intake recommendations for athletes range from 1.2 to 2.0 grams per kilogram of body weight daily. High-quality protein supplements, such as those undergoing rigorous quality control testing, play a crucial role in muscle growth stimulation and recovery.
- In contrast, preventative health applications, like sarcopenia prevention and bone mineral density support, require a different protein profile. Here, slow-release, low glycemic index protein powders are favored for their ability to promote nitrogen retention and collagen synthesis. Regardless of application, safety and regulatory compliance are paramount. Protein supplements must adhere to stringent food safety standards and undergo amino acid sequencing to ensure purity and efficacy. Additionally, ingredient labeling and health claims substantiation are essential for consumer trust and transparency. By addressing these needs, the market continues to evolve, offering innovative solutions for both sports performance and overall health.
We can help! Our analysts can customize this protein supplements market research report to meet your requirements.
 RIA -
RIA - 
