
Steam Traps Market Size 2026-2030
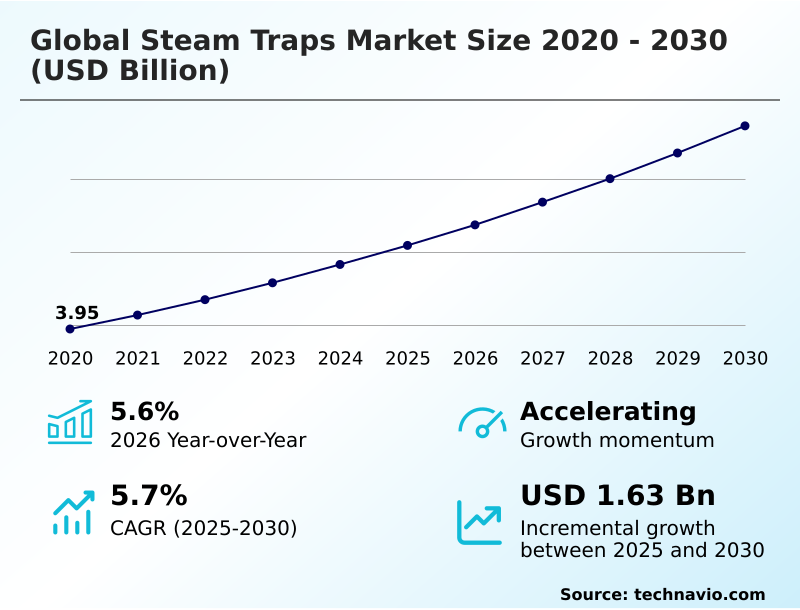
The steam traps market size is valued to increase by USD 1.63 billion, at a CAGR of 5.7% from 2025 to 2030. Accelerated adoption of industrial internet of things and wireless monitoring solutions will drive the steam traps market.
Major Market Trends & Insights
- APAC dominated the market and accounted for a 34.4% growth during the forecast period.
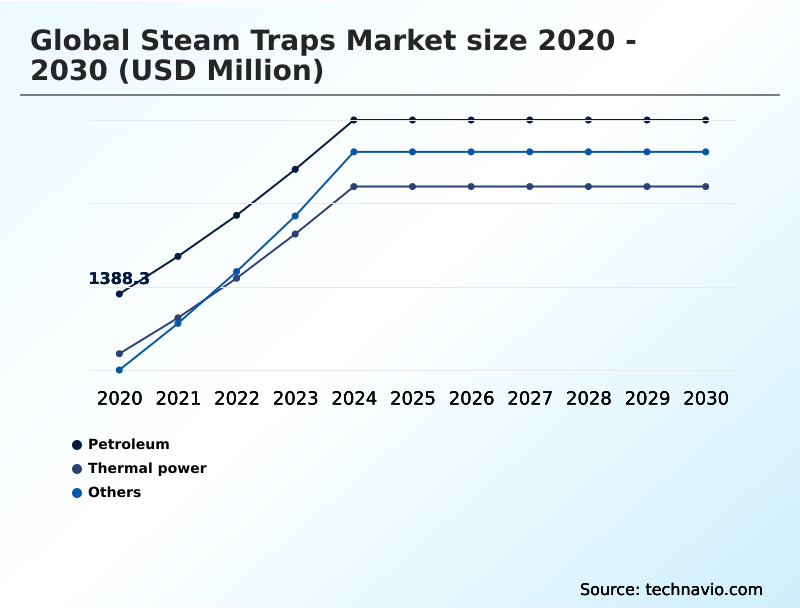
- By End-user - Petroleum segment was valued at USD 1.66 billion in 2024
- By Material - Steel segment accounted for the largest market revenue share in 2024
Market Size & Forecast
- Market Opportunities: USD 2.77 billion
- Market Future Opportunities: USD 1.63 billion
- CAGR from 2025 to 2030 : 5.7%
Market Summary
- The steam traps market is evolving from a focus on simple mechanical components to integrated systems crucial for industrial sustainability and operational excellence. Growth is driven by the urgent need for enhanced industrial energy efficiency and compliance with global carbon emission reduction targets.
- A key trend is the adoption of smart technologies, where predictive maintenance algorithms analyze data from wireless sensors to preemptively address trap failures, ensuring process temperature control is maintained and preventing costly downtime. Challenges persist, however, as the substantial capital investment required for modernization and a widening skilled labor shortage hinder widespread adoption.
- For instance, a chemical processing plant may defer a full-scale upgrade of its condensate return system due to upfront costs, despite long-term ROI projections showing significant energy savings. This dynamic creates a market where success depends on balancing innovation with practical financial and human resource constraints, pushing vendors to offer solutions that provide clear, immediate value in thermal energy management.
What will be the Size of the Steam Traps Market during the forecast period?
Get Key Insights on Market Forecast (PDF) Get Free Sample
How is the Steam Traps Market Segmented?
The steam traps industry research report provides comprehensive data (region-wise segment analysis), with forecasts and estimates in "USD million" for the period 2026-2030, as well as historical data from 2020-2024 for the following segments.
- End-user
- Petroleum
- Thermal power
- Others
- Material
- Steel
- Iron
- Product
- Mechanical
- Thermostatic
- Thermodynamic
- Geography
- APAC
- China
- Japan
- India
- Europe
- Germany
- UK
- France
- North America
- US
- Canada
- Mexico
- Middle East and Africa
- Saudi Arabia
- UAE
- South Africa
- South America
- Brazil
- Argentina
- Rest of World (ROW)
- APAC
By End-user Insights
The petroleum segment is estimated to witness significant growth during the forecast period.
The petroleum sector requires robust solutions for its high pressure steam system environments, prioritizing hardware that ensures plant safety enhancement and industrial process optimization.
The focus is on specialized traps, often with a forged steel body, designed for superior water hammer mitigation and thermal shock resistance. Effective condensate removal efficiency is critical for maintaining precise process temperature control in refining operations.
The adoption of advanced diagnostics, which can achieve ninety-nine percent accuracy in failure detection, supports stringent fugitive emission control targets. While capital expenditure justification remains a consideration, the need for reliable performance and steam loss prevention drives investment.
Proper steam trap sizing and maximizing condensate discharge capacity are essential for system integrity.
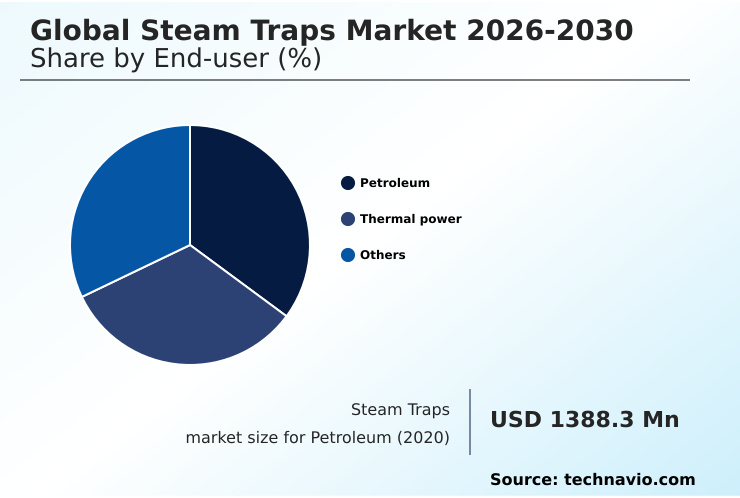
The Petroleum segment was valued at USD 1.66 billion in 2024 and showed a gradual increase during the forecast period.
Regional Analysis
APAC is estimated to contribute 34.4% to the growth of the global market during the forecast period.Technavio’s analysts have elaborately explained the regional trends and drivers that shape the market during the forecast period.
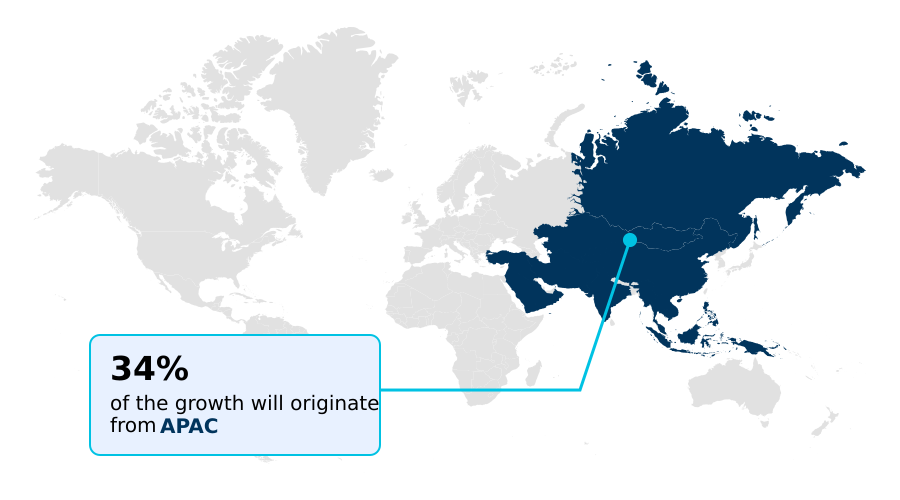
See How Steam Traps Market Demand is Rising in APAC Get Free Sample
The geographic landscape is diverse, with North America poised for expansion at a rate approximately 20% faster than Europe, driven by industrial modernization.
In APAC, rapid industrialization fuels demand for traps based on the thermodynamic disc principle and inverted bucket trap mechanism. European markets, focused on decarbonization, are upgrading to high-efficiency hardware and implementing closed-loop energy system designs.
Demand for sanitary steam trap solutions with advanced air venting capability is high in pharmaceutical hubs. Regions developing supercritical steam process and ultra-supercritical process power generation require specialized traps made from chrome-moly steel alloy.
Proper steam trap sizing and installation of complete steam trap station units are critical for optimizing process heat exchanger performance and conducting effective trap failure analysis globally.
Market Dynamics
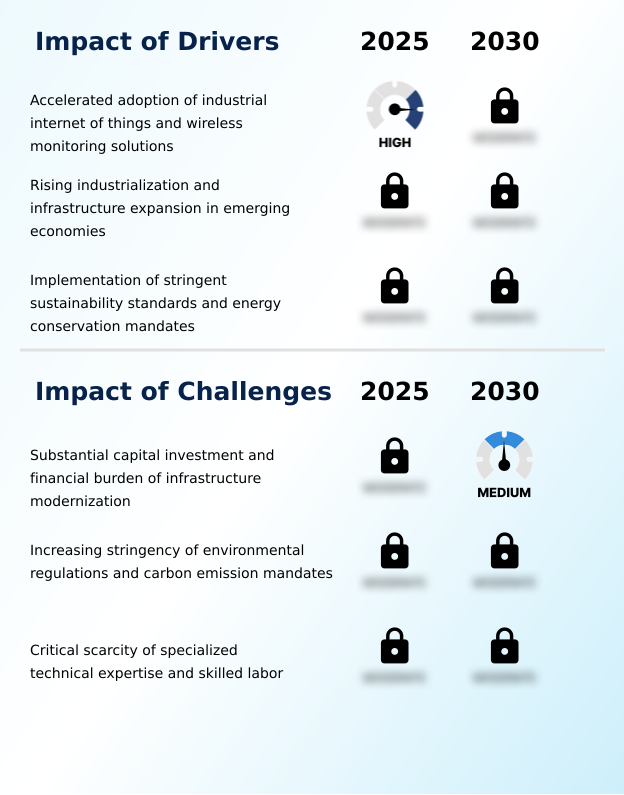
Our researchers analyzed the data with 2025 as the base year, along with the key drivers, trends, and challenges. A holistic analysis of drivers will help companies refine their marketing strategies to gain a competitive advantage.
- Strategic decision-making in the steam traps market now hinges on detailed operational analysis. A core debate involves comparing thermostatic vs mechanical steam trap efficiency for specific plant conditions, where the outcome directly impacts energy consumption. For facilities with high pressure steam trap applications, such as power generation or refining, the selection criteria are rigorous.
- The business case for steam trap monitoring for energy savings is increasingly compelling, as continuous data analysis helps to diagnose steam trap leakage issues before they escalate. Integrating condensate recovery pump integration benefits into system design is also crucial for maximizing thermal cycles. The role of steam traps in decarbonization is a boardroom-level topic, directly linked to corporate sustainability goals.
- The financial impact of trap failure on production can be severe, making a cost-benefit analysis of smart steam traps a standard procedure for capital planning. Organizations are adopting steam trap maintenance best practices to prevent water hammer in steam systems and ensure longevity.
- Specialized knowledge, such as the correct steam trap selection for petrochemical industry, using a thermodynamic trap for outdoor installations, or specifying sanitary steam traps for pharmaceutical use, is in high demand. Moreover, modular steam trap design advantages are influencing plant layouts, while improving thermal efficiency with steam traps remains a primary objective of all steam system audits for energy reduction.
- Expertise in areas like bimetallic vs thermostatic trap performance, addressing challenges in retrofitting old steam systems, and steam trap sizing for variable loads sets leading industrial operators apart, with some achieving up to 10% greater steam efficiency than those using outdated methods.
What are the key market drivers leading to the rise in the adoption of Steam Traps Industry?
- The accelerated adoption of the Industrial Internet of Things and advanced wireless monitoring solutions serves as a primary driver propelling market growth.
- A key driver is the push for industrial energy efficiency, enforced by stringent energy conservation mandates aimed at carbon emission reduction.
- The industrial internet of things enables a centralized control room to oversee entire steam networks, improving the return on investment for new hardware.
- This digital oversight, combined with regular steam system audits, improves operational uptime by over 20% in some cases. Innovations in modular trap design and components featuring advanced bimetallic strip operation help overcome supply chain bottlenecks during large-scale upgrades.
- Furthermore, optimizing condensate return systems and flash steam recovery directly addresses these sustainability goals, making efficient thermal management a core business strategy.
What are the market trends shaping the Steam Traps Industry?
- The integration of artificial intelligence and machine learning algorithms for predictive maintenance is an increasingly significant market trend. This shift enables proactive failure detection and optimizes steam system performance through data analysis.
- A dominant trend is the smart factory integration of steam trap monitoring technologies, driven by the integration of AI and ML and sophisticated predictive maintenance algorithms. This transition to an automated diagnostic system enables real-time performance tracking, allowing facilities to move toward a preventive maintenance strategy that significantly lowers the total cost of ownership.
- For instance, some facilities have reduced energy waste by 15% within the first quarter of implementation. In sectors requiring a clean steam system, this precision is vital for steam quality management. Even systems using traditional cast iron body traps are being retrofitted. This focus on data-driven efficiency is crucial for industrial decarbonization efforts and optimizing heat recovery system performance.
What challenges does the Steam Traps Industry face during its growth?
- A key challenge restraining industry growth is the substantial capital investment and financial burden associated with modernizing aging infrastructure.
- A primary challenge is the skilled labor shortage, as maintaining systems with superheated steam compatibility or unique low pressure steam applications requires deep expertise. Modernizing with wireless acoustic sensors and ultrasonic leakage detectors requires technicians proficient in both mechanical repair and asset management software, exacerbating the issue.
- Proper steam locking prevention and condensate backup prevention depend on correct installation, which is compromised by a lack of trained personnel. Even with durable stainless steel construction, improper maintenance can negate the benefits of a favorable life-cycle cost analysis.
- Achieving regulatory compliance becomes difficult when systems fail to manage back pressure tolerance or optimize sub-cooled condensate discharge, creating significant operational risks.
Exclusive Technavio Analysis on Customer Landscape
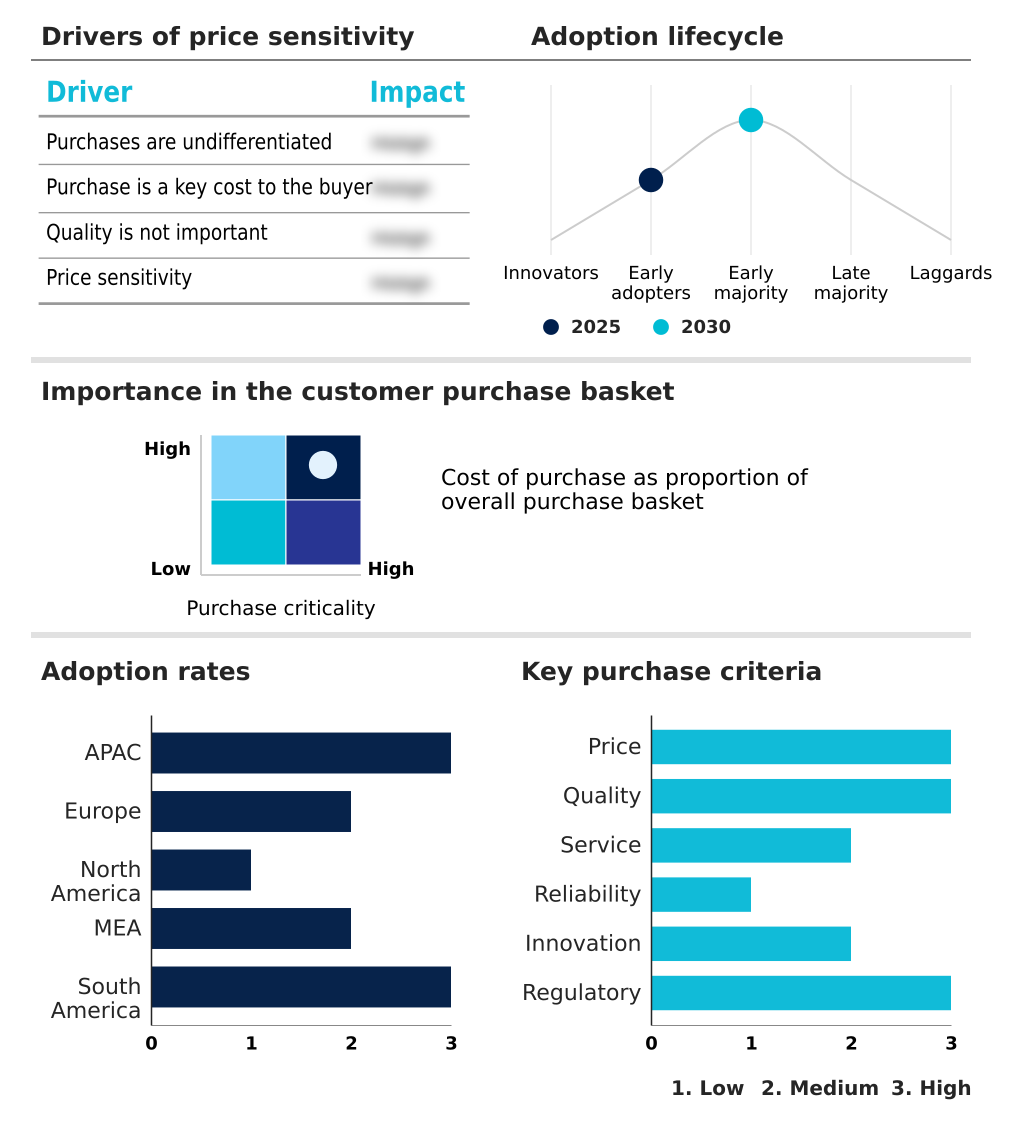
The steam traps market forecasting report includes the adoption lifecycle of the market, covering from the innovator’s stage to the laggard’s stage. It focuses on adoption rates in different regions based on penetration. Furthermore, the steam traps market report also includes key purchase criteria and drivers of price sensitivity to help companies evaluate and develop their market growth analysis strategies.
Customer Landscape of Steam Traps Industry
Competitive Landscape
Companies are implementing various strategies, such as strategic alliances, steam traps market forecast, partnerships, mergers and acquisitions, geographical expansion, and product/service launches, to enhance their presence in the industry.
Armstrong International Inc. - Offerings center on intelligent instrumentation and final control solutions, integrating software and analytics to measure and optimize industrial processes for maximum performance and asset reliability.
The industry research and growth report includes detailed analyses of the competitive landscape of the market and information about key companies, including:
- Armstrong International Inc.
- Ayvaz
- Clark Reliance
- Emerson Electric Co.
- Flowserve Corp.
- Forbes Marshall Pvt. Ltd.
- MIYAWAKI Inc.
- Newton Fluid Technology Co. Ltd
- Parker Hannifin Corp.
- Pennant Engineering Co Inc
- Richards Industrials
- Spirax Sarco Ltd
- Thermax Ltd.
- TLV Co. Ltd.
- Tunstall Corporation
- Uni Klinger Ltd.
- Velan Inc.
- Watson McDaniel Co.
- Watts Water Technologies Inc.
- Yoshitake Inc
Qualitative and quantitative analysis of companies has been conducted to help clients understand the wider business environment as well as the strengths and weaknesses of key industry players. Data is qualitatively analyzed to categorize companies as pure play, category-focused, industry-focused, and diversified; it is quantitatively analyzed to categorize companies as dominant, leading, strong, tentative, and weak.
Recent Development and News in Steam traps market
- In May, 2025, Emerson Electric Co. partnered with AbbVie to deploy wireless steam trap monitoring solutions, aiming to identify steam leaks in real time and reduce carbon emissions across its facilities.
- In March, 2025, Armstrong International introduced its enhanced SteamEye 24/7 monitoring technology, providing automated analytics and wireless detection of trap failures to support long-term sustainability goals.
- In March, 2025, Emerson Electric Co. unveiled a suite of wireless acoustic transmitters designed for the petrochemical sector to detect steam trap failures with up to ninety-nine percent accuracy.
- In February, 2025, Honeywell International faced resistance in a proposal to modernize thermal management systems for a major textile manufacturing cluster due to the high capital investment required for advanced monitoring technology.
Dive into Technavio’s robust research methodology, blending expert interviews, extensive data synthesis, and validated models for unparalleled Steam Traps Market insights. See full methodology.
| Market Scope | |
|---|---|
| Page number | 291 |
| Base year | 2025 |
| Historic period | 2020-2024 |
| Forecast period | 2026-2030 |
| Growth momentum & CAGR | Accelerate at a CAGR of 5.7% |
| Market growth 2026-2030 | USD 1628.9 million |
| Market structure | Fragmented |
| YoY growth 2025-2026(%) | 5.6% |
| Key countries | China, Japan, India, South Korea, Australia, Indonesia, Germany, UK, France, Italy, Spain, Russia, US, Canada, Mexico, Saudi Arabia, UAE, South Africa, Nigeria, Egypt, Brazil, Argentina and Chile |
| Competitive landscape | Leading Companies, Market Positioning of Companies, Competitive Strategies, and Industry Risks |
Research Analyst Overview
- The market is defined by a transition toward intelligent thermal energy management, where a steam system audit now includes advanced predictive maintenance algorithms. Hardware is evolving, with float and thermostatic design and the classic inverted bucket trap mechanism being enhanced with digital capabilities.
- The adoption of wireless acoustic sensor technology and ultrasonic leakage detector systems enables real-time performance tracking for immediate fault detection. This shift supports boardroom decisions on sustainability, as achieving a measurable reduction in thermal waste is now a key performance indicator. In process industries, maintaining precise process temperature control and preventing condensate backup are critical.
- This requires high-performance traps—from sanitary steam trap models for clean steam system applications to those with a forged steel body or stainless steel construction for durability. The focus is on maximizing condensate removal efficiency and steam loss prevention, from the steam main drip leg to the process heat exchanger, to drive industrial energy efficiency and support carbon emission reduction goals.
What are the Key Data Covered in this Steam Traps Market Research and Growth Report?
-
What is the expected growth of the Steam Traps Market between 2026 and 2030?
-
USD 1.63 billion, at a CAGR of 5.7%
-
-
What segmentation does the market report cover?
-
The report is segmented by End-user (Petroleum, Thermal power, and Others), Material (Steel, and Iron), Product (Mechanical, Thermostatic, and Thermodynamic) and Geography (APAC, Europe, North America, Middle East and Africa, South America)
-
-
Which regions are analyzed in the report?
-
APAC, Europe, North America, Middle East and Africa and South America
-
-
What are the key growth drivers and market challenges?
-
Accelerated adoption of industrial internet of things and wireless monitoring solutions, Substantial capital investment and financial burden of infrastructure modernization
-
-
Who are the major players in the Steam Traps Market?
-
Armstrong International Inc., Ayvaz, Clark Reliance, Emerson Electric Co., Flowserve Corp., Forbes Marshall Pvt. Ltd., MIYAWAKI Inc., Newton Fluid Technology Co. Ltd, Parker Hannifin Corp., Pennant Engineering Co Inc, Richards Industrials, Spirax Sarco Ltd, Thermax Ltd., TLV Co. Ltd., Tunstall Corporation, Uni Klinger Ltd., Velan Inc., Watson McDaniel Co., Watts Water Technologies Inc. and Yoshitake Inc
-
Market Research Insights
- The market's dynamics are shaped by a strategic shift toward holistic thermal utility system management, where life-cycle cost analysis now outweighs initial procurement price. The integration of the industrial internet of things allows for remote performance monitoring, with some systems achieving 99% accuracy in failure detection.
- This focus on preventive maintenance strategy and operational uptime improvement has led to documented energy waste reductions of 15% in certain applications. As organizations pursue industrial decarbonization, optimizing heat recovery systems and ensuring regulatory compliance become paramount.
- This requires careful capital expenditure justification for advanced hardware, as the long-term return on investment through improved efficiency and safety is increasingly clear to decision-makers.
We can help! Our analysts can customize this steam traps market research report to meet your requirements.
 RIA -
RIA - 
