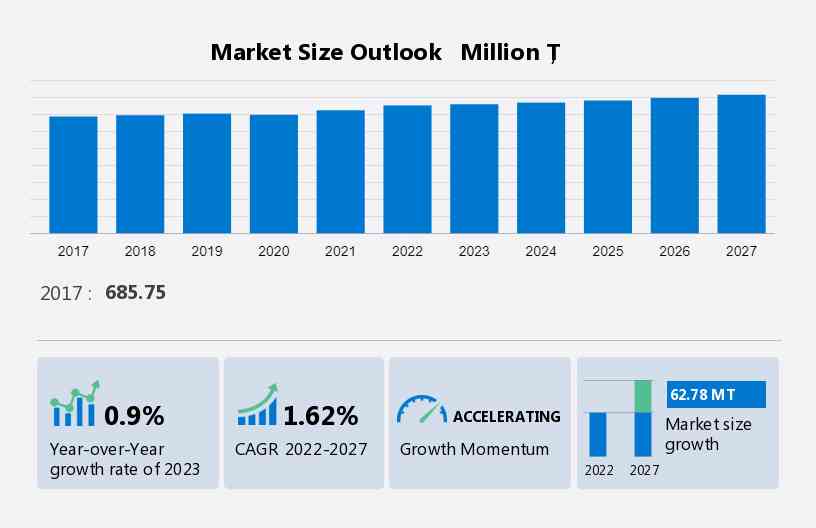
Steel Scrap Market Size 2023-2027
The steel scrap market size is forecast to increase by 62.78 million T, at a CAGR of 1.62% between 2022 and 2027. Market expansion is driven by various factors, notably the rising utilization of steel scrap, the robust demand for steel in industrial sectors, and the growing needs within the construction industry. However, this growth trajectory encounters obstacles such as the intricacies involved in sorting steel scrap and the prevalence of impurities within it. Additionally, the presence of substitute materials poses a threat, while fluctuations in the demand and pricing for stainless steel further add to market uncertainty. Overcoming these challenges necessitates innovative approaches to streamline scrap sorting processes and mitigate impurity concerns. Moreover, strategies to address the threat of substitutes and navigate through market volatility are crucial for sustained growth. By proactively managing these factors, the steel industry can capitalize on opportunities and reinforce its position amidst evolving market dynamics.
What will be the Size of the Market During the Forecast Period?
To learn more about this market report, Request Free Sample
Market Definition
Steel scraps are discarded steel or steel products that are suitable for melting, generally segregated by composition and size or 'grade'. These are recycled and used to make crude steel.
Market Segmentation
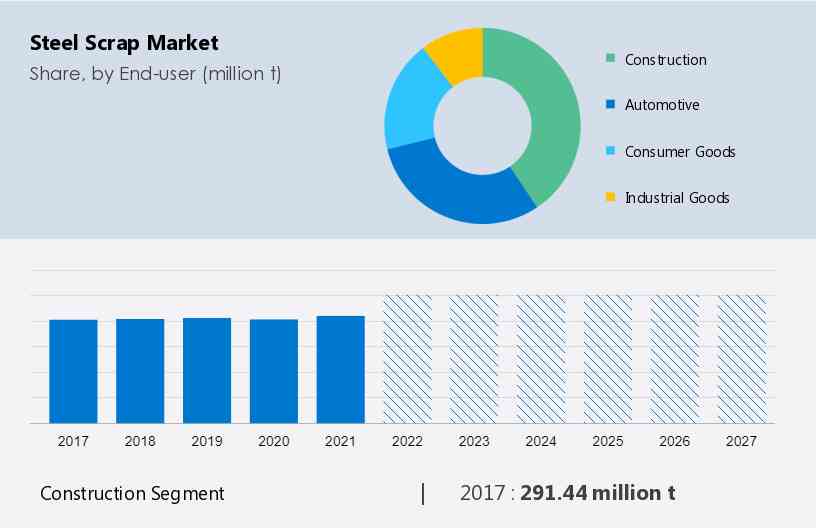
End-User Insights
The market share growth by the construction segment will be significant during the forecast period. The construction industry is a major contributor to the growth of the global market. The construction of high-rise buildings, tech parks, roads, highways, and bridges globally drives the demand for steel manufacturing. Owing to its high strength and ductility, steel is extensively used in the construction industry. It is typically used in the manufacturing of beams for structural frameworks, rectangular tubing for welded frames, and high-strength plates for highways and bridges. It is also used in manufacturing rebars and hollow structural sections.
Get a glance at the market contribution of various segments. View the PDF Sample
The construction segment showed a gradual increase in the market share with 291.44 million tons in 2017 and continued to grow by 2021. Moreover, steel is used in handrails, culverts, columns, pilings, fences, caissons, and sign poles. Durability, strength, economical nature, and suitability to long-term exposure to different kinds of weather increase the demand for steel in the construction sector. Moreover, the growing use of steel that is recovered used in construction equipment significantly increases the demand and, in turn, will drive the growth of the market during the forecast period.
Regional Analysis
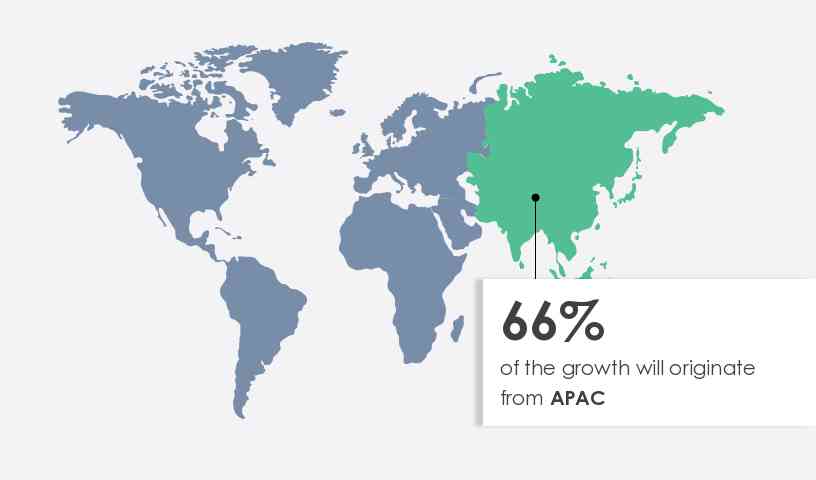
APAC is estimated to contribute 66% to the growth of the global market during the forecast period. Technavio's analysts have elaborately explained the regional trends and drivers that shape the market during the forecast period.
For more insights on the market share of various regions, Download PDF Sample now!
The regional market is poised for significant growth due to the increasing adoption of carbon steel, particularly using steel scrap. Notable contributions come from India and China. JSW Steel's USD 1.26 billion partnership with Germany's SMS group aims to cut emissions by 42% by 2030 through greater utilization. Key players like Tata Steel are also driving growth in the Asia-Pacific (APAC) region. Tata Steel's Steel Recycling Business introduced FerroHaat, a mobile app, to streamline India's market. In APAC, the demand for steel is rising steadily, driven by industrialization and infrastructure projects in countries like Indonesia, South Korea, and India. Government initiatives, like India's increased imports in H1 2022, will further boost steel and steel scrap demand in the region. Consequently, the growth of steel production from scrap will be a significant driver in the regional market during the forecast period.
Market Dynamics
The steel industry is undergoing a paradigm shift towards sustainability, with a focus on emission-based sectoral arrangements and carbon emissions reduction. Production of steel, whether through blast furnaces or electric arc furnaces (EAF), is increasingly emphasizing energy efficiency and the use of recycled steel. Major players like JSW Steel are investing in sustainable practices to reduce greenhouse gas emissions. Construction projects, including the Twin Towers of Supertech and the development of recycling parks like the one in Binzhou, China, are adopting sustainable materials such as beams, reinforcement bars, and structural parts. Initiatives like the Scholz Joint Venture and the circular economy approach are driving the steel industry towards a sustainable economy, ensuring the longevity of resources and promoting sustainable development for future generations.
Key Market Driver
The primary driver of global market growth is the expanding range of applications for steel scrap. Worldwide, there is a growing trend toward utilizing recycled steel scrap to mitigate carbon emissions. Recycling enhances the economic sustainability of the steel industry and curtails its environmental impact by reducing the reliance on iron ore extraction for steel manufacturing. This substantial reduction in CO2 emissions, along with decreased energy and water consumption and reduced air pollution, is noteworthy.
Further, each metric ton of scrap steel saves an average of 2.9 metric tons of CO2, rendering it a favored raw material among steel producers. It can be employed independently or in conjunction with other raw materials like iron ore for steel production. The demand is heavily influenced by the fluctuating prices of iron ore. Consequently, manufacturers are increasingly turning to it as a primary raw material to cut overall production costs. Therefore, the growing utilization for manufacturing steel products is poised to fuel market growth in the forecast period.
Significant Market Trend
The increase in M&A activities will fuel global market growth. The growing focus on producing steel has been leading companies to adopt strategies to gain competitive advantages in the market. For instance, In September 2022, Commercial Metals Co. acquired Advanced Steel Recovery, LLC (ASR), a leading supplier of recycled ferrous metals located in Southern California, as part of its strategic expansion in the Western US. ASR handles approximately 300,000 tons of scrap, annually across its processing, brokerage platforms, and industrial collection points.
Additionally, in March 2022, ArcelorMittal acquired John Lawrie Metals Ltd., a Scottish recycling business. It is a part of the company's strategy to increase the use of scrap steel and lower CO2 emissions in steelmaking. Thus, the increasing M&A activities will drive the growth of the market to focus during the forecast period.
Major Market Challenge
The complexities in sorting and the presence of impurities are major challenges to the global market growth. The recycling involves the sorting of steel from other products, including waste materials, which must be then melted and cleaned. The sorting process is not only time-consuming but also expensive. The process of recycling creates or leads to impurities in the product. The purification of the metal requires the use of new and advanced technologies. Although the process of recycling consumes low energy, it still uses energy and is expensive at times.
Moreover, in this growing digital age, the complexity of various modern products that provide steel scrap, such as end-of-life vehicles (ELVs), makes recycling more complicated than it used to be. The quality is a limiting factor for the increased use due to the presence of impurities in it. A lower quality lowers the yield and thus requires higher energy per ton of desired output. Thus, the above-mentioned factors will negatively impact the growth of the market in focus during the forecast period.
Customer Landscape
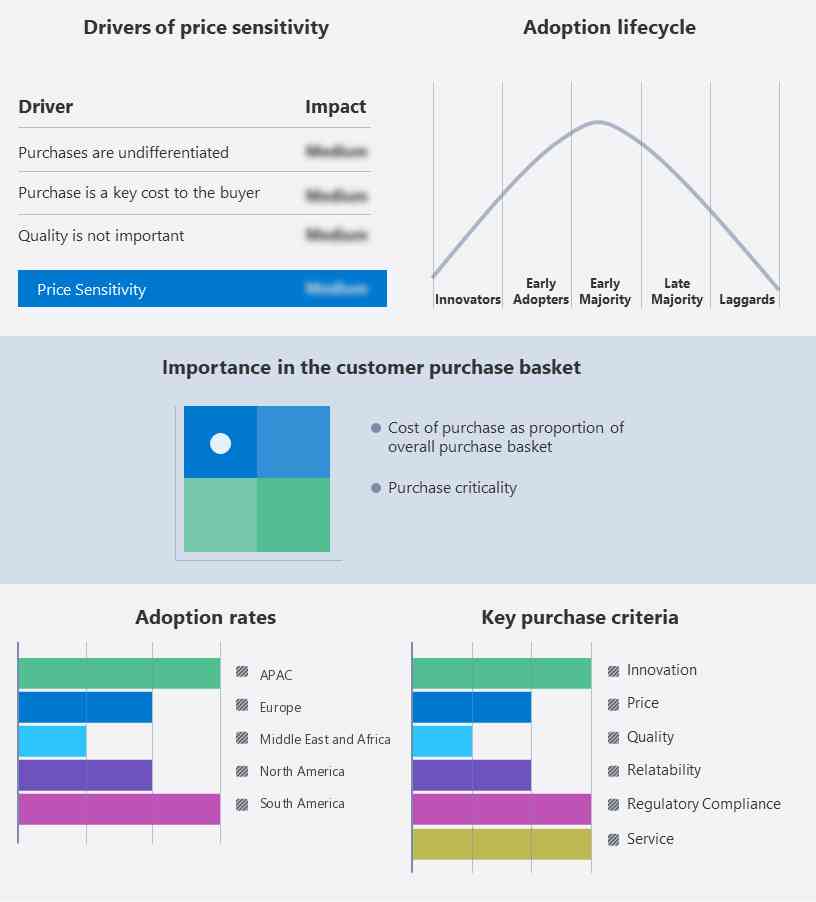
The market research report includes the adoption lifecycle of the market, covering from the innovator's stage to the laggard's stage. It focuses on adoption rates in different regions based on penetration. Furthermore, the report also includes key purchase criteria and drivers of price sensitivity to help companies evaluate and develop their growth strategies.
Market Customer Landscape
Who are the Major Market Companies?
Companies are implementing various strategies, such as strategic alliances, partnerships, mergers and acquisitions, geographical expansion, and product/service launches, to enhance their presence in the market.
Evraz Plc - The company offers baby carrier such as beco gemini, beco 8 and beco toddler.
The research report also includes detailed analyses of the competitive landscape of the market and information about 15 market companies, including:
Ansteel Group Corp. Ltd., ArcelorMittal SA, Baosteel Group Corp., Benxi Steel Group Co. Ltd., China Baowu Steel Group Corp., Commercial Metals Co., EVRAZ Plc, Gerdau SA, JSW STEEL Ltd., Metalico Inc., Metinvest B.V, Nippon Steel Corp., Nucor Corp., Oryx Stainless AG, Schnitzer Steel Industries Inc., Sims Ltd., Steel and Scrap Pvt. Ltd., Steel Dynamics Inc., Tata Steel Ltd., and United States Steel Corp.
Qualitative and quantitative analysis of companies has been conducted to help clients understand the wider business environment as well as the strengths and weaknesses of key market players. Data is qualitatively analyzed to categorize companies as pure play, category-focused, industry-focused, and diversified; it is quantitatively analyzed to categorize companies as dominant, leading, strong, tentative, and weak.
Market Analyst Overview
The market is experiencing notable growth driven by various factors such as the increasing demand for steel, particularly in industrial applications and the construction sector. Steel manufacturers utilize blast furnaces and electric arc furnaces (EAF) to produce steel, aiming to reduce carbon emissions and improve energy efficiency. Investments in carbon emissions reduction technologies and sustainable practices are prevalent. Recycling operations play a vital role in the sustainable economy, with large-scale collection efforts targeting scrap metals from electronic goods and urbanization-driven waste. This circular economy approach not only preserves natural resources but also reduces emissions, aligning with global environmental concerns and supporting the metal recycling industry's growth and development in regional markets.
Moreover, the market is witnessing dynamic growth, driven by steelmakers' increasing emphasis on emission-based sectoral arrangements to reduce greenhouse gas emissions. With steel and aluminum production entailing significant investment, efforts are made to enhance sustainability through the recycling of materials like reinforcement bars and structural parts, aligning with sustainable development goals. Initiatives and the development of recycling parks in places like Binzhou, China underscore the industry's commitment to sustainable practices. Urbanization in developing economies fuels the rising demand for metals, emphasizing the importance of energy conservation and the preservation of natural resources. Despite market restraints like diminishing availability of natural resources, opportunities abound in the metal recycling industry, particularly in reducing emissions and managing waste generated by the construction phase.
|
Market Scope |
|
|
Report Coverage |
Details |
|
Page number |
176 |
|
Base year |
2022 |
|
Historic period |
2017-2021 |
|
Forecast period |
2023-2027 |
|
Growth momentum & CAGR |
Accelerate at a CAGR of 1.62% |
|
Market growth 2023-2027 |
62.78 MT |
|
Market structure |
Fragmented |
|
YoY growth 2022-2023(%) |
0.9 |
|
Regional analysis |
APAC, Europe, North America, South America, and Middle East and Africa |
|
Performing market contribution |
APAC at 66% |
|
Key countries |
US, China, India, Japan, and Russia |
|
Competitive landscape |
Leading Companies, Market Positioning of Companies, Competitive Strategies, and Industry Risks |
|
Key companies profiled |
Ansteel Group Corp. Ltd., ArcelorMittal SA, Baosteel Group Corp., Benxi Steel Group Co. Ltd., China Baowu Steel Group Corp., Commercial Metals Co., EVRAZ Plc, Gerdau SA, JSW STEEL Ltd., Metalico Inc., Metinvest B.V, Nippon Steel Corp., Nucor Corp., Oryx Stainless AG, Schnitzer Steel Industries Inc., Sims Ltd., Steel and Scrap Pvt. Ltd., Steel Dynamics Inc., Tata Steel Ltd., and United States Steel Corp. |
|
Market dynamics |
Parent market analysis, Market forecasting Market growth inducers and obstacles, Fast-growing and slow-growing segment analysis, COVID-19 impact and recovery analysis and future consumer dynamics, Market condition analysis for the market forecast period |
|
Customization purview |
If our market forecast report has not included the data that you are looking for, you can reach out to our analysts and get segments customized. |
What are the Key Data Covered in this Market Research Report?
- CAGR of the market during the forecast period
- Detailed information on factors that will drive the market growth and forecasting of the market between 2023 and 2027
- Precise estimation of the size of the market size and its contribution to the parent market
- Accurate predictions about upcoming market trends and analysis and changes in consumer behavior
- Growth of the market industry across Europe, North America, APAC, South America, and Middle East and Africa
- Thorough market growth analysis of the market's competitive landscape and detailed information about companies
- Comprehensive market analysis and report on the factors that will challenge the market research and growth of market companies
We can help! Our analysts can customize this market research report to meet your requirements.
 RIA -
RIA - 
