Storage Controller Market Size and Growth Forecast 2026-2030
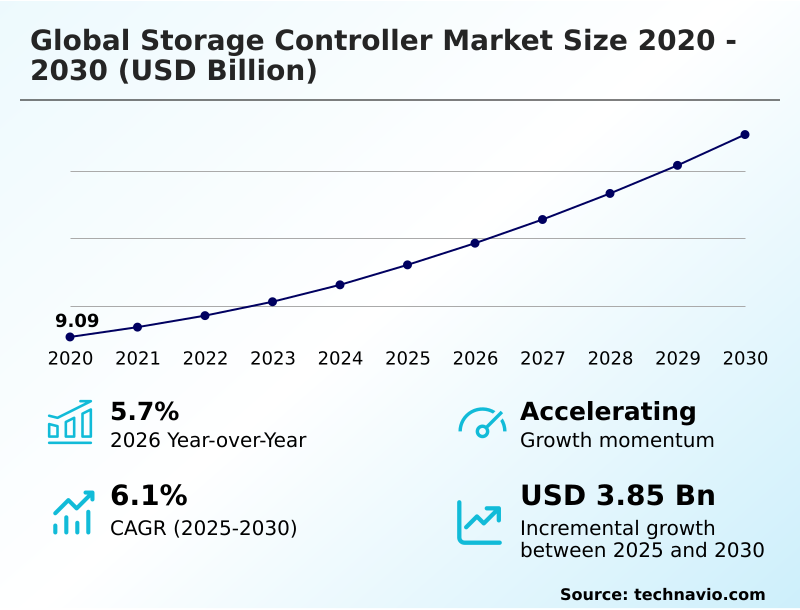
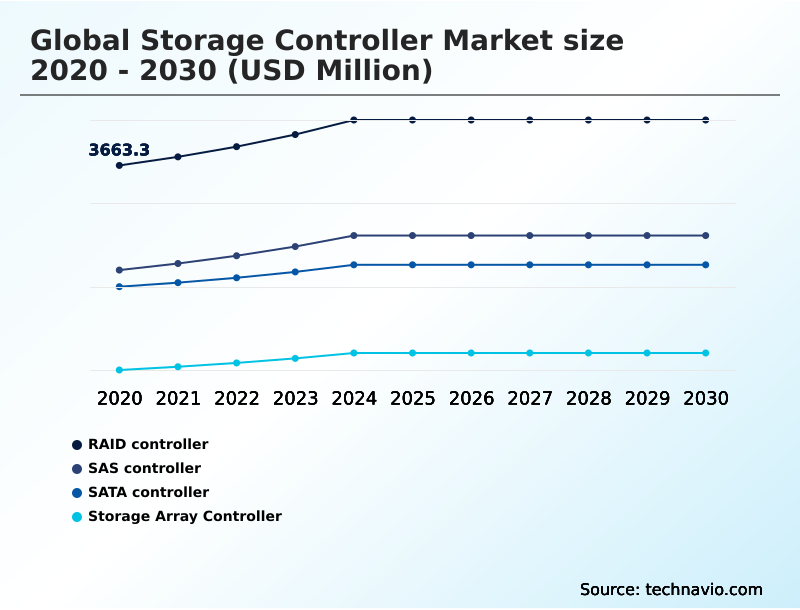
The Storage Controller Market size was valued at USD 11.22 billion in 2025 growing at a CAGR of 6.1% during the forecast period 2026-2030.
APAC accounts for 40.9% of incremental growth during the forecast period. The RAID controller segment by Type was valued at USD 4.25 billion in 2024, while the IT and telecom segment holds the largest revenue share by End-user.
The market is projected to grow by USD 5.98 billion from 2020 to 2030, with USD 3.85 billion of the growth expected during the forecast period of 2025 to 2030.
Get Key Insights on Market Forecast (PDF) Request Free Sample
Storage Controller Market Overview
The storage controller market is undergoing significant evolution, with year-over-year growth accelerating by 5.7%, driven by the relentless expansion of digital data. As organizations adopt hybrid cloud environments, the demand for sophisticated data management and low-latency data access has intensified. A key driver is the proliferation of AI and machine learning workloads, which require high-performance computing infrastructure capable of processing massive datasets without bottlenecks. For instance, a financial services firm deploying NVMe over Fabrics within its data center infrastructure can achieve a significant reduction in transaction processing times, enhancing its algorithmic trading capabilities. This shift necessitates advanced controllers that support server virtualization and robust disaster recovery planning. However, procurement decisions are constrained by the total cost of ownership and challenges related to legacy system compatibility. The market is also shaped by a definitive trend toward software-defined storage, which offers greater flexibility but requires controllers that can orchestrate complex, heterogeneous hardware environments efficiently. Adherence to data sovereignty compliance, such as the stipulations within GDPR, further influences architectural choices, mandating features like hardware-level encryption.
Drivers, Trends, and Challenges in the Storage Controller Market
Strategic decisions for enterprise IT infrastructure now hinge on a granular analysis of storage controller capabilities. The debate over RAID controller vs SAS controller for enterprise servers continues, with procurement teams weighing the trade-offs between cost, reliability, and performance for specific application workloads.
Concurrently, the benefits of NVMe over Fabrics in data centers are becoming undeniable, as organizations seek to eliminate I/O bottlenecks and enable scalable, high-performance computing. This technological shift directly influences the impact of software-defined storage on controller design, demanding more programmable and feature-rich hardware that can manage disaggregated resources.
In parallel, security features of modern storage array controllers are under intense scrutiny, with a focus on mitigating ransomware threats through hardware-based immutability, a critical requirement under data protection regulations like GDPR.
The expanding role of storage controllers in edge computing devices, particularly in industrial IoT settings compliant with standards like ISA/IEC 62443, is creating a new market for ruggedized, low-power solutions.
The market is poised for an incremental growth of nearly 3854.5 million, with a significant portion driven by these advanced applications, which demonstrates a value proposition more than double that of legacy system upgrades.
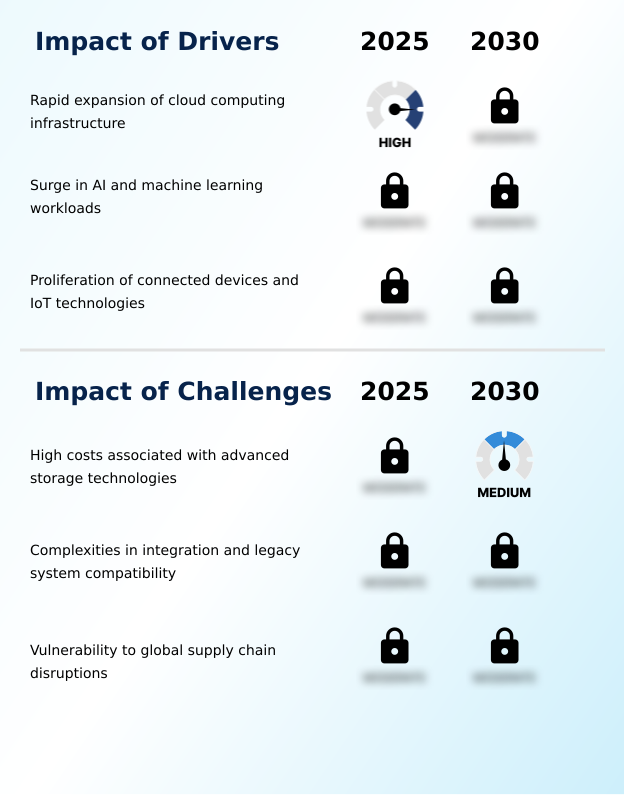
Primary Growth Driver: The rapid expansion of cloud computing infrastructure is a key driver for the storage controller market, fueling demand for advanced data management solutions.
The market's expansion is fundamentally driven by the exponential growth of cloud computing infrastructure and enterprise data centers. As digital transformation accelerates, the sheer volume of data generated necessitates robust enterprise storage solutions capable of high-speed processing.
The surge in AI and machine learning workloads, which are inherently data-intensive, demands storage systems that can provide ultra-low-latency data access and eliminate I/O bottlenecks.
In APAC, which exhibits a regional CAGR of 7.6%, this is particularly evident in investments in smart city initiatives and autonomous vehicle development.
Furthermore, the proliferation of connected devices and IoT data management at the network edge creates a strong demand for specialized, compact, and energy-efficient controllers that can operate in diverse environmental conditions.
Emerging Market Trend: The adoption of Non-Volatile Memory Express and high-speed fabric interfaces represents a significant market trend. This shift is driven by the demand for lower latency and higher throughput in modern data architectures.
A primary trend shaping the market is the accelerated transition from legacy interfaces to Non-Volatile Memory Express (NVMe) and NVMe over Fabrics. This shift is a direct response to the need for data throughput optimization in environments supporting high-performance computing.
Organizations are redesigning their data center infrastructure to leverage the low-latency data access that NVMe provides, which is critical for AI and machine learning workloads. Another significant trend is the heightened emphasis on hardware-level encryption and security.
In response to increasing cybersecurity threats and stringent data sovereignty compliance rules, manufacturers are embedding cryptographic engines and immutable storage features directly into the controller's application-specific integrated circuits, moving beyond software-only solutions.
Key Industry Challenge: The high costs associated with advanced storage technologies present a significant challenge to market growth, particularly for budget-conscious enterprises.
A significant market challenge stems from the high total cost of ownership associated with advanced storage technologies. The initial capital expenditure for next-generation controllers and the necessary supporting infrastructure can be prohibitive for many organizations. This is compounded by system integration complexity, especially when attempting to incorporate modern controllers into environments with legacy system compatibility issues.
Enterprises often face technical friction and performance bottlenecks when pairing new NVMe-based hardware with older server architectures. Another major restraint is the market's vulnerability to supply chain resilience issues. The high concentration of semiconductor fabrication in the APAC region means that geopolitical tensions or logistical disruptions can lead to significant component shortages and price volatility, impacting manufacturers and end-users globally.
Explore Full Market Dynamics Analysis Request Free Sample
Storage Controller Market Segmentation
The storage controller industry research report provides comprehensive data including region-wise segment analysis, with forecasts and analysis for the period 2026-2030, as well as historical data from 2020-2024 for the following segments.
Type Segment Analysis
The raid controller segment is estimated to witness significant growth during the forecast period.
Redundant array of independent disks (RAID) controllers form the largest market segment, managing physical drives as a unified logical volume to enhance data redundancy and improve I/O performance.
Organizations depend on these hardware components for fault tolerance, mitigating data loss from hardware failures through mirroring and striping techniques. The demand for robust enterprise storage solutions is intensifying as data volumes expand.
Hardware-based RAID controllers, featuring dedicated processing, offload intensive parity calculations from the host CPU, a critical function in high-transaction environments.
The evolution of interface technologies has pushed the operational boundaries of these controllers, requiring higher bandwidth and lower latency to support data throughput optimization and ensure system stability in modern data center infrastructure.
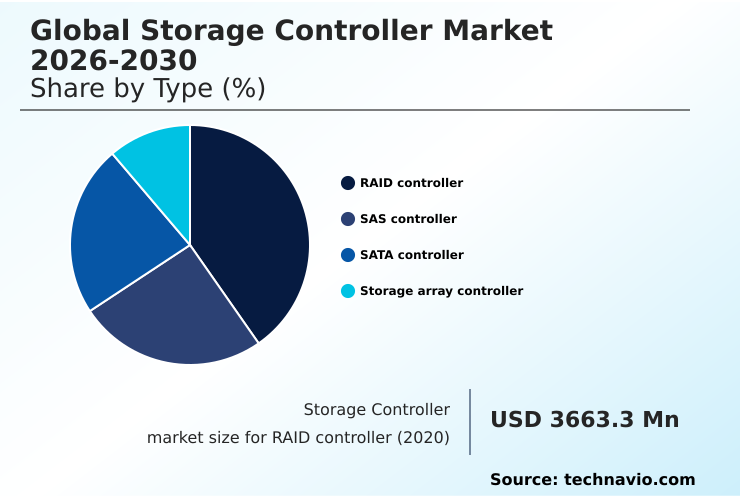
The RAID controller segment was valued at USD 4.25 billion in 2024 and showed a gradual increase during the forecast period.
Storage Controller Market by Region: APAC Leads with 40.9% Growth Share
APAC is estimated to contribute 40.9% to the growth of the global market during the forecast period.
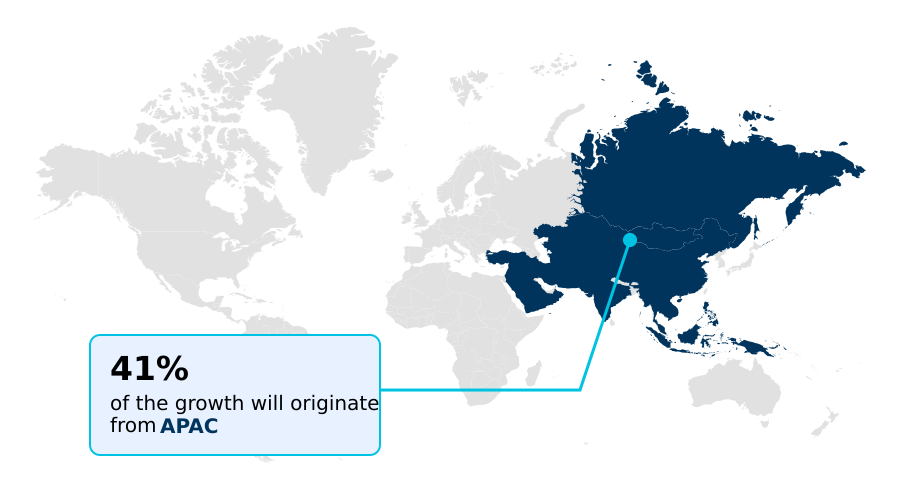
The geographic landscape of the storage controller market is led by the APAC region, which is forecasted to contribute approximately 40.9% of the market's incremental growth.
This expansion is fueled by massive investments in data center infrastructure and the rapid adoption of AI and machine learning workloads across countries like China and India.
Government-led smart city projects and the proliferation of IoT data management also contribute to the demand for advanced controllers. North America remains a dominant market, driven by its high concentration of hyperscale cloud providers and stringent data sovereignty compliance requirements.
In Europe, the focus is on energy-efficient hardware and compliance with regulations such as the GDPR, which influences the design and deployment of enterprise storage solutions.
Customer Landscape Analysis for the Storage Controller Market
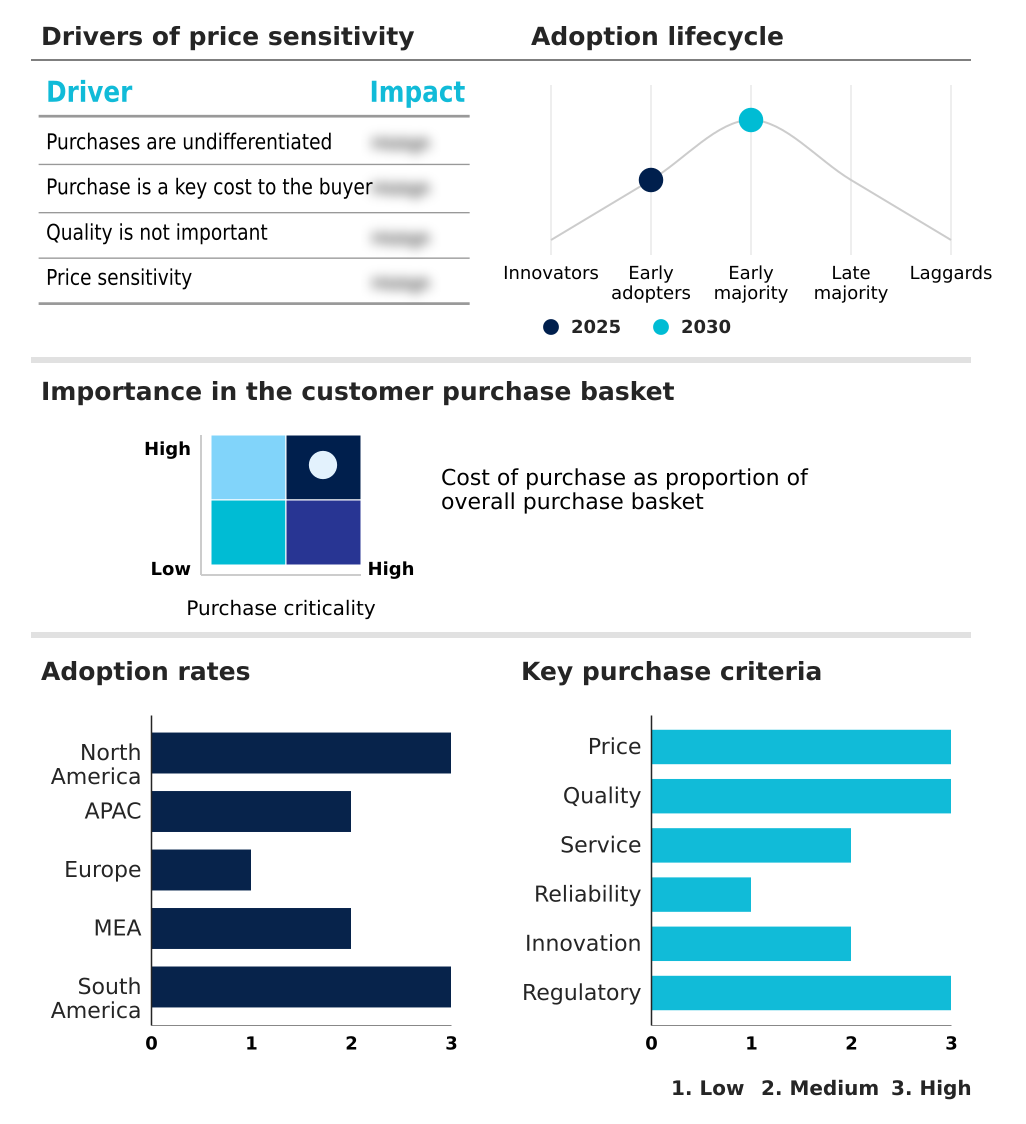
The storage controller market forecasting report includes the adoption lifecycle of the market, covering from the innovator’s stage to the laggard’s stage. It focuses on adoption rates in different regions based on penetration. Furthermore, the storage controller market report also includes key purchase criteria and drivers of price sensitivity to help companies evaluate and develop their market growth analysis strategies.
Competitive Landscape of the Storage Controller Market
Companies are implementing various strategies, such as strategic alliances, partnerships, mergers and acquisitions, geographical expansion, and product/service launches, to enhance their presence in the storage controller market industry.
ATTO Technology Inc. - Analysis of specialized storage connectivity solutions, including ExpressSAS RAID adapters and Celerity Fibre Channel Host Bus Adapters (HBAs), reveals a focus on high-performance data infrastructure.
The industry research and growth report includes detailed analyses of the competitive landscape of the market and information about key companies, including:
- ATTO Technology Inc.
- Broadcom Inc.
- Dell Technologies Inc.
- Hewlett Packard Enterprise Co.
- Hitachi Vantara LLC
- Huawei Technologies Co. Ltd.
- IBM Corp.
- Intel Corp.
- Kioxia Corp.
- Marvell Technology Inc.
- Microchip Technology Inc.
- Micron Technology Inc.
- NetApp Inc.
- Pure Storage Inc.
- Realtek Semiconductor Corp.
- Samsung Electronics Co. Ltd.
- Seagate Technology LLC
- Silicon Motion Technology Corp.
- SK hynix Co. Ltd.
- Western Digital Corp.
Qualitative and quantitative analysis of companies has been conducted to help clients understand the wider business environment as well as the strengths and weaknesses of key industry players. Data is qualitatively analyzed to categorize companies as pure play, category-focused, industry-focused, and diversified; it is quantitatively analyzed to categorize companies as dominant, leading, strong, tentative, and weak.
Recent Developments in the Storage Controller Market
- In August 2024, the NVM Express Organization is expected to finalize the release of the NVMe 2.3 specification, which will introduce enhancements in storage management, high-availability support, and advanced I/O-level encryption options.
- In November 2024, SanDisk is projected to unveil a high-capacity enterprise solid-state drive with a 256 terabyte capacity, featuring a multi-core storage controller designed for managing large-scale QLC flash memory in hyperscale data center environments.
- In March 2025, Kioxia is set to announce the development of a new SSD architecture based on its XL-Flash technology, incorporating a specialized controller optimized for artificial intelligence and low-latency applications.
- In April 2025, Corsair is anticipated to launch its MP700 series of PCIe Gen5 solid-state drives, which will rely on next-generation NVMe controllers to handle the increased bandwidth of the new interface.
Research Analyst Overview: Storage Controller Market
Boardroom-level decisions on IT capital expenditure are increasingly focused on the transition to next-generation data center infrastructure, where the storage controller is a critical component. The choice between a SAS controller for reliability and a SATA controller for cost-effectiveness is now complicated by the superior performance of Non-Volatile Memory Express protocols, which are becoming standard in enterprise solid-state drive deployments.
A modern storage array controller integrates advanced features like data deduplication and hardware-level encryption, which are essential for managing total cost of ownership and meeting data protection mandates like GDPR. In practice, a financial institution deploying a software-defined storage architecture can leverage controllers with built-in fault tolerance and wear leveling algorithms to extend the life of its flash memory assets.
The rise of computational storage, where application-specific integrated circuits on the controller perform data processing, is optimizing AI and machine learning workloads. This technology, alongside RAID-on-Chip solutions and advanced Host Bus Adapters, is also crucial for enabling responsive edge computing, where controllers must operate efficiently outside of traditional climate-controlled environments.
Dive into Technavio’s robust research methodology, blending expert interviews, extensive data synthesis, and validated models for unparalleled Storage Controller Market insights. See full methodology.
| Market Scope | |
|---|---|
| Page number | 316 |
| Base year | 2025 |
| Historic period | 2020-2024 |
| Forecast period | 2026-2030 |
| Growth momentum & CAGR | Accelerate at a CAGR of 6.1% |
| Market growth 2026-2030 | USD 3854.5 million |
| Market structure | Fragmented |
| YoY growth 2025-2026(%) | 5.7% |
| Key countries | US, Canada, Mexico, China, India, Japan, South Korea, Australia, Indonesia, Germany, UK, France, The Netherlands, Italy, Spain, Saudi Arabia, UAE, South Africa, Israel, Turkey, Brazil, Argentina and Colombia |
| Competitive landscape | Leading Companies, Market Positioning of Companies, Competitive Strategies, and Industry Risks |
Storage Controller Market: Key Questions Answered in This Report
-
What is the expected growth of the Storage Controller Market between 2026 and 2030?
-
The Storage Controller Market is expected to grow by USD 3.85 billion during 2026-2030, registering a CAGR of 6.1%. Year-over-year growth in 2026 is estimated at 5.7%%. This acceleration is shaped by rapid expansion of cloud computing infrastructure, which is intensifying demand across multiple end-use verticals covered in the report.
-
-
What segmentation does the market report cover?
-
The report is segmented by Type (RAID controller, SAS controller, SATA controller, and Storage Array Controller), End-user (IT and telecom, Consumer electronics, Automotive, Healthcare, and Others), Application (Data centers, PCs and laptops, Servers, IoT devices, and Gaming consoles) and Geography (North America, APAC, Europe, Middle East and Africa, South America). Among these, the RAID controller segment is estimated to witness significant growth during the forecast period, driven by rising adoption across key application areas. Each segment includes detailed qualitative and quantitative analysis, along with historical data from 2020-2024 and forecasts through 2030 with year-over-year growth rates.
-
-
Which regions are analyzed in the report?
-
The report covers North America, APAC, Europe, Middle East and Africa and South America. APAC is estimated to contribute 40.9% to market growth during the forecast period. Country-level analysis includes US, Canada, Mexico, China, India, Japan, South Korea, Australia, Indonesia, Germany, UK, France, The Netherlands, Italy, Spain, Saudi Arabia, UAE, South Africa, Israel, Turkey, Brazil, Argentina and Colombia, with dedicated market size tables and year-over-year growth for each.
-
-
What are the key growth drivers and market challenges?
-
The primary driver is rapid expansion of cloud computing infrastructure, which is accelerating investment and industry demand. The main challenge is high costs associated with advanced storage technologies, creating operational barriers for key market participants. The report quantifies the impact of each driver and challenge across 2026 and 2030 with comparative analysis.
-
-
Who are the major players in the Storage Controller Market?
-
Key vendors include ATTO Technology Inc., Broadcom Inc., Dell Technologies Inc., Hewlett Packard Enterprise Co., Hitachi Vantara LLC, Huawei Technologies Co. Ltd., IBM Corp., Intel Corp., Kioxia Corp., Marvell Technology Inc., Microchip Technology Inc., Micron Technology Inc., NetApp Inc., Pure Storage Inc., Realtek Semiconductor Corp., Samsung Electronics Co. Ltd., Seagate Technology LLC, Silicon Motion Technology Corp., SK hynix Co. Ltd. and Western Digital Corp.. The report provides qualitative and quantitative analysis categorizing companies as dominant, leading, strong, tentative, and weak based on their market positioning. Company profiles include business segment analysis, SWOT assessment, key offerings, and recent strategic developments.
-
Storage Controller Market Research Insights
Market dynamics are shaped by the critical need for enterprise storage solutions that can manage expanding cloud computing infrastructure and demanding AI and machine learning workloads. Decision-makers are navigating the complexities of hybrid cloud environments and server virtualization, which require advanced data throughput optimization and low-latency data access.
A significant factor influencing procurement is data sovereignty compliance, forcing organizations to balance performance with regulatory adherence. The total cost of ownership remains a primary consideration, creating tension between adopting high-performance computing and managing budgets. This is complicated by challenges in system integration complexity and ensuring legacy system compatibility.
Effective disaster recovery planning is non-negotiable, while the growth of IoT data management and the need for supply chain resilience add further layers to strategic planning.
We can help! Our analysts can customize this storage controller market research report to meet your requirements.
 RIA -
RIA - 
