North America Superabsorbent Polymers Market Size 2024-2028
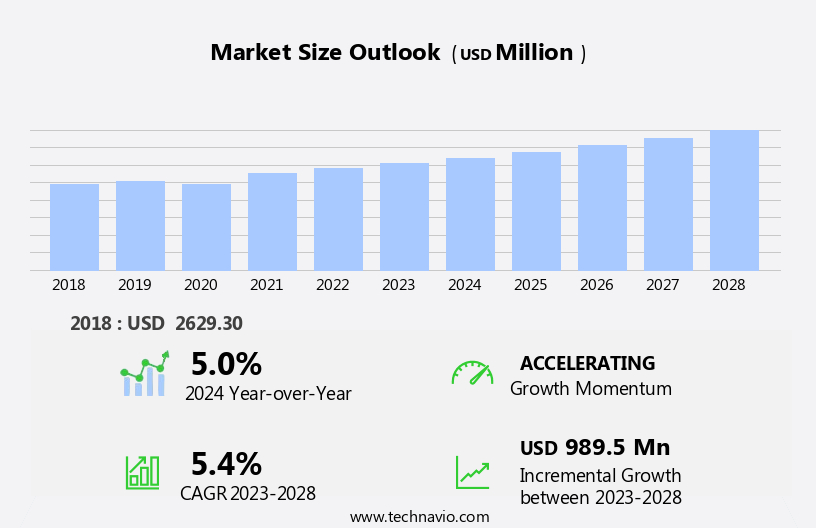
The north america superabsorbent polymers market size is forecast to increase by USD 989.5 million, at a CAGR of 5.4% between 2023 and 2028.
- The Superabsorbent Polymers (SAP) market in North America is experiencing significant growth, driven primarily by the burgeoning demand for baby diapers. This sector's expansion is fueled by increasing birth rates, rising disposable income, and the growing preference for convenient and hygienic diapering solutions. Additionally, the adoption of bio-based SAP is gaining traction due to environmental concerns and shifting consumer preferences towards eco-friendly alternatives. However, the market faces challenges as well. Environmental pollution arising from the production and disposal of SAP remains a pressing concern.
- Regulatory bodies are imposing stringent regulations to mitigate these issues, necessitating investments in sustainable production methods and waste management solutions. Companies must adapt to these changing regulatory landscapes and incorporate eco-friendly practices to maintain their competitive edge and ensure long-term growth.
What will be the size of the North America Superabsorbent Polymers Market during the forecast period?

Explore in-depth regional segment analysis with market size data - historical 2018-2022 and forecasts 2024-2028 - in the full report.
Request Free Sample
- The North American superabsorbent polymers (SAPs) industry outlook remains robust, driven by innovation and technological advancement in SAPs. Sustainable manufacturing practices, such as the use of renewable resources and biocompatible coatings, are gaining traction in the market. Key players are focusing on new product development, particularly in the areas of bio-based superabsorbents and superabsorbent composites, to meet the demands of emerging applications. Crosslinking density and swelling behavior continue to be critical factors in the development of high-performance SAPs. Future market trends include a focus on reducing the environmental footprint of SAPs through life cycle assessment and circular economy principles.
- Technological advancements in polymeric networks and water uptake kinetics are expected to drive growth in the market. SAPs also find applications in drug delivery, release kinetics, and tissue engineering, further expanding their market potential. The regional market analysis indicates that the demand for SAPs is diverse, with significant growth expected in the healthcare and agriculture sectors.
How is this market segmented?
The market research report provides comprehensive data (region-wise segment analysis), with forecasts and estimates in "USD million" for the period 2024-2028, as well as historical data from 2018-2022 for the following segments.
- Application
- Baby diapers
- Adult incontinence products
- Feminine hygiene
- Agriculture
- Others
- Distribution Channel
- Direct Sales
- Distributors
- Online Retail
- Type
- End-User
- Consumer Goods
- Healthcare
- Agriculture
- Industrial
- Geography
- North America
- Europe
- France
- Germany
- Italy
- Spain
- UK
- Middle East and Africa
- APAC
- Australia
- China
- India
- Japan
- South Korea
- South America
- Rest of World (ROW)
By Application Insights
The baby diapers segment is estimated to witness significant growth during the forecast period.
The Superabsorbent Polymers (SAP) market in North America is driven by the significant demand for disposable baby diapers, which is the largest segment in the market. SAP's high liquid retaining capacity makes it an essential material for absorbing liquids in these diapers. The convenience, performance, and affordability of disposable diapers have made them a popular choice for modern parents, particularly in households with two income streams and an increasing awareness of hygiene. SAPs are also used in various end-use industries, including incontinence products, meat packaging, and fluid management. Incontinence products, such as adult diapers and sanitary napkins, utilize SAPs for their water retention and leakage prevention properties.
In the food industry, SAPs are used for food preservation, thickening agents, and moisture control. In agriculture, they are used for soil conditioning, heavy metal removal, and seed germination. The manufacturing process of SAPs involves biopolymer synthesis, which includes the use of raw materials such as sodium polyacrylate, acrylamide monomer, and polyvinyl alcohol. The production process also involves crosslinking polymers to enhance their absorption capacity and swelling ratio. The use of biodegradable polymers and starch-based polymers has gained popularity due to their eco-friendly nature and drought tolerance. The SAP market is subject to price volatility due to fluctuations in raw material sourcing and testing standards.
Regulatory compliance and safety standards are crucial factors in the market, ensuring the quality control of SAPs used in various applications, including baby diapers, feminine hygiene products, and wound dressing. In the food packaging industry, SAPs are used as gelling agents and release agents to enhance the shelf life and freshness retention of perishable items, such as fruits and vegetables. In the environmental sector, SAPs are used for oil spill cleanup and water absorbency in wastewater treatment. The SAP market's future trends include the development of new applications, such as plant growth promotion and heavy metal removal, as well as the use of nanotechnology to improve the rheological properties and particle size distribution of SAPs.
The market's growth is expected to continue due to the increasing demand for convenient and eco-friendly products in various industries.

Download Free Sample Report
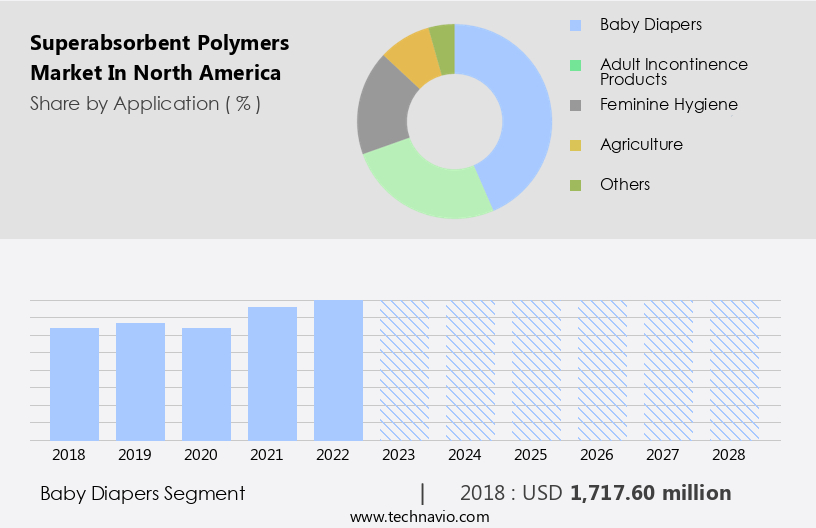
The Baby diapers segment was valued at USD 1717.60 million in 2018 and showed a gradual increase during the forecast period.
Market Dynamics
Our researchers analyzed the data with 2023 as the base year, along with the key drivers, trends, and challenges. A holistic analysis of drivers will help companies refine their marketing strategies to gain a competitive advantage.
What are the North America Superabsorbent Polymers Market drivers leading to the rise in adoption of the Industry?
- The rapid adoption of baby diapers is the primary factor fueling market growth in this region.
- Superabsorbent polymers (SAPs) are essential components in various industries, including food packaging and moisture control. In North America, the market for SAPs is driven by several factors. The demand for SAPs in food packaging is increasing due to their ability to maintain the freshness and prolong the shelf life of perishable goods. These polymers absorb moisture and prevent the growth of microorganisms, ensuring food safety and quality. In the healthcare sector, SAPs are used as thickening agents in pharmaceuticals and as leakage prevention materials in sanitary napkins. The sanitary napkin market is growing due to rising awareness regarding women's health and hygiene.
- SAPs' ability to absorb fluids quickly and efficiently, with a high swelling ratio and excellent gel formation, makes them an ideal choice for this application. Moreover, SAPs have industrial applications, such as oil spill cleanup and seed germination. In oil spill cleanup, SAPs absorb oil and help prevent further environmental damage. In seed germination, they retain moisture and provide a suitable environment for seed growth. The production of SAPs involves the use of monomers like acrylic acid, which undergo polymerization to form the final product. The particle size distribution of SAPs is crucial for their effectiveness, and stringent quality control measures are in place to ensure consistency and regulatory compliance.
- In conclusion, the North American market for superabsorbent polymers is witnessing significant growth due to their diverse applications in various industries. Their ability to absorb moisture, maintain quality, and provide effective leakage prevention makes them indispensable in food packaging, healthcare, and industrial applications.
What are the North America Superabsorbent Polymers Market trends shaping the Industry?
- The adoption of bio-based superabsorbent polymers is an emerging market trend. These eco-friendly alternatives to traditional petroleum-based polymers are gaining popularity due to their sustainability and environmental benefits.
- Superabsorbent polymers (SAPs), a crucial component in various industries such as packaging films, incontinence products, and wastewater treatment, are primarily based on acrylate derivatives. Acrylate-based SAPs, including poly(acrylic acid)s, poly(acrylamide)s, and their salts, exhibit superior absorption capacity. However, their high molecular weight and carbon atom-based structure hinder biodegradability, posing environmental concerns. To mitigate these issues, the market is shifting towards bio-based and degradable SAPs. Biodegradable polymers, such as those derived from renewable resources, offer a viable solution. These polymers, including biopolymers synthesized from polysaccharides, proteins, and lipids, have gained traction due to their eco-friendly nature and equivalent performance to conventional petroleum-derived SAPs.
- Moreover, the use of biodegradable SAPs in packaging films and incontinence products contributes to reducing CO2 emissions throughout the product life cycle. In the manufacturing process, biodegradable SAPs can be synthesized using renewable resources, such as corn starch or sugarcane, instead of non-renewable resources. Additionally, the use of biodegradable SAPs in agriculture enhances drought tolerance, making them a promising solution for sustainable farming practices. Despite the benefits, price volatility and supply chain management challenges persist in the market. The production of biodegradable SAPs involves the use of acrylamide monomer, which is subject to price fluctuations due to its limited availability.
- Effective supply chain management is essential to ensure a consistent and reliable supply of these materials. In conclusion, the demand for bio-based and degradable SAPs is growing due to their eco-friendly properties and equivalent performance to conventional SAPs. The use of these polymers in various industries, including packaging films and incontinence products, offers a sustainable solution to environmental concerns while contributing to reducing CO2 emissions. However, challenges such as price volatility and supply chain management must be addressed to ensure the widespread adoption of these materials.
How does North America Superabsorbent Polymers Market faces challenges face during its growth?
- Environmental pollution poses a significant challenge to the expansion and growth of industries, necessitating the implementation of stringent regulations and sustainable practices to mitigate its adverse effects.
- Superabsorbent polymers, a non-biodegradable material, pose a significant environmental concern as they contribute significantly to landfill waste and take decades to degrade. Their high molecular weight makes them resistant to solubilization by most microorganisms, leading to a prolonged degradation cycle. The environmental impact of superabsorbent polymers is particularly notable in applications such as disposable diapers, which account for over 40% of non-biodegradable waste in the US. Despite these concerns, the superabsorbent polymers market continues to grow due to their unique properties, including high fluid absorption capacity and rheological properties. They find extensive applications in various end-use industries, including fluid management, soil conditioning, heavy metal removal, and food preservation.
- In food preservation, superabsorbent polymers function as gelling agents and release agents. In soil conditioning, they enhance water retention and improve soil structure. In heavy metal removal, they aid in the adsorption and immobilization of heavy metals. Safety standards and polymer characterization are crucial factors in the superabsorbent polymers market. The development of eco-friendly and biodegradable alternatives is also a growing trend, as consumers become increasingly conscious of the environmental impact of their purchases. Starch-based polymers are a promising alternative to traditional superabsorbent polymers, offering similar performance with reduced environmental impact. In conclusion, the superabsorbent polymers market is driven by their unique properties and diverse applications.
- However, the environmental concerns associated with their disposal remain a significant challenge. The development of eco-friendly alternatives and stricter safety standards will help mitigate these concerns and ensure the sustainable growth of the market. Recent research indicates that the market for superabsorbent polymers is expected to continue growing, driven by increasing demand from various end-use industries.
Exclusive North America Superabsorbent Polymers Market Customer Landscape
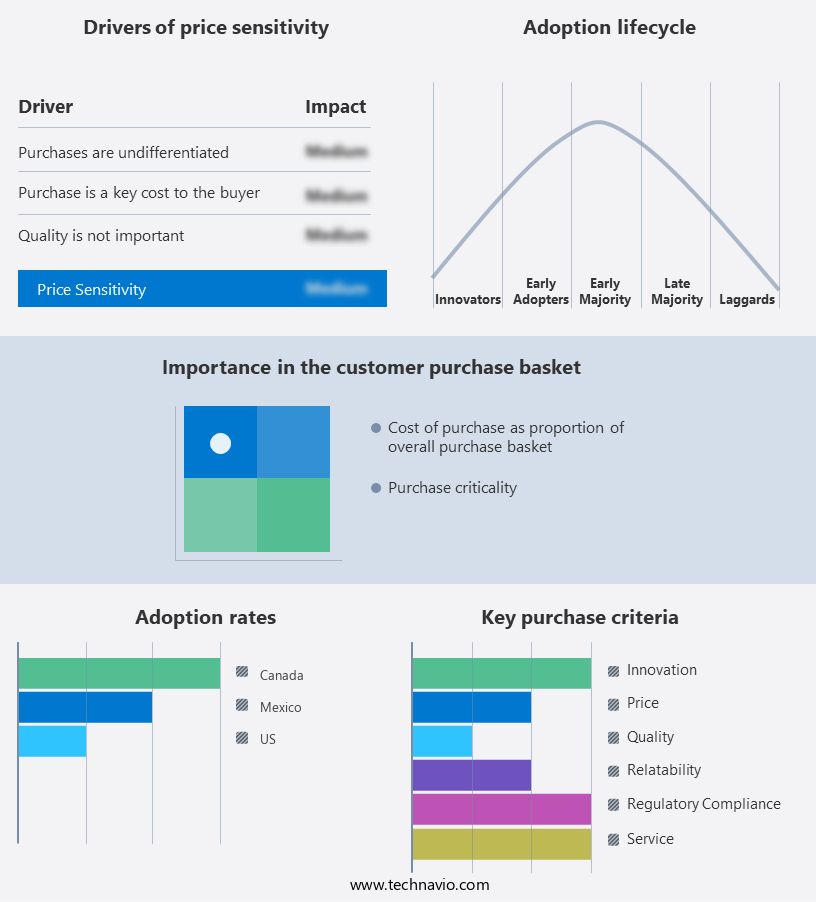
The market forecasting report includes the adoption lifecycle of the market, covering from the innovator’s stage to the laggard’s stage. It focuses on adoption rates in different regions based on penetration. Furthermore, the report also includes key purchase criteria and drivers of price sensitivity to help companies evaluate and develop their market growth analysis strategies.

Customer Landscape
Key Companies & Market Insights
Companies are implementing various strategies, such as strategic alliances, market forecast partnerships, mergers and acquisitions, geographical expansion, and product/service launches, to enhance their presence in the market.
The market research and growth report includes detailed analyses of the competitive landscape of the market and information about key companies, including:
- BASF
- Evonik Industries
- Nippon Shokubai
- LG Chem
- Sumitomo Seika
- Formosa Plastics
- Kao Corporation
- Sanyo Chemical
- Songwon Industrial
- Yixing Danson
- Archer Daniels Midland
- Acuro Organics
- Chemtex Speciality
- Gelok International
- Quanzhou Banglida
- SNF Floerger
- Zhejiang Satellite Petrochemical
- Chase Corporation
- High Smart Commodity
- Wanhua Chemical
Qualitative and quantitative analysis of companies has been conducted to help clients understand the wider business environment as well as the strengths and weaknesses of key market players. Data is qualitatively analyzed to categorize companies as pure play, category-focused, industry-focused, and diversified; it is quantitatively analyzed to categorize companies as dominant, leading, strong, tentative, and weak.
Recent Development and News in Superabsorbent Polymers Market In North America
- In January 2024, BASF Corporation, a leading chemical producer, announced the expansion of its superabsorbent polymer (SAP) production capacity at its Geismar, Louisiana, site. This USD120 million investment aims to enhance the company's market position and meet the growing demand for SAPs in various applications, such as diapers, agriculture, and construction (BASF press release, 2024).
- In March 2025, Lonza Inc., a Swiss specialty ingredients supplier, entered into a strategic partnership with Avgol Industries Ltd., a leading producer of nonwoven fabrics for hygiene applications. The collaboration focuses on the development and commercialization of innovative SAP solutions for improved absorbency and sustainability in hygiene products (Lonza press release, 2025).
- In May 2024, Evonik Industries AG, a German specialty chemicals company, completed the acquisition of Perquimon S.A., a Brazilian producer of superabsorbent polymers. This acquisition strengthens Evonik's global presence in the SAP market and provides access to Perquimon's production facilities and customer base in Latin America (Evonik press release, 2024).
- In February 2025, the United States Environmental Protection Agency (EPA) announced the approval of a new type of superabsorbent polymer, which significantly reduces water usage in the production process. This development is expected to contribute to the growth of the North American SAP market by reducing the environmental footprint and increasing the competitiveness of SAP manufacturers (EPA press release, 2025).
Research Analyst Overview
Superabsorbent polymers (SAPs) are a dynamic and evolving market in North America, with various sectors continually integrating these innovative materials into their applications. SAPs, known for their high absorption capacity, find extensive use in diverse industries, including packaging films, absorption capacity enhancement in various end-use sectors, and biodegradable polymers for drought tolerance. Manufacturing processes for SAPs, such as biopolymer synthesis and sodium polyacrylate production, are under constant refinement to optimize efficiency and reduce environmental impact. Supply chain management plays a crucial role in ensuring the availability and reliability of raw materials, including acrylamide monomer and starch-based polymers, in the production of SAPs.
Applications of SAPs span across sectors, from baby wipes and incontinence products to fluid management in industries like meat packaging and food preservation. SAPs contribute to moisture control, freshness retention, and leakage prevention in various applications, such as disposable diapers, feminine hygiene products, and wound dressing. In the realm of environmental applications, SAPs play a significant role in wastewater treatment, soil conditioning, and heavy metal removal. The ongoing research and development in the field of SAPs result in the creation of compostable polymers, reducing the environmental impact of these materials. Price volatility, driven by raw material sourcing and testing standards, continues to be a critical factor in the SAP market.
The market's continuous evolution is further influenced by regulatory compliance and the development of new applications, such as oil spill cleanup and seed germination. In the ever-changing landscape of the SAP market, the role of rheological properties, safety standards, and polymer characterization becomes increasingly important for ensuring the quality and performance of these materials. The ongoing research and innovation in the field of SAPs ensure their continued relevance and application across various industries.
Dive into Technavio’s robust research methodology, blending expert interviews, extensive data synthesis, and validated models for unparalleled Superabsorbent Polymers Market in North America insights. See full methodology.
Market Scope
|
Report Coverage
|
Details
|
Page number
|
144
|
Base year
|
2023
|
Historic period
|
2018-2022 |
Forecast period
|
2024-2028
|
Growth momentum & CAGR
|
Accelerate at a CAGR of 5.4%
|
Market growth 2024-2028
|
USD 989.5 million
|
Market structure
|
Concentrated
|
YoY growth 2023-2024(%)
|
5.0
|
Competitive landscape
|
Leading Companies, Market Positioning of Companies, Competitive Strategies, and Industry Risks
|
Request Free Sample
What are the Key Data Covered in this Market Research Report?
- CAGR of the market during the forecast period
- Detailed information on factors that will drive the market growth and forecasting between 2024 and 2028
- Precise estimation of the size of the market and its contribution of the market in focus to the parent market
- Accurate predictions about upcoming market growth and trends and changes in consumer behaviour
- Growth of the market across North America
- Thorough analysis of the market’s competitive landscape and detailed information about companies
- Comprehensive analysis of factors that will challenge the growth of market companies
We can help! Our analysts can customize this market research report to meet your requirements Get in touch
1 Executive Summary
- 1.1 Market overview
- Executive Summary - Chart on Market Overview
- Executive Summary - Data Table on Market Overview
- Executive Summary - Chart on Country Market Characteristics
- Executive Summary - Chart on Market by Geography
- Executive Summary - Chart on Market Segmentation by Application
- Executive Summary - Chart on Incremental Growth
- Executive Summary - Data Table on Incremental Growth
- Executive Summary - Chart on Company Market Positioning
2 Technavio Analysis
- 2.1 Analysis of price sensitivity, lifecycle, customer purchase basket, adoption rates, and purchase criteria
- Analysis of price sensitivity, lifecycle, customer purchase basket, adoption rates, and purchase criteria
- 2.2 Criticality of inputs and Factors of differentiation
- Overview on criticality of inputs and factors of differentiation
- 2.3 Factors of disruption
- Overview on factors of disruption
- 2.4 Impact of drivers and challenges
- Impact of drivers and challenges in 2023 and 2028
3 Market Landscape
- 3.1 Market ecosystem
- Parent Market
- Data Table on - Parent Market
- 3.2 Market characteristics
- Market characteristics analysis
4 Market Sizing
- 4.1 Market definition
- Offerings of companies included in the market definition
- 4.2 Market segment analysis
- 4.4 Market outlook: Forecast for 2023-2028
- Chart on North America - Market size and forecast 2023-2028 ($ million)
- Data Table on Regional - Market size and forecast 2023-2028 ($ million)
- Chart on North America: Year-over-year growth 2023-2028 (%)
- Data Table on Regional - Market size and forecast 2023-2028 ($ million)
5 Historic Market Size
- 5.1 Superabsorbent Polymers Market in North America 2018 - 2022
- Historic Market Size - Data Table on Superabsorbent Polymers Market in North America 2018 - 2022 ($ million)
- 5.2 Application segment analysis 2018 - 2022
- Historic Market Size - Application Segment 2018 - 2022 ($ million)
- 5.3 Geography segment analysis 2018 - 2022
- Historic Market Size - Geography Segment 2018 - 2022 ($ million)
6 Qualitative Analysis
- 6.1 Impact of AI on Superabsorbent Polymers Market in North America
7 Five Forces Analysis
- 7.1 Five forces summary
- Five forces analysis - Comparison between 2023 and 2028
- 7.2 Bargaining power of buyers
- Bargaining power of buyers - Impact of key factors 2023 and 2028
- 7.3 Bargaining power of suppliers
- Bargaining power of suppliers - Impact of key factors in 2023 and 2028
- 7.4 Threat of new entrants
- Threat of new entrants - Impact of key factors in 2023 and 2028
- 7.5 Threat of substitutes
- Threat of substitutes - Impact of key factors in 2023 and 2028
- 7.6 Threat of rivalry
- Threat of rivalry - Impact of key factors in 2023 and 2028
- 7.7 Market condition
- Chart on Market condition - Five forces 2023 and 2028
8 Market Segmentation by Application
- 8.1 Market segments
- Chart on Application - Market share (2023-2028) (%)
- Data Table on Application - Market share (2023-2028) (%)
- 8.2 Comparison by Application
- Chart on Comparison by Application
- Data Table on Comparison by Application
- 8.3 Baby diapers - Market size and forecast (2023-2028)
- Chart on Baby diapers - Market size and forecast (2023-2028) ($ million)
- Data Table on Baby diapers - Market size and forecast (2023-2028) ($ million)
- Chart on Baby diapers - Year-over-year growth (2023-2028) (%)
- Data Table on Baby diapers - Year-over-year growth (2023-2028) (%)
- 8.4 Adult incontinence products - Market size and forecast (2023-2028)
- Chart on Adult incontinence products - Market size and forecast (2023-2028) ($ million)
- Data Table on Adult incontinence products - Market size and forecast (2023-2028) ($ million)
- Chart on Adult incontinence products - Year-over-year growth (2023-2028) (%)
- Data Table on Adult incontinence products - Year-over-year growth (2023-2028) (%)
- 8.5 Feminine hygiene - Market size and forecast (2023-2028)
- Chart on Feminine hygiene - Market size and forecast (2023-2028) ($ million)
- Data Table on Feminine hygiene - Market size and forecast (2023-2028) ($ million)
- Chart on Feminine hygiene - Year-over-year growth (2023-2028) (%)
- Data Table on Feminine hygiene - Year-over-year growth (2023-2028) (%)
- 8.6 Agriculture - Market size and forecast (2023-2028)
- Chart on Agriculture - Market size and forecast (2023-2028) ($ million)
- Data Table on Agriculture - Market size and forecast (2023-2028) ($ million)
- Chart on Agriculture - Year-over-year growth (2023-2028) (%)
- Data Table on Agriculture - Year-over-year growth (2023-2028) (%)
- 8.7 Others - Market size and forecast (2023-2028)
- Chart on Others - Market size and forecast (2023-2028) ($ million)
- Data Table on Others - Market size and forecast (2023-2028) ($ million)
- Chart on Others - Year-over-year growth (2023-2028) (%)
- Data Table on Others - Year-over-year growth (2023-2028) (%)
- 8.8 Market opportunity by Application
- Market opportunity by Application ($ million)
- Data Table on Market opportunity by Application ($ million)
9 Market Segmentation by Distribution Channel
- 9.1 Market segments
- Chart on Distribution Channel - Market share (2023-2028) (%)
- Data Table on Distribution Channel - Market share (2023-2028) (%)
- 9.2 Comparison by Distribution Channel
- Chart on Comparison by Distribution Channel
- Data Table on Comparison by Distribution Channel
- 9.3 Direct Sales - Market size and forecast (2023-2028)
- Chart on Direct Sales - Market size and forecast (2023-2028) ($ million)
- Data Table on Direct Sales - Market size and forecast (2023-2028) ($ million)
- Chart on Direct Sales - Year-over-year growth (2023-2028) (%)
- Data Table on Direct Sales - Year-over-year growth (2023-2028) (%)
- 9.4 Distributors - Market size and forecast (2023-2028)
- Chart on Distributors - Market size and forecast (2023-2028) ($ million)
- Data Table on Distributors - Market size and forecast (2023-2028) ($ million)
- Chart on Distributors - Year-over-year growth (2023-2028) (%)
- Data Table on Distributors - Year-over-year growth (2023-2028) (%)
- 9.5 Online Retail - Market size and forecast (2023-2028)
- Chart on Online Retail - Market size and forecast (2023-2028) ($ million)
- Data Table on Online Retail - Market size and forecast (2023-2028) ($ million)
- Chart on Online Retail - Year-over-year growth (2023-2028) (%)
- Data Table on Online Retail - Year-over-year growth (2023-2028) (%)
- 9.6 Market opportunity by Distribution Channel
- Market opportunity by Distribution Channel ($ million)
- Data Table on Market opportunity by Distribution Channel ($ million)
10 Market Segmentation by Type
- 10.1 Market segments
- Chart on Type - Market share (2023-2028) (%)
- Data Table on Type - Market share (2023-2028) (%)
- 10.2 Comparison by Type
- Chart on Comparison by Type
- Data Table on Comparison by Type
- 10.3 Synthetic - Market size and forecast (2023-2028)
- Chart on Synthetic - Market size and forecast (2023-2028) ($ million)
- Data Table on Synthetic - Market size and forecast (2023-2028) ($ million)
- Chart on Synthetic - Year-over-year growth (2023-2028) (%)
- Data Table on Synthetic - Year-over-year growth (2023-2028) (%)
- 10.4 Bio-Based - Market size and forecast (2023-2028)
- Chart on Bio-Based - Market size and forecast (2023-2028) ($ million)
- Data Table on Bio-Based - Market size and forecast (2023-2028) ($ million)
- Chart on Bio-Based - Year-over-year growth (2023-2028) (%)
- Data Table on Bio-Based - Year-over-year growth (2023-2028) (%)
- 10.5 Market opportunity by Type
- Market opportunity by Type ($ million)
- Data Table on Market opportunity by Type ($ million)
11 Market Segmentation by End-User
- 11.1 Market segments
- Chart on End-User - Market share (2023-2028) (%)
- Data Table on End-User - Market share (2023-2028) (%)
- 11.2 Comparison by End-User
- Chart on Comparison by End-User
- Data Table on Comparison by End-User
- 11.3 Consumer Goods - Market size and forecast (2023-2028)
- Chart on Consumer Goods - Market size and forecast (2023-2028) ($ million)
- Data Table on Consumer Goods - Market size and forecast (2023-2028) ($ million)
- Chart on Consumer Goods - Year-over-year growth (2023-2028) (%)
- Data Table on Consumer Goods - Year-over-year growth (2023-2028) (%)
- 11.4 Healthcare - Market size and forecast (2023-2028)
- Chart on Healthcare - Market size and forecast (2023-2028) ($ million)
- Data Table on Healthcare - Market size and forecast (2023-2028) ($ million)
- Chart on Healthcare - Year-over-year growth (2023-2028) (%)
- Data Table on Healthcare - Year-over-year growth (2023-2028) (%)
- 11.5 Agriculture - Market size and forecast (2023-2028)
- Chart on Agriculture - Market size and forecast (2023-2028) ($ million)
- Data Table on Agriculture - Market size and forecast (2023-2028) ($ million)
- Chart on Agriculture - Year-over-year growth (2023-2028) (%)
- Data Table on Agriculture - Year-over-year growth (2023-2028) (%)
- 11.6 Industrial - Market size and forecast (2023-2028)
- Chart on Industrial - Market size and forecast (2023-2028) ($ million)
- Data Table on Industrial - Market size and forecast (2023-2028) ($ million)
- Chart on Industrial - Year-over-year growth (2023-2028) (%)
- Data Table on Industrial - Year-over-year growth (2023-2028) (%)
- 11.7 Market opportunity by End-User
- Market opportunity by End-User ($ million)
- Data Table on Market opportunity by End-User ($ million)
12 Customer Landscape
- 12.1 Customer landscape overview
- Analysis of price sensitivity, lifecycle, customer purchase basket, adoption rates, and purchase criteria
13 Geographic Landscape
- 13.1 Geographic segmentation
- Chart on Market share by geography - 2023-2028 (%)
- Data Table on Market share by geography - 2023-2028 (%)
- 13.2 Geographic comparison
- Chart on Geographic comparison
- Data Table on Geographic comparison
- 13.3 US - Market size and forecast 2023-2028
- Chart on US - Market size and forecast 2023-2028 ($ million)
- Data Table on US - Market size and forecast 2023-2028 ($ million)
- Chart on US - Year-over-year growth 2023-2028 (%)
- Data Table on US - Year-over-year growth 2023-2028 (%)
- 13.4 Canada - Market size and forecast 2023-2028
- Chart on Canada - Market size and forecast 2023-2028 ($ million)
- Data Table on Canada - Market size and forecast 2023-2028 ($ million)
- Chart on Canada - Year-over-year growth 2023-2028 (%)
- Data Table on Canada - Year-over-year growth 2023-2028 (%)
- 13.5 Mexico - Market size and forecast 2023-2028
- Chart on Mexico - Market size and forecast 2023-2028 ($ million)
- Data Table on Mexico - Market size and forecast 2023-2028 ($ million)
- Chart on Mexico - Year-over-year growth 2023-2028 (%)
- Data Table on Mexico - Year-over-year growth 2023-2028 (%)
- 13.6 Market opportunity by geography
- Market opportunity by geography ($ million)
- Data Table on Market opportunity by geography ($ million)
- 13.8 US - Market size and forecast (2023-2028)
- Chart on US - Market size and forecast (2023-2028) ($ million)
- Data Table on US - Market size and forecast (2023-2028) ($ million)
- Chart on US - Year-over-year growth (2023-2028) (%)
- Data Table on US - Year-over-year growth (2023-2028) (%)
- 13.9 China - Market size and forecast (2023-2028)
- Chart on China - Market size and forecast (2023-2028) ($ million)
- Data Table on China - Market size and forecast (2023-2028) ($ million)
- Chart on China - Year-over-year growth (2023-2028) (%)
- Data Table on China - Year-over-year growth (2023-2028) (%)
- 13.10 Germany - Market size and forecast (2023-2028)
- Chart on Germany - Market size and forecast (2023-2028) ($ million)
- Data Table on Germany - Market size and forecast (2023-2028) ($ million)
- Chart on Germany - Year-over-year growth (2023-2028) (%)
- Data Table on Germany - Year-over-year growth (2023-2028) (%)
- 13.11 Japan - Market size and forecast (2023-2028)
- Chart on Japan - Market size and forecast (2023-2028) ($ million)
- Data Table on Japan - Market size and forecast (2023-2028) ($ million)
- Chart on Japan - Year-over-year growth (2023-2028) (%)
- Data Table on Japan - Year-over-year growth (2023-2028) (%)
- 13.12 UK - Market size and forecast (2023-2028)
- Chart on UK - Market size and forecast (2023-2028) ($ million)
- Data Table on UK - Market size and forecast (2023-2028) ($ million)
- Chart on UK - Year-over-year growth (2023-2028) (%)
- Data Table on UK - Year-over-year growth (2023-2028) (%)
- 13.13 Australia - Market size and forecast (2023-2028)
- Chart on Australia - Market size and forecast (2023-2028) ($ million)
- Data Table on Australia - Market size and forecast (2023-2028) ($ million)
- Chart on Australia - Year-over-year growth (2023-2028) (%)
- Data Table on Australia - Year-over-year growth (2023-2028) (%)
- 13.14 India - Market size and forecast (2023-2028)
- Chart on India - Market size and forecast (2023-2028) ($ million)
- Data Table on India - Market size and forecast (2023-2028) ($ million)
- Chart on India - Year-over-year growth (2023-2028) (%)
- Data Table on India - Year-over-year growth (2023-2028) (%)
- 13.15 France - Market size and forecast (2023-2028)
- Chart on France - Market size and forecast (2023-2028) ($ million)
- Data Table on France - Market size and forecast (2023-2028) ($ million)
- Chart on France - Year-over-year growth (2023-2028) (%)
- Data Table on France - Year-over-year growth (2023-2028) (%)
- 13.16 Brazil - Market size and forecast (2023-2028)
- Chart on Brazil - Market size and forecast (2023-2028) ($ million)
- Data Table on Brazil - Market size and forecast (2023-2028) ($ million)
- Chart on Brazil - Year-over-year growth (2023-2028) (%)
- Data Table on Brazil - Year-over-year growth (2023-2028) (%)
- 13.17 UAE - Market size and forecast (2023-2028)
- Chart on UAE - Market size and forecast (2023-2028) ($ million)
- Data Table on UAE - Market size and forecast (2023-2028) ($ million)
- Chart on UAE - Year-over-year growth (2023-2028) (%)
- Data Table on UAE - Year-over-year growth (2023-2028) (%)
- 13.18 Rest of World (ROW) - Market size and forecast (2023-2028)
- Chart on Rest of World (ROW) - Market size and forecast (2023-2028) ($ million)
- Data Table on Rest of World (ROW) - Market size and forecast (2023-2028) ($ million)
- Chart on Rest of World (ROW) - Year-over-year growth (2023-2028) (%)
- Data Table on Rest of World (ROW) - Year-over-year growth (2023-2028) (%)
- 13.19 Saudi Arabia - Market size and forecast (2023-2028)
- Chart on Saudi Arabia - Market size and forecast (2023-2028) ($ million)
- Data Table on Saudi Arabia - Market size and forecast (2023-2028) ($ million)
- Chart on Saudi Arabia - Year-over-year growth (2023-2028) (%)
- Data Table on Saudi Arabia - Year-over-year growth (2023-2028) (%)
- 13.20 South Korea - Market size and forecast (2023-2028)
- Chart on South Korea - Market size and forecast (2023-2028) ($ million)
- Data Table on South Korea - Market size and forecast (2023-2028) ($ million)
- Chart on South Korea - Year-over-year growth (2023-2028) (%)
- Data Table on South Korea - Year-over-year growth (2023-2028) (%)
- 13.21 Italy - Market size and forecast (2023-2028)
- Chart on Italy - Market size and forecast (2023-2028) ($ million)
- Data Table on Italy - Market size and forecast (2023-2028) ($ million)
- Chart on Italy - Year-over-year growth (2023-2028) (%)
- Data Table on Italy - Year-over-year growth (2023-2028) (%)
- 13.22 Spain - Market size and forecast (2023-2028)
- Chart on Spain - Market size and forecast (2023-2028) ($ million)
- Data Table on Spain - Market size and forecast (2023-2028) ($ million)
- Chart on Spain - Year-over-year growth (2023-2028) (%)
- Data Table on Spain - Year-over-year growth (2023-2028) (%)
14 Drivers, Challenges, and Opportunity/Restraints
- 14.3 Impact of drivers and challenges
- Impact of drivers and challenges in 2023 and 2028
- 14.4 Market opportunities/restraints
15 Competitive Landscape
- 15.2 Competitive Landscape
- Overview on criticality of inputs and factors of differentiation
- 15.3 Landscape disruption
- Overview on factors of disruption
- 15.4 Industry risks
- Impact of key risks on business
16 Competitive Analysis
- 16.2 Market positioning of companies
- Matrix on companies position and classification
- 16.3 BASF
- BASF - Overview
- BASF - Product / Service
- BASF - Key offerings
- 16.4 Evonik Industries
- Evonik Industries - Overview
- Evonik Industries - Product / Service
- Evonik Industries - Key offerings
- 16.5 Nippon Shokubai
- Nippon Shokubai - Overview
- Nippon Shokubai - Product / Service
- Nippon Shokubai - Key offerings
- 16.6 LG Chem
- LG Chem - Overview
- LG Chem - Product / Service
- LG Chem - Key offerings
- 16.7 Sumitomo Seika
- Sumitomo Seika - Overview
- Sumitomo Seika - Product / Service
- Sumitomo Seika - Key offerings
- 16.8 Formosa Plastics
- Formosa Plastics - Overview
- Formosa Plastics - Product / Service
- Formosa Plastics - Key offerings
- 16.9 Kao Corporation
- Kao Corporation - Overview
- Kao Corporation - Product / Service
- Kao Corporation - Key offerings
- 16.10 Sanyo Chemical
- Sanyo Chemical - Overview
- Sanyo Chemical - Product / Service
- Sanyo Chemical - Key offerings
- 16.11 Songwon Industrial
- Songwon Industrial - Overview
- Songwon Industrial - Product / Service
- Songwon Industrial - Key offerings
- 16.12 Yixing Danson
- Yixing Danson - Overview
- Yixing Danson - Product / Service
- Yixing Danson - Key offerings
- 16.13 Archer Daniels Midland
- Archer Daniels Midland - Overview
- Archer Daniels Midland - Product / Service
- Archer Daniels Midland - Key offerings
- 16.14 Acuro Organics
- Acuro Organics - Overview
- Acuro Organics - Product / Service
- Acuro Organics - Key offerings
- 16.15 Chemtex Speciality
- Chemtex Speciality - Overview
- Chemtex Speciality - Product / Service
- Chemtex Speciality - Key offerings
- 16.16 Gelok International
- Gelok International - Overview
- Gelok International - Product / Service
- Gelok International - Key offerings
- 16.17 Quanzhou Banglida
- Quanzhou Banglida - Overview
- Quanzhou Banglida - Product / Service
- Quanzhou Banglida - Key offerings
- 16.18 SNF Floerger
- SNF Floerger - Overview
- SNF Floerger - Product / Service
- SNF Floerger - Key offerings
- 16.19 Zhejiang Satellite Petrochemical
- Zhejiang Satellite Petrochemical - Overview
- Zhejiang Satellite Petrochemical - Product / Service
- Zhejiang Satellite Petrochemical - Key offerings
- 16.20 Chase Corporation
- Chase Corporation - Overview
- Chase Corporation - Product / Service
- Chase Corporation - Key offerings
- 16.21 High Smart Commodity
- High Smart Commodity - Overview
- High Smart Commodity - Product / Service
- High Smart Commodity - Key offerings
- 16.22 Wanhua Chemical
- Wanhua Chemical - Overview
- Wanhua Chemical - Product / Service
- Wanhua Chemical - Key offerings
- 16.23 Archer Daniels Midland Co.
- Archer Daniels Midland Co. - Overview
- Archer Daniels Midland Co. - Product / Service
- Archer Daniels Midland Co. - Key offerings
- 16.24 Asahi Kasei Corp.
- Asahi Kasei Corp. - Overview
- Asahi Kasei Corp. - Product / Service
- Asahi Kasei Corp. - Key offerings
- 16.25 BASF SE
- BASF SE - Overview
- BASF SE - Product / Service
- BASF SE - Key offerings
- 16.26 Chase Corp.
- Chase Corp. - Overview
- Chase Corp. - Product / Service
- Chase Corp. - Key offerings
- 16.27 Evonik Industries AG
- Evonik Industries AG - Overview
- Evonik Industries AG - Product / Service
- Evonik Industries AG - Key offerings
- 16.28 Kao Corp.
- Kao Corp. - Overview
- Kao Corp. - Product / Service
- Kao Corp. - Key offerings
- 16.29 LG Corp.
- LG Corp. - Overview
- LG Corp. - Product / Service
- LG Corp. - Key offerings
- 16.30 NIPPON SHOKUBAI CO. LTD
- NIPPON SHOKUBAI CO. LTD - Overview
- NIPPON SHOKUBAI CO. LTD - Product / Service
- NIPPON SHOKUBAI CO. LTD - Key offerings
- 16.31 Sanyo Chemical Industries Ltd.
- Sanyo Chemical Industries Ltd. - Overview
- Sanyo Chemical Industries Ltd. - Product / Service
- Sanyo Chemical Industries Ltd. - Key offerings
- 16.32 Songwon Industrial Co. Ltd.
- Songwon Industrial Co. Ltd. - Overview
- Songwon Industrial Co. Ltd. - Product / Service
- Songwon Industrial Co. Ltd. - Key offerings
- 16.33 Sumitomo Seika Chemicals Co. Ltd.
- Sumitomo Seika Chemicals Co. Ltd. - Overview
- Sumitomo Seika Chemicals Co. Ltd. - Product / Service
- Sumitomo Seika Chemicals Co. Ltd. - Key offerings
- 16.34 Wanhua Chemical Group Co. Ltd.
- Wanhua Chemical Group Co. Ltd. - Overview
- Wanhua Chemical Group Co. Ltd. - Product / Service
- Wanhua Chemical Group Co. Ltd. - Key offerings
17 Appendix
- 17.2 Inclusions and exclusions checklist
- Inclusions checklist
- Exclusions checklist
- 17.3 Currency conversion rates for US$
- Currency conversion rates for US$
- 17.4 Research methodology
- 17.7 Validation techniques employed for market sizing
- Validation techniques employed for market sizing
- 17.9 360 degree market analysis
- 360 degree market analysis
- 17.10 List of abbreviations