Synchronous Pulley Market Size 2024-2028
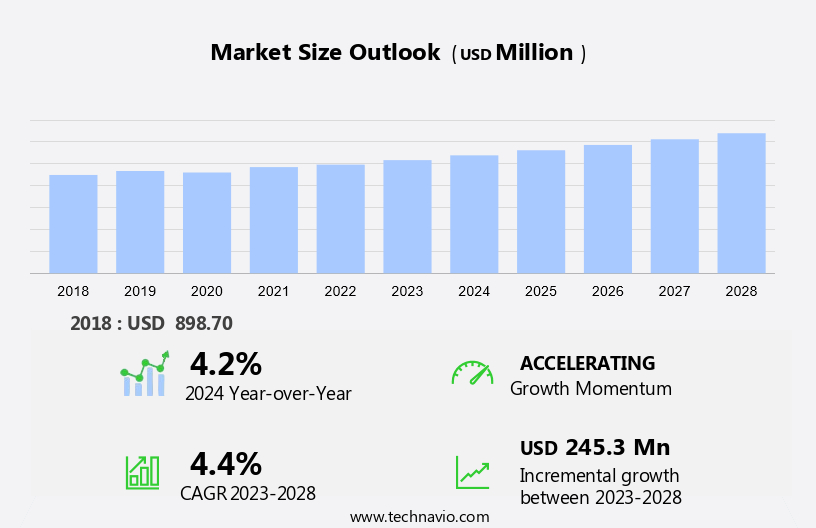
The synchronous pulley market size is forecast to increase by USD 245.3 million at a CAGR of 4.4% between 2023 and 2028.
- The market is experiencing significant growth due to the increasing adoption of synchronous pulleys In the automotive industry. This trend is driven by the need for improved efficiency and performance in various applications, particularly in power transmission systems. Another key factor fueling market growth is the integration of Industry 4.0 technologies, which enable advanced automation and remote monitoring capabilities. However, the market faces challenges such as high initial and maintenance costs, which may limit its widespread adoption in certain industries and applications. Despite these challenges, the market is expected to continue growing as demand for more efficient and technologically advanced solutions increases. The market offers significant opportunities for innovation and growth, particularly In the areas of materials science, manufacturing processes, and system design. By addressing the challenges of cost and maintaining a focus on delivering value to customers, market participants can capitalize on these opportunities and drive the market forward.
What will be the Size of the Synchronous Pulley Market During the Forecast Period?
- The market is a significant segment of the industrial equipment industry, playing a crucial role in belt drive systems used in mechanical engineering applications. This market is influenced by various trends and dynamics shaping the manufacturing sector. Sustainable manufacturing is a key driver, with companies prioritizing energy efficiency and reducing waste in production processes. The economic outlook remains positive, bolstered by increasing consumer buying power and the ongoing digital transformation in manufacturing.
- Moreover, innovation in manufacturing technology, such as Industry 4.0 and CNC machining, continues to push the boundaries of precision engineering and automation solutions. Supply chain management software and optimization are also critical factors, as companies seek to minimize lead times and improve overall efficiency. These trends are expected to continue shaping the market, ensuring its relevance In the evolving manufacturing landscape.
How is this Synchronous Pulley Industry segmented and which is the largest segment?
The synchronous pulley industry research report provides comprehensive data (region-wise segment analysis), with forecasts and estimates in "USD million" for the period 2024-2028, as well as historical data from 2018-2022 for the following segments.
- Type
- Standard timing pulley
- Taper-lock pulley
- Double synchronous pulley
- Others
- End-user
- Industrial manufacturing
- Automotive
- Agriculture
- Construction
- Others
- Geography
- APAC
- China
- India
- Japan
- South Korea
- North America
- Canada
- US
- Europe
- Germany
- UK
- Italy
- South America
- Brazil
- Middle East and Africa
- APAC
By Type Insights
- The standard timing pulley segment is estimated to witness significant growth during the forecast period.
The market encompasses standard timing pulleys, a crucial component in various industrial applications. These pulleys function in harmony with timing belts, ensuring synchronization through their toothed design. The interlocking mechanism between the pulley and belt eliminates slippage and guarantees precise, consistent movement. Manufactured according to international standards, such as ISO 17396:2017, standard timing pulleys adhere to critical specifications, including pulley groove dimensions, tolerances, and quality requirements. This adherence to standards ensures optimal performance and reliability.
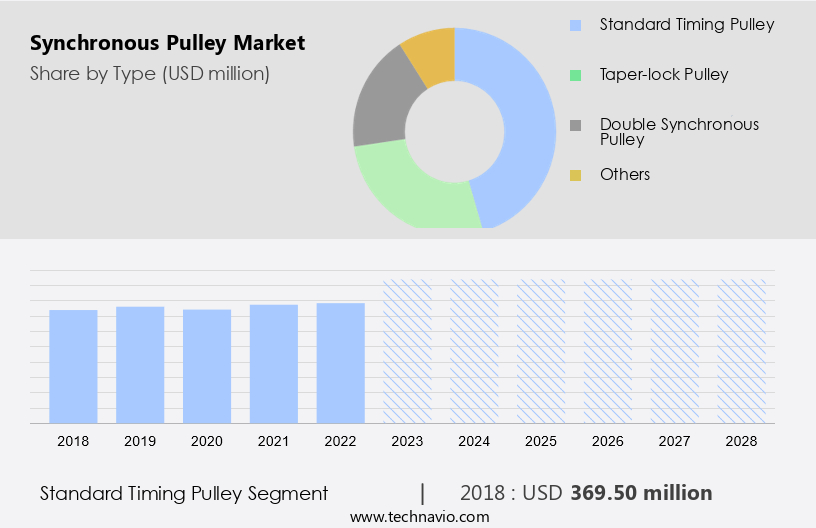
Get a glance at the Synchronous Pulley Industry report of share of various segments Request Free Sample
The standard timing pulley segment was valued at USD 369.50 million in 2018 and showed a gradual increase during the forecast period.
Regional Analysis
- APAC is estimated to contribute 50% to the growth of the global market during the forecast period.
Technavio's analysts have elaborately explained the regional trends and drivers that shape the market during the forecast period.

For more insights on the market share of various regions, Request Free Sample
The Asia Pacific region plays a pivotal role In the market, fueled by the expanding automotive, manufacturing, and energy sectors. The economic growth and rapid industrialization in this region have generated a substantial demand for synchronous pulleys, which are crucial for power transmission efficiency in various applications. The automotive industry in Asia Pacific has experienced significant growth, with India and China leading the way. In December 2023, India's passenger vehicle sales grew by 3.2% year-over-year (YOY) to approximately 242,920 units, while vehicle sales rose by 7.4% YOY to around 1,247,614 units during the same period. Excluding luxury brands, passenger vehicle sales increased by 8% YOY. These trends underscore the importance of synchronous pulleys in powering the region's economic development.
Market Dynamics
Our synchronous pulley market researchers analyzed the data with 2023 as the base year, along with the key drivers, trends, and challenges. A holistic analysis of drivers will help companies refine their marketing strategies to gain a competitive advantage.
What are the key market drivers leading to the rise In the adoption of Synchronous Pulley Industry?
Rising adoption of synchronous pulleys in automotive industry is the key driver of the market.
- Synchronous pulleys play a crucial role In the production process of various industries, including automotive and manufacturing, by ensuring precise synchronization between moving parts. These pulleys, specifically timing belt pulleys, are essential for internal combustion engines, synchronizing the movements of the camshaft and crankshaft for efficient combustion and optimal power output. As automakers prioritize engine performance and emissions compliance, the demand for high-precision synchronous pulleys has increased. The adoption of downsized turbocharged engines, which necessitate precise control of timing mechanisms, further underscores the importance of these components. The automotive sector's growth is driven by consumer preferences for fuel efficiency, durability, and advanced technology.
- Furthermore, synchronous pulleys contribute to these demands by reducing weight and improving overall performance. In addition, the integration of industrial automation, such as robots and CNC machine tools, in manufacturing processes relies on the accurate timing provided by synchronous pulleys. Moreover, the push for energy conservation and green manufacturing practices has increased the importance of synchronous pulleys in supply chains. By optimizing energy usage and reducing waste, these components contribute to the sustainability goals of industries. Technological innovation continues to shape the market, with advancements in materials and manufacturing processes leading to improved durability and efficiency. Subject-related expert advice suggests that these trends will persist, making synchronous pulleys an indispensable component in various industries.
What are the market trends shaping the Synchronous Pulley Industry?
Growing adoption of Industry 4.0 technologies is the upcoming market trend.
- The market is experiencing significant growth due to the integration of Industry 4.0 technologies and the emphasis on energy conservation and green manufacturing. Synchronous pulleys, a key component of high-precision equipment such as CNC machine tools and printing presses, are at the forefront of this evolution. These advanced pulleys, equipped with smart sensors and connected to IoT platforms, enable real-time monitoring and predictive maintenance, leading to increased operational efficiency and reduced energy loss. In the context of industrial automation, synchronous pulleys play a crucial role in synchronizing mechanical movements and minimizing energy consumption in various industries, including automotive and manufacturing.
- Moreover, technological innovation is driving the market, with companies investing in research and development to create more efficient and intelligent pulley systems. The adoption of these systems contributes to the overall goal of Industry 4.0, which is to create smart factories that optimize production processes and reduce waste. By minimizing energy loss and improving operational efficiency, synchronous pulleys contribute to the sustainability and competitiveness of manufacturing supply chains.
What challenges does the Synchronous Pulley Industry face during its growth?
High initial and maintenance costs is a key challenge affecting the industry growth.
- The market is driven by the growing demand for energy conservation and green manufacturing in various industries. Synchronous pulleys, a crucial component of industrial automation systems, offer added value through improved energy efficiency and precise timing. However, the market faces a challenge due to the high initial investment required for their production. These pulleys are often manufactured using advanced materials such as reinforced polymers and high-strength metals, which increase their cost. Furthermore, the intricate manufacturing processes needed to ensure high-precision tooth profiles and alignment add to the expense.
- Consequently, small and medium-sized enterprises may find it challenging to adopt synchronous pulleys due to their higher price point. Despite this hurdle, the market is expected to grow as technological innovation continues to drive demand for more efficient and accurate manufacturing solutions in automotive and other industries.
Exclusive Customer Landscape
The synchronous pulley market forecasting report includes the adoption lifecycle of the market, covering from the innovator's stage to the laggard's stage. It focuses on adoption rates in different regions based on penetration. Furthermore, the synchronous pulley market report also includes key purchase criteria and drivers of price sensitivity to help companies evaluate and develop their market growth analysis strategies.

Customer Landscape
Key Companies & Market Insights
Companies are implementing various strategies, such as strategic alliances, synchronous pulley market forecast, partnerships, mergers and acquisitions, geographical expansion, and product/service launches, to enhance their presence In the industry.
The industry research and growth report includes detailed analyses of the competitive landscape of the market and information about key companies, including:
- AB SKF
- Bando Chemical Industries Ltd.
- Belcon Powertrans LLP
- Bondy AS
- Continental AG
- Cross Morse
- ERIKS N.V.
- Forbo Management SA
- Gates Industrial Corp. Plc
- Habasit International AG
- Hind Gear Industries
- Hutchinson SA
- Intech Corp
- Martin Sprocket and Gear Inc.
- MEGADYNE S.P.A
- Mitsuboshi Belting Ltd.
- MSB India
- PIX Transmissions Ltd.
- Torque Transmission
- WM Berg Inc.
Qualitative and quantitative analysis of companies has been conducted to help clients understand the wider business environment as well as the strengths and weaknesses of key industry players. Data is qualitatively analyzed to categorize companies as pure play, category-focused, industry-focused, and diversified; it is quantitatively analyzed to categorize companies as dominant, leading, strong, tentative, and weak.
Research Analyst Overview
The market is a critical component of various industries, including CNC machine tools, printing presses, and high-precision equipment. These pulleys play a pivotal role in ensuring smooth and efficient production processes, thereby contributing significantly to industrial automation. Synchronous pulleys, a type of timing belt pulley, are essential in maintaining the proper synchronization of various machinery components. Their primary function is to transmit power efficiently between rotating shafts while maintaining a constant speed ratio. This feature is particularly valuable in industries that require high-precision manufacturing, such as automotive and robotics.
Moreover, one of the significant market drivers for synchronous pulleys is energy conservation. As industries continue to focus on green manufacturing, the demand for energy-efficient components, including synchronous pulleys, is on the rise. These pulleys help reduce energy losses and improve overall system efficiency, making them an attractive option for manufacturers. Another crucial factor influencing the market is technological innovation. Advancements in materials science, manufacturing processes, and design have led to the development of more durable, lightweight, and efficient synchronous pulleys. These innovations have resulted in improved performance, longer service life, and reduced maintenance costs. The market's supply chain is intricately linked to the production processes of various industries.
Therefore, any disruptions In the supply chain can significantly impact the market's growth. Factors such as raw material availability, transportation logistics, and production capacity can all influence the market's dynamics. Moreover, the increasing adoption of industrial automation and robotics has led to an increase in demand for synchronous pulleys. These machines rely on precise synchronization to function effectively, making synchronous pulleys an indispensable component. Therefore, the market is a dynamic and evolving landscape, influenced by various factors such as energy conservation, technological innovation, and industrial automation. As industries continue to seek more efficient, energy-saving, and high-performance components, the demand for synchronous pulleys is expected to remain strong.
In addition, to stay competitive In the market, manufacturers must focus on continuous innovation and improvement. This can include developing new materials, optimizing production processes, and exploring new applications for synchronous pulleys. Additionally, building strong relationships with suppliers and customers can help ensure a stable supply chain and foster long-term success in the market.
|
Synchronous Pulley Market Scope |
|
|
Report Coverage |
Details |
|
Page number |
213 |
|
Base year |
2023 |
|
Historic period |
2018-2022 |
|
Forecast period |
2024-2028 |
|
Growth momentum & CAGR |
Accelerate at a CAGR of 4.4% |
|
Market growth 2024-2028 |
USD 245.3 million |
|
Market structure |
Fragmented |
|
YoY growth 2023-2024(%) |
4.2 |
|
Key countries |
US, China, Japan, India, Germany, South Korea, UK, Canada, Brazil, and Italy |
|
Competitive landscape |
Leading Companies, Market Positioning of Companies, Competitive Strategies, and Industry Risks |
What are the Key Data Covered in this Synchronous Pulley Market Research and Growth Report?
- CAGR of the Synchronous Pulley industry during the forecast period
- Detailed information on factors that will drive the Synchronous Pulley growth and forecasting between 2024 and 2028
- Precise estimation of the size of the market and its contribution of the industry in focus to the parent market
- Accurate predictions about upcoming growth and trends and changes in consumer behaviour
- Growth of the market across APAC, North America, Europe, South America, and Middle East and Africa
- Thorough analysis of the market's competitive landscape and detailed information about companies
- Comprehensive analysis of factors that will challenge the synchronous pulley market growth of industry companies
We can help! Our analysts can customize this synchronous pulley market research report to meet your requirements.
 RIA -
RIA - 
