Takeaway Containers Market Size 2025-2029
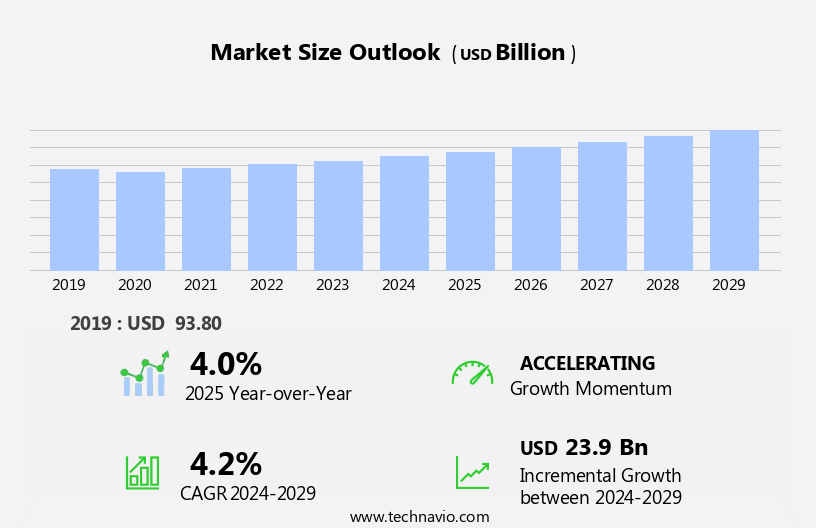
The takeaway containers market size is forecast to increase by USD 23.9 billion at a CAGR of 4.2% between 2024 and 2029.
What will be the Size of the Takeaway Containers Market During the Forecast Period?
How is this Takeaway Containers Industry segmented and which is the largest segment?
The takeaway containers industry research report provides comprehensive data (region-wise segment analysis), with forecasts and estimates in "USD billion" for the period 2025-2029, as well as historical data from 2019-2023 for the following segments.
- Product
- Boxes
- Trays
- Bowls
- Others
- Material
- Paper
- Plastic
- Aluminum
- Others
- Geography
- APAC
- China
- India
- Japan
- North America
- Canada
- US
- Europe
- Germany
- UK
- France
- Middle East and Africa
- South America
- Brazil
- APAC
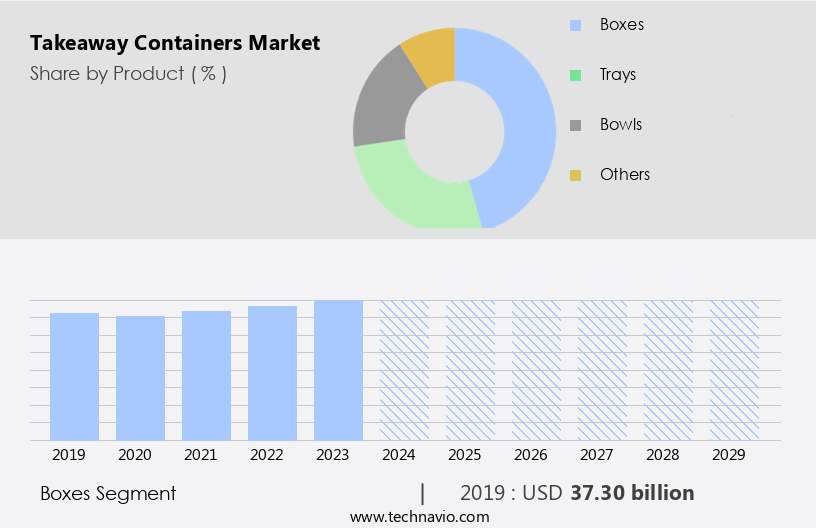
By Product Insights
The boxes segment is estimated to witness significant growth during the forecast period. The market encompasses various product types, with boxes leading due to their practical benefits and versatility. Boxes are favored in food delivery and takeaway services due to their ease of stacking, storing, and transporting, which is essential for businesses managing large orders. Their robust structure ensures food protection, preventing contamination and spillage, maintaining food safety standards and customer satisfaction. Sustainability is a growing concern, leading to the popularity of eco-friendly packaging alternatives like biodegradable, recyclable, and reusable containers. Paper, plastic, bagasse, and other materials are used to create these sustainable options. Convenience, freshness, and food safety are key considerations for consumers, driving product innovations and eco-friendly alternatives.
Takeaway services, including ready-to-eat meals and food delivery, are increasingly popular due to busy lifestyles. The market is influenced by regulations, consumer preferences, and the growing demand for high-barrier packaging to extend shelf life.
Get a glance at the market report of various segments Request Free Sample
The Boxes segment was valued at USD 37.30 billion in 2019 and showed a gradual increase during the forecast period.
Regional Analysis
APAC is estimated to contribute 43% to the growth of the global market during the forecast period. Technavio’s analysts have elaborately explained the regional trends and drivers that shape the market during the forecast period.

For more insights on the market size of various regions, Request Free Sample
The APAC the market is experiencing notable growth due to increasing consumer focus on environmental sustainability and the demand for eco-friendly packaging solutions. Market participants are responding by introducing compostable and biodegradable options. For instance, CHUK, an initiative of Yash Pakka (YPL), launched a new line of compostable delivery containers in February 2023. CHUK, a leading brand In the compostable tableware segment, boasts a reputable clientele, including Haldiram's, Bikanervala, and Chaipoint. These renowned brands trust CHUK for their food service packaging requirements, underscoring the brand's credibility and market influence. The market encompasses various sectors, including hospitals, marketing, lodgings, schools, offices, airports, food courts, cafes, hotels, restaurants, and online food delivery services.
Key trends include the use of recyclable, reusable, and sustainable packaging materials, such as paper, paperboard, bagasse, and biodegradable plastics. The market is also influenced by food safety regulations and consumer preferences for convenience, freshness, and eco-friendly alternatives. The ready-to-eat food industry, delivery services, and food packaging sectors are significant contributors to waste generation, making sustainable takeaway packaging a priority. Product innovations and high-barrier packaging solutions cater to the need for longer shelf life and food safety.
Market Dynamics
Our researchers analyzed the data with 2024 as the base year, along with the key drivers, trends, and challenges. A holistic analysis of drivers will help companies refine their marketing strategies to gain a competitive advantage.
What are the key market drivers leading to the rise In the adoption of Takeaway Containers Industry?
- Rapid urbanization is the key driver of the market.The market experiences significant growth due to the increasing urbanization trend, with approximately 4.4 billion people, representing 56% of the global population, currently residing in cities. This figure is projected to increase, with the urban population anticipated to more than double by 2050, resulting in nearly 70% of the world's population living in urban environments. Urbanization's economic impact, with cities generating over 80% of global GDP, fosters higher disposable incomes and a busy lifestyle, leading to increased demand for convenient food packaging solutions such as takeaway containers. The market is further driven by consumer preferences for eco-friendly alternatives, including biodegradable, recyclable, and reusable packaging, made from materials like bagasse, paperboard, and sustainable plastics.
Food safety and hygiene concerns also influence the market, with high-barrier packaging and sustainable takeaway containers gaining popularity to preserve freshness and ensure food safety. Additionally, food delivery apps and online food delivery services contribute to the market's growth, enabling consumers to easily access ready-to-eat meals and takeaway food products. The ready-to-eat food industry's increasing popularity, coupled with the environmental impacts of single-use takeout containers, further fuels the demand for sustainable food packaging solutions.
What are the market trends shaping the Takeaway Containers market?
- Focus on eco-friendly takeout containers is the upcoming market trend.The market is witnessing a shift towards eco-friendly solutions due to increasing consumer awareness and regulatory pressures. This trend is evident In the growing popularity of compostable and biodegradable takeaway containers. For instance, Good Natured Products Inc., based in Canada, launched its GoodToGo microwavable collection of compostable takeout containers in May 2023. These containers, certified by the Compost Manufacturing Alliance, are made of 97% plant-based materials and are suitable for various foodservice applications. They offer a sustainable alternative to traditional plastic containers, as they meet stringent compostability standards and are heat resistant. The use of eco-friendly packaging, such as reusable, recyclable, and biodegradable containers, is essential for reducing waste generation and minimizing the environmental impact of the food service industry.
This includes hospitals, lodgings, cafes, food courts, schools, offices, airports, and restaurants, among others. The convenience of takeaway services, coupled with the growing demand for ready-to-eat meals, has led to an increase In the production and use of takeaway containers. The market is also witnessing product innovations, such as high-barrier packaging, which ensures the freshness and food safety of takeaway food products. The use of sustainable and recycled materials in takeaway containers is a key focus area for manufacturers, as it aligns with consumer preferences for eco-friendly alternatives. Food safety and preserving the shelf life of food are crucial factors In the design and production of takeaway containers.
Food regulations play a significant role in ensuring the safety and quality of takeaway food packaging, and the use of sustainable and eco-friendly packaging is becoming a necessity rather than an option. The online food delivery sector, including food delivery apps and services, is also driving the demand for sustainable takeaway containers, as consumers increasingly opt for convenient and eco-friendly options.
What challenges does the Takeaway Containers Industry face during its growth?
- Regulatory compliance is a key challenge affecting the industry growth.The market is experiencing regulatory pressures due to growing concerns over food contamination and the environmental impact of single-use plastics. Hospitals, lodgings, schools, and other food service establishments are increasingly focusing on hygiene and sustainability. As a result, there is a rising demand for eco-friendly packaging alternatives, such as biodegradable and reusable containers made from materials like bagasse, paper, and paperboard. This shift is driven by consumer preferences for convenience and quality, as well as the growing popularity of online food delivery and food delivery apps. Food regulations are becoming more stringent, with many countries banning or restricting the use of plastic takeaway containers.
For instance, the European Union and several US states have implemented or plan to implement such bans. In October 2023, England enacted a comprehensive ban on single-use plastics, prohibiting their use in shops, takeaways, and food sellers. This trend is expected to continue, with more countries likely to follow suit. In response, food packaging manufacturers are innovating to meet the demand for sustainable takeaway containers. They are developing high-barrier packaging to ensure freshness and food safety, as well as recyclable and recycled materials for sustainable takeaway packaging. These product innovations are essential for food service restaurants, cafes, food courts, offices, airports, and other establishments that offer takeaway services and ready-to-eat meals.
By adopting eco-friendly alternatives, businesses can reduce waste generation, enhance their brand image, and meet evolving consumer expectations.
Exclusive Customer Landscape
The takeaway containers market forecasting report includes the adoption lifecycle of the market, covering from the innovator’s stage to the laggard’s stage. It focuses on adoption rates in different regions based on penetration. Furthermore, the takeaway containers market report also includes key purchase criteria and drivers of price sensitivity to help companies evaluate and develop their market growth analysis strategies.

Customer Landscape
Key Companies & Market Insights
Companies are implementing various strategies, such as strategic alliances, takeaway containers market forecast, partnerships, mergers and acquisitions, geographical expansion, and product/service launches, to enhance their presence In the industry.
Ace Packaging - This business specializes in supplying takeaway containers in diverse shapes and sizes, catering to various industry requirements. The containers are manufactured from plastic, ensuring durability and ease of use. Notably, they are disposable and eco-friendly, aligning with contemporary sustainability trends. These round and rectangular options provide flexibility for businesses to accommodate diverse food offerings. The containers' disposable nature reduces the need for extensive cleaning and maintenance, making them a practical choice for foodservice establishments. Additionally, their eco-friendly attributes contribute to a greener footprint, appealing to environmentally-conscious consumers.
The industry research and growth report includes detailed analyses of the competitive landscape of the market and information about key companies, including:
- Ace Packaging
- AS Food Packaging
- Bee Dee Plast
- Bhagat Plastics
- BioPak Pty Ltd.
- BTP Eco Products Pvt. Ltd
- Catering24 Ltd
- Colpac Limited
- Duni AB
- Genpak LLC
- Huizhou Yangrui Printing and Packaging Co Ltd
- MMP Corporation Ltd
- Natureplus Products
- Performance Container Manufacturers Inc
- Sai Packaging
- Shri Balaji Packers
- Standard Food Packaging
- Takeaway Packaging
- Weorex
- Wuhu Gongmingzhe Import and Export Trade Co Ltd
Qualitative and quantitative analysis of companies has been conducted to help clients understand the wider business environment as well as the strengths and weaknesses of key industry players. Data is qualitatively analyzed to categorize companies as pure play, category-focused, industry-focused, and diversified; it is quantitatively analyzed to categorize companies as dominant, leading, strong, tentative, and weak.
Research Analyst Overview
The takeaway container market encompasses a wide range of packaging solutions designed for the transportation and storage of ready-to-eat food products. This market caters to various industries, including hospitals, lodgings, cafes, food courts, schools, offices, airports, and restaurants, among others. The demand for takeaway containers is driven by the convenience they offer to consumers, particularly those with busy lifestyles. The market for takeaway containers is influenced by several factors. One significant trend is the increasing focus on eco-friendly and sustainable packaging solutions. Consumers are becoming increasingly conscious of the environmental impacts of their choices, leading to a growing preference for biodegradable, recyclable, and reusable packaging.
This trend is particularly pronounced In the food service industry, where food contamination and hygiene concerns are paramount. Eco-friendly alternatives to traditional plastic and paper takeaway containers are gaining popularity. For instance, bagasse-based containers made from sugarcane waste are a sustainable option that offers excellent insulation properties, ensuring the freshness and shelf life of food products. Similarly, high-barrier packaging made from paperboard and recycled materials is another sustainable option that offers excellent protection against moisture and oxygen, preserving the quality of food products. The ready-to-eat meals industry is a significant contributor to the takeaway container market. The convenience and flexibility offered by takeaway containers have made them an essential component of this industry.
However, food safety remains a critical concern, particularly In the context of food delivery and online food delivery services. As such, food regulations governing the production and use of takeaway containers are becoming increasingly stringent to ensure food safety and hygiene. The market for takeaway containers is also influenced by product innovations. For instance, the development of high-barrier packaging that can maintaIn the temperature and freshness of food products for extended periods is a significant innovation. Similarly, the use of eco-friendly materials such as biodegradable and recycled plastics and paper is another innovation that is gaining traction In the market.
In conclusion, the takeaway container market is a dynamic and evolving industry that caters to the growing demand for convenient and sustainable food packaging solutions. The market is influenced by various factors, including consumer preferences, food safety regulations, and product innovations. The trend towards eco-friendly and sustainable packaging solutions is expected to continue, with a growing focus on biodegradable, recyclable, and reusable packaging options.
|
Market Scope |
|
|
Report Coverage |
Details |
|
Page number |
207 |
|
Base year |
2024 |
|
Historic period |
2019-2023 |
|
Forecast period |
2025-2029 |
|
Growth momentum & CAGR |
Accelerate at a CAGR of 4.2% |
|
Market growth 2025-2029 |
USD 23.9 billion |
|
Market structure |
Fragmented |
|
YoY growth 2024-2025(%) |
4.0 |
|
Key countries |
US, China, India, Germany, Japan, Canada, UK, Australia, France, and Brazil |
|
Competitive landscape |
Leading Companies, Market Positioning of Companies, Competitive Strategies, and Industry Risks |
What are the Key Data Covered in this Takeaway Containers Market Research and Growth Report?
- CAGR of the Takeaway Containers industry during the forecast period
- Detailed information on factors that will drive the growth and forecasting between 2025 and 2029
- Precise estimation of the size of the market and its contribution of the industry in focus to the parent market
- Accurate predictions about upcoming growth and trends and changes in consumer behaviour
- Growth of the market across APAC, North America, Europe, Middle East and Africa, and South America
- Thorough analysis of the market’s competitive landscape and detailed information about companies
- Comprehensive analysis of factors that will challenge the takeaway containers market growth of industry companies
We can help! Our analysts can customize this takeaway containers market research report to meet your requirements.
 RIA -
RIA - 
