Latin America Telecommunications Battery Market Size 2025-2029
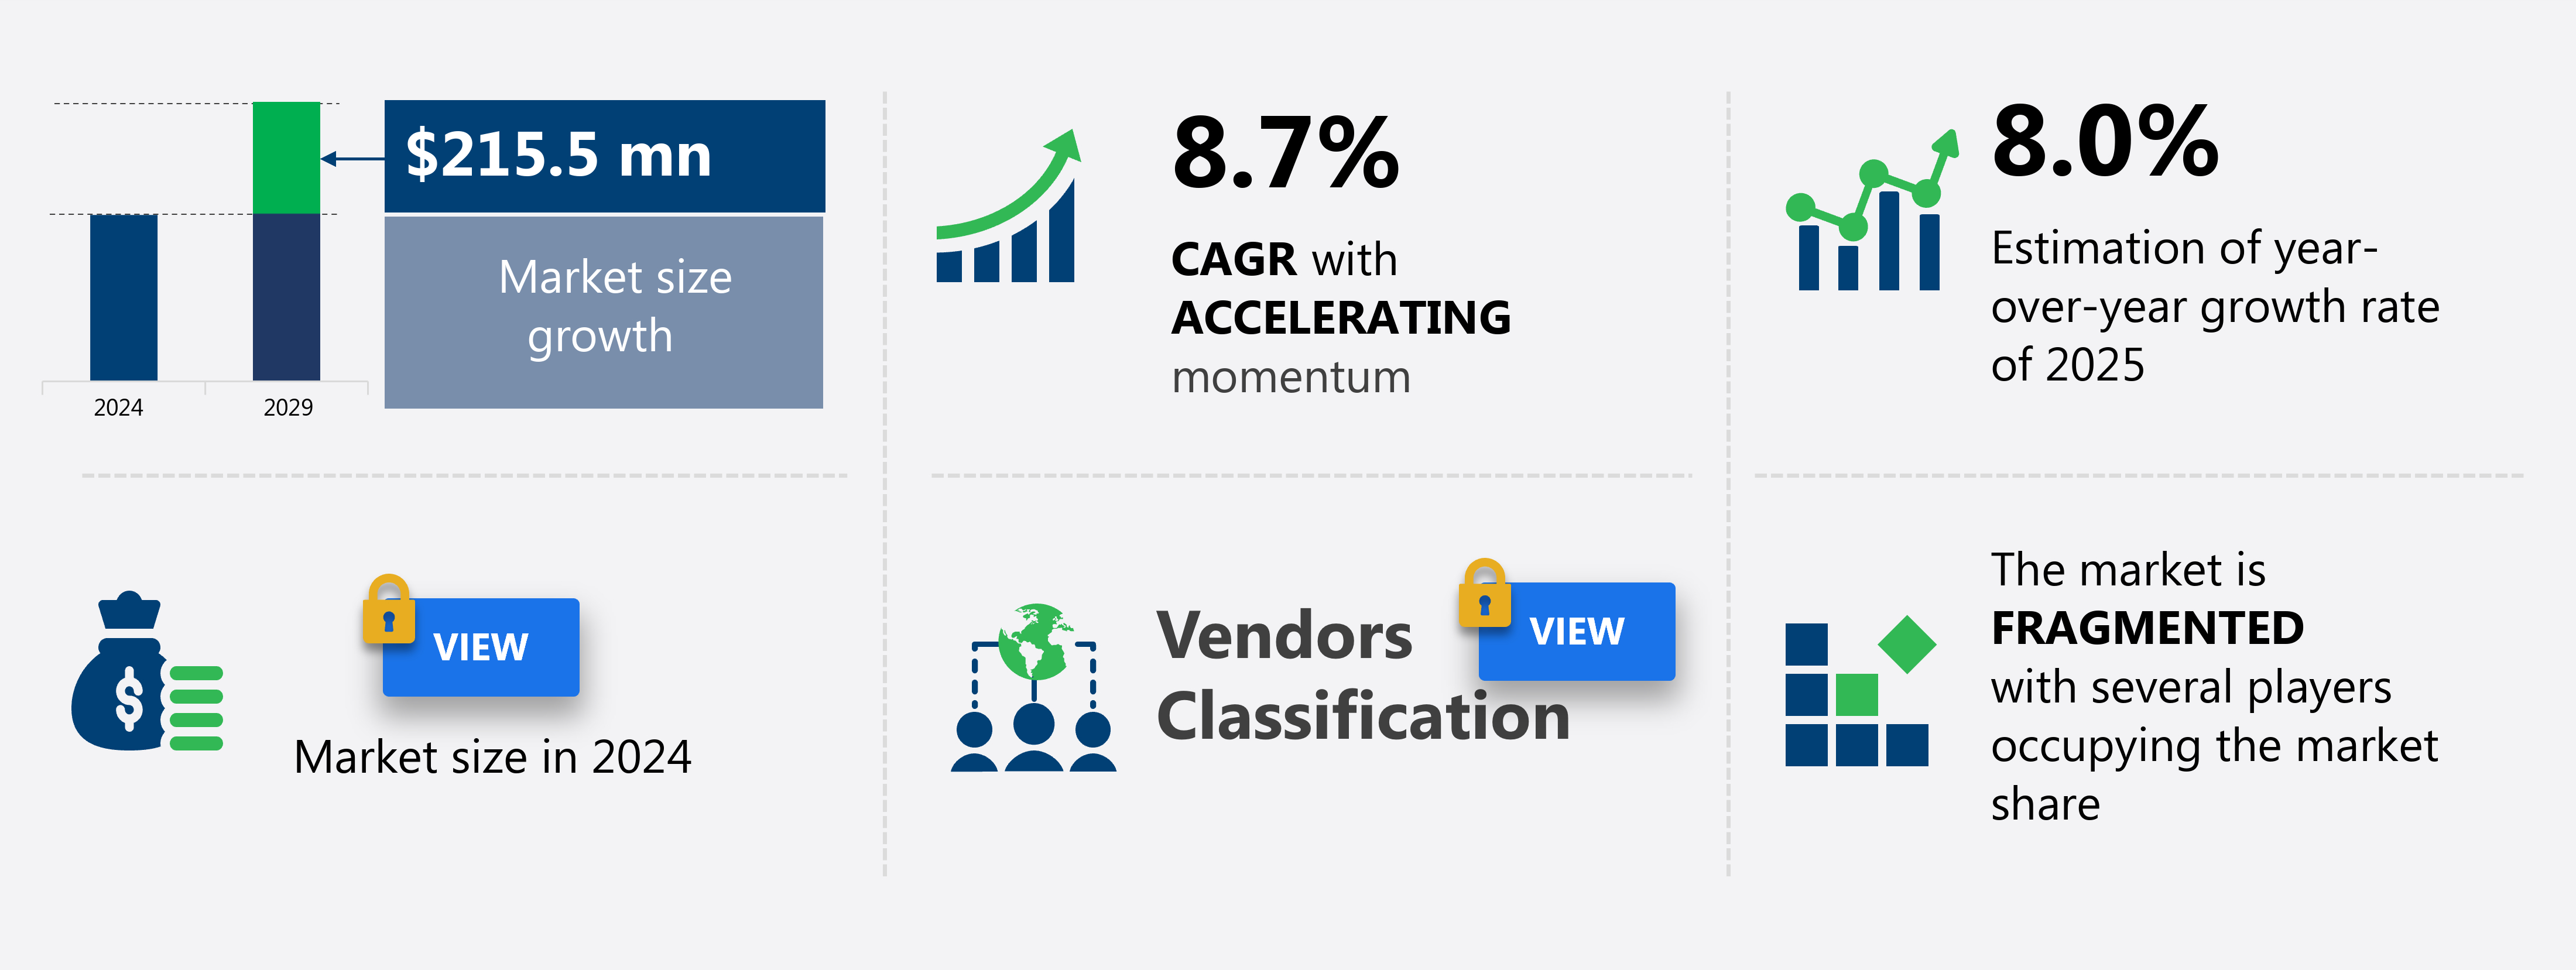
The telecommunications battery market size in Latin America is forecast to increase by USD 215.5 million at a CAGR of 8.7% between 2024 and 2029.
- The market is experiencing significant growth due to several key factors. The increasing power consumption In the telecommunications sector, driven by the expansion of 4G and 5G networks, is one such factor. Another trend is the rising need for rural electrification, which is leading to the adoption of off-grid solar solutions that require reliable batteries. Furthermore, the declining costs of lithium-ion batteries are making them an increasingly attractive option for telecom companies. These trends are expected to drive the growth of the market over the next few years. Additionally, the region's large and growing population, coupled with the increasing adoption of mobile devices, is creating a significant demand for reliable and efficient telecommunications infrastructure. Overall, the market is poised for growth, with several opportunities for stakeholders to capitalize on the emerging trends and challenges.
What will be the Size of the market During the Forecast Period?
- The market is experiencing significant growth due to the increasing demand for reliable power solutions In the telecom sector. With frequent power outages and harsh environmental conditions, telecom companies In the region require batteries that offer high efficiency, long-lasting power, and can withstand extreme temperatures. Traditional batteries are being replaced by advanced battery technology, such as lithium batteries, which offer superior performance and longer lifespan. The telecom industry in Latin America is witnessing a growth in the adoption of energy storage devices for backup power in telecom towers, data centers, and communication networks. The penetration of smartphones and the growing need for internet connectivity have further fueled the demand for telecom batteries.
- Ul and Un certification are essential for ensuring the quality and safety of these batteries. The telecom battery market in Latin America is expected to grow steadily due to the increasing focus on green telecom towers and the need for energy-efficient solutions. Power consumption is a critical concern for telecom companies, and the use of telecom batteries that offer low power consumption is becoming increasingly important. Overall, the market is poised for growth, driven by the need for reliable power solutions In the telecom sector.
How is this market segmented and which is the largest segment?
The market research report provides comprehensive data (region-wise segment analysis), with forecasts and estimates in "USD million" for the period 2025-2029, as well as historical data from 2019-2023 for the following segments.
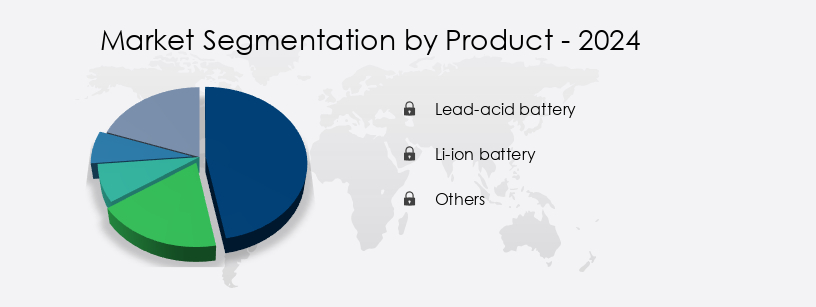
- Product
- Lead-acid battery
- Li-ion battery
- Others
- Capacity
- Low
- Medium
- High
- Geography
- Latin America
By Product Insights
- The lead-acid battery segment is estimated to witness significant growth during the forecast period.
The market is experiencing growth due to the increasing number of telecom towers In the region. Lead-acid batteries, a common power source in telecom applications, offer advantages such as large electrolyte reserves, resistance to corrosion, and rechargeable properties. Innovations in lead-acid battery technology, including the addition of carbon value, address concerns related to slow charging, short lifecycle, and maintenance requirements. Lithium batteries are also gaining popularity due to their long-lasting performance and ability to function in harsh conditions. Compliance with certifications such as UL and UN is essential for ensuring quality, safety, and reliability. The telecom sector's energy storage needs extend beyond batteries, encompassing data centers, communication networks, and backup power for computers and smartphones.
As the penetration of smartphones and internet connectivity increases, so does the demand for reliable power solutions. Environmental concerns and the integration of renewable energy sources, such as solar power systems, further influence the market's direction. Regulatory challenges and advancements in battery technologies, including lithium-ion and VRLA batteries, will continue to shape the telecom battery market in Latin America.
Get a glance at the market report of share of various segments Request Free Sample
Market Dynamics
Our Latin America Telecommunications Battery Market researchers analyzed the data with 2024 as the base year, along with the key drivers, trends, and challenges. A holistic analysis of drivers will help companies refine their marketing strategies to gain a competitive advantage.
What are the key market drivers leading to the rise in adoption of Latin America Telecommunications Battery Market?
Rising power consumption in telecommunications sector is the key driver of the market.
- Telecom batteries play a crucial role in ensuring uninterrupted communication services during power outages. In Latin America, where power consumption is on the rise due to population growth and urbanization, the demand for reliable power solutions In the telecommunications sector is increasing. The harsh conditions In the region, including extreme temperatures, pose challenges to the efficiency and life cycle of regular batteries. Advancements in battery technology, such as lithium batteries, offer longer-lasting and more efficient solutions for telecom applications. These batteries are ideal for use in telecom towers, data centers, and communication networks, where maintaining battery integrity is essential for performance and safety.
- The telecom industry's focus on energy storage devices for backup power and the penetration of smartphones and internet connectivity have boosted the demand for high-capacity batteries. However, regulatory challenges, such as UL and UN certifications, add to the complexity and cost of implementing these solutions. Moreover, the increasing adoption of renewable energy sources, such as solar power systems, and the need for green telecom towers have further fueled the growth of the telecom battery market in Latin America. Despite the benefits, the high cost of cooling systems for high-temperature environments and performance degradation at standard conditions remain concerns.
- Thus, the telecom battery market in Latin America is driven by the need for reliable power solutions to meet the increasing demand for communication services In the region. The adoption of advanced battery technologies, such as lithium batteries, and the integration of renewable energy sources offer opportunities for growth, while regulatory challenges and cooling costs pose challenges to market expansion.
What are the market trends shaping the Latin America Telecommunications Battery Market?
Increasing need for rural electrification is the upcoming trend In the market.
- Telecom batteries play a crucial role in ensuring uninterrupted communication services in Latin America, where power outages are common due to the region's economic development and limited electricity infrastructure. The telecommunications industry's reliance on reliable power solutions is essential for computer systems, 5G networks, data centers, and communication networks. Telecom batteries must perform efficiently in harsh conditions, including extreme temperatures, to maintain battery integrity and prevent performance degradation. Battery technology, such as lithium batteries, offers long-lasting solutions for the telecom sector. UL and UN certifications ensure quality and safety, while considering the life cycle and reliability of various battery types, including VRLA batteries, lithium-ion batteries, and lead-acid batteries.
- The penetration of smartphones and the demand for internet connectivity have increased the importance of energy storage devices as backup power for telecom towers. Environmental concerns and the adoption of renewable energy sources, such as solar power systems, have influenced the telecom battery market. Regulatory challenges and the integration of battery technologies, including low, medium, and high capacity batteries, are essential for the industry's growth. The telecom sector's focus on reducing power consumption through green telecom towers and minimizing cooling costs further highlights the importance of energy-efficient battery solutions.
What challenges does the Latin America Telecommunications Battery Market face during the growth?
Declining costs of lithium-ion batteries is a key challenge affecting the market growth.
- Telecom batteries play a crucial role in ensuring uninterrupted communication networks during power outages. In the telecommunications industry, both lead-acid and lithium-ion batteries are used, each with distinct advantages. Lead-acid batteries are favored due to their cost-effectiveness and ability to deliver a high burst of power for cranking applications. However, lithium-ion batteries are gaining popularity for their superior performance, including higher current density, longer power-holding capacity, and longer shelf life. The cost difference between these battery chemistries has narrowed significantly over the past decade, driven by increased manufacturing efficiency and the widespread adoption of battery technology In the automotive sector.
- Lithium-ion batteries' advantages, such as reliability, performance, and longer life cycle, make them increasingly preferred In the telecom sector, particularly in extreme temperatures and for 5G applications. The telecom battery market is expected to grow as the penetration of smartphones and the demand for internet connectivity continue to increase, along with the regulatory challenges and environmental concerns driving the adoption of renewable energy and energy storage devices for backup power. Lithium-ion batteries, with their high energy density and long life span, are well-positioned to meet these demands while reducing cooling costs associated with traditional lead-acid batteries.
Exclusive Customer Landscape
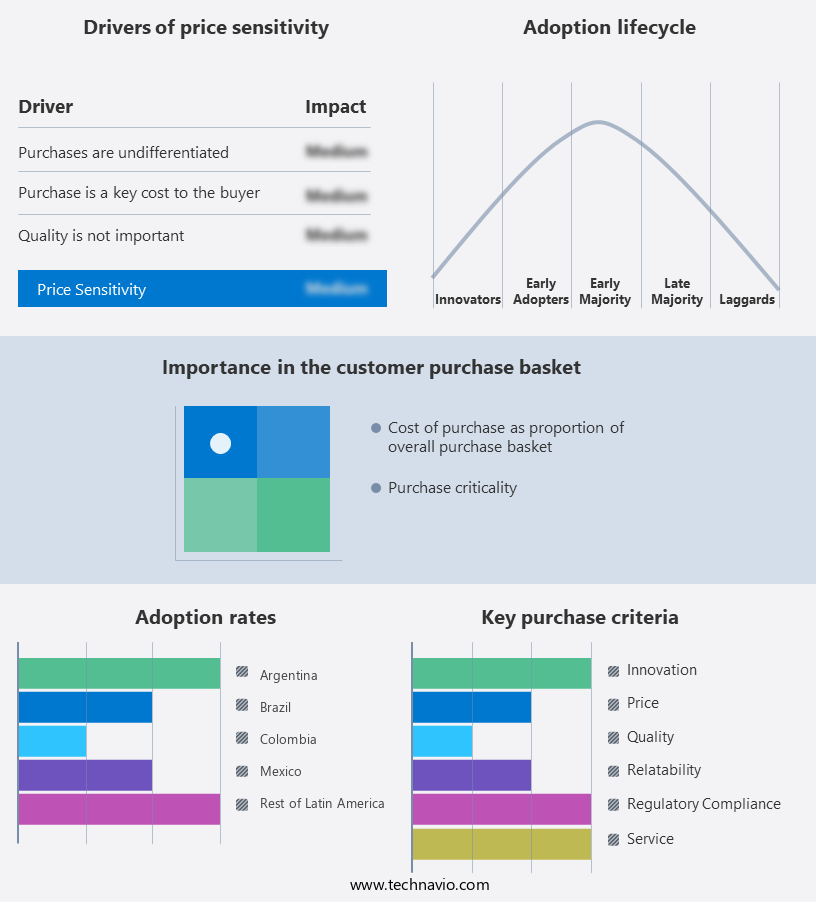
The market forecasting report includes the adoption lifecycle of the market, covering from the innovator's stage to the laggard's stage. It focuses on adoption rates in different regions based on penetration. Furthermore, the market report also includes key purchase criteria and drivers of price sensitivity to help companies evaluate and develop their market growth analysis strategies.
Customer Landscape
Key Companies & Market Insights
Companies are implementing various strategies, such as strategic alliances, market forecast, partnerships, mergers and acquisitions, geographical expansion, and product/service launches, to enhance their presence In the market.
Accumulatorenwerke HOPPECKE Carl Zoellner and Sohn GmbH - The company offers telecommunications batteries such as grid Xtreme VR, grid power FNC, and grid Xtreme VR green series.
The market research and growth report includes detailed analyses of the competitive landscape of the market and information about key companies, including:
- BYD Co. Ltd.
- C and D Technologies Inc.
- East Penn Manufacturing Co. Inc.
- EnerSys
- ETERNITY TECHNOLOGIES FZ LLC
- Exide Technologies
- GS Yuasa International Ltd.
- Hitachi Ltd.
- Leoch International Technology Ltd.
- LG Chem Ltd.
- Panasonic Holdings Corp.
- Polarium Energy Solutions AB
- Power Sonic Corp.
- Resonac Holdings Corp.
- Samsung SDI Co. Ltd.
- Shandong Sacred Sun Power Sources Co. Ltd.
- TotalEnergies SE
- Victron Energy BV
- Zhejiang Narada Power Source Co. Ltd.
Qualitative and quantitative analysis of companies has been conducted to help clients understand the wider business environment as well as the strengths and weaknesses of key market players. Data is qualitatively analyzed to categorize companies as pure play, category-focused, industry-focused, and diversified; it is quantitatively analyzed to categorize companies as dominant, leading, strong, tentative, and weak.
Research Analyst Overview
Telecommunications batteries play a crucial role in ensuring the uninterrupted operation of communication networks in Latin America. These batteries provide backup power to telecom towers, data centers, and other critical infrastructure, enabling the reliable transmission and reception of voice, data, and multimedia services. The telecom battery market in Latin America is driven by several factors. One of the primary factors is the increasing demand for internet connectivity and the proliferation of smartphones. As more people In the region adopt digital technologies, the need for reliable power solutions becomes more pressing. Another factor is the harsh environmental conditions in many parts of Latin America.
Telecom batteries must be able to perform effectively in extreme temperatures, high humidity, and other challenging conditions. Lithium batteries, with their high energy density and long cycle life, have gained popularity in the telecom battery market due to their ability to withstand these conditions. Battery technology is constantly evolving, and telecom companies in Latin America are investing in advanced energy storage devices to improve efficiency and reduce power consumption. VRLA batteries, for instance, offer high reliability and performance, making them a popular choice for telecom applications. Safety and quality are paramount In the telecom battery market. Batteries must meet stringent safety standards, such as UL and UN certification, to ensure the safety of personnel and the integrity of the battery itself.
In addition, the market is experiencing significant growth, driven by the increasing demand for backup power applications in regions facing frequent power outages. Lithium-ion batteries, offering fast charge applications, have become essential for uninterrupted connectivity in advanced communication systems and 5G network operations. The rise of smartphone penetration and smartphone battery demand has led to increased need for battery life and high-quality telecom batteries. Energy storage capacity is crucial for data centers and internet servers, ensuring reliable battery life and high power output. With the focus on green energy solutions, battery recycling, and sustainability initiatives, Latin America is poised for innovation in battery management and energy efficiency. Additionally, content optimization and monitoring of battery performance in telecommunication industry are key for reducing operating costs and improving power consumption reduction.
Further, Lithium-ion battery technology has become a key solution for UPS applications, providing reliable and efficient power to telephone networks and internet servers. The initial cost of these batteries is offset by their long-term benefits, including high data speed and reliable power for computer networks. As telephone networks evolve, the market scenario is further influenced by the fluctuating li-ion battery prices, driving both innovation and competition in the industry. Additionally, the rise of IoT applications has led to an increasing demand for sustainable, green solutions, including greens initiatives.
|
Market Scope |
|
|
Report Coverage |
Details |
|
Page number |
182 |
|
Base year |
2024 |
|
Historic period |
2019-2023 |
|
Forecast period |
2025-2029 |
|
Growth momentum & CAGR |
Accelerate at a CAGR of 8.7% |
|
Market growth 2025-2029 |
USD 215.5 million |
|
Market structure |
Fragmented |
|
YoY growth 2024-2025(%) |
8.0 |
|
Key countries |
Brazil, Mexico, Colombia, Argentina, and Rest of Latin America |
|
Competitive landscape |
Leading Companies, Market Positioning of Companies, Competitive Strategies, and Industry Risks |
What are the Key Data Covered in this Market Research and Growth Report?
- CAGR of the market during the forecast period
- Detailed information on factors that will drive the market growth and forecasting between 2025 and 2029
- Precise estimation of the size of the market and its contribution of the market in focus to the parent market
- Accurate predictions about upcoming market growth and trends and changes in consumer behaviour
- Growth of the market across Latin America
- Thorough analysis of the market's competitive landscape and detailed information about companies
- Comprehensive analysis of factors that will challenge the growth of market companies
We can help! Our analysts can customize this market research report to meet your requirements. Get in touch
 RIA -
RIA - 
