
Tequila Seltzers Market Size 2025-2029
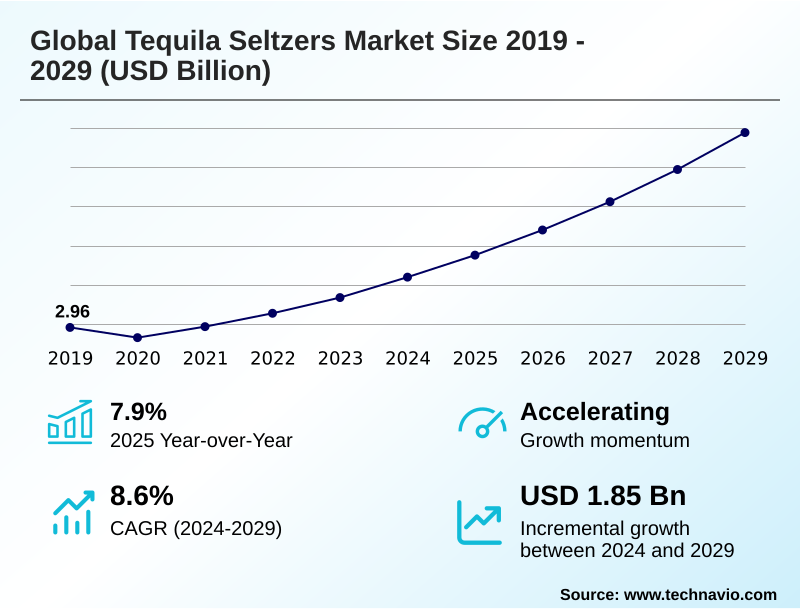
The tequila seltzers market size is valued to increase by USD 1.85 billion, at a CAGR of 8.6% from 2024 to 2029. Growing sophistication of consumer palates and flavor innovation will drive the tequila seltzers market.
Major Market Trends & Insights
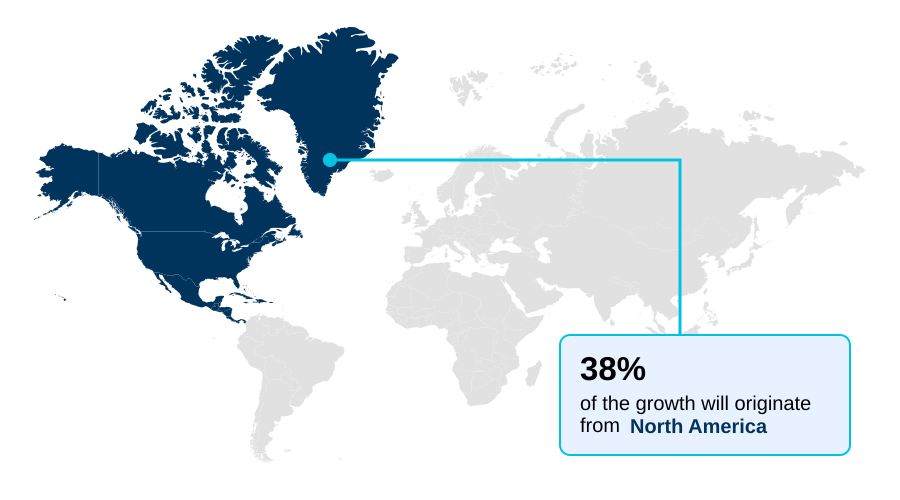
- North America dominated the market and accounted for a 38.5% growth during the forecast period.
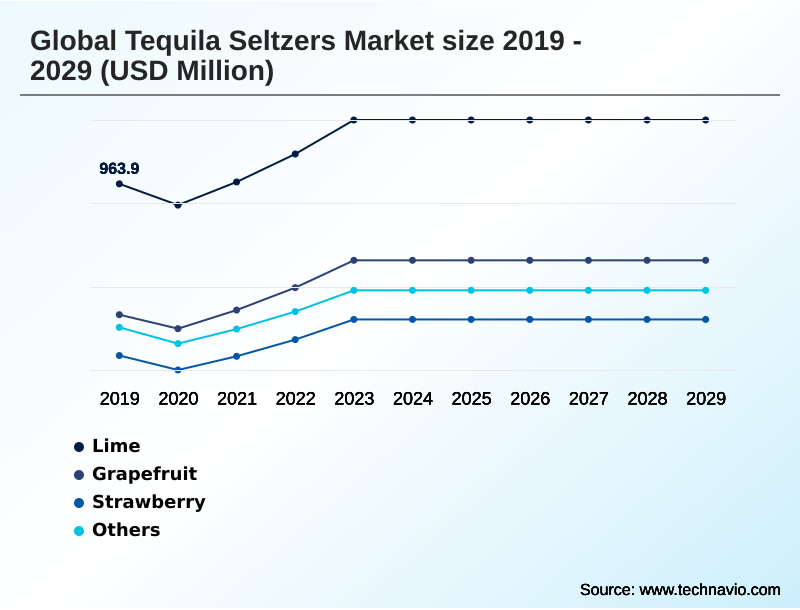
- By Flavor - Lime segment was valued at USD 1.09 billion in 2023
- By Distribution Channel - Off-trade segment accounted for the largest market revenue share in 2023
Market Size & Forecast
- Market Opportunities: USD 2.49 billion
- Market Future Opportunities: USD 1.85 billion
- CAGR from 2024 to 2029 : 8.6%
Market Summary
- The tequila seltzers market is defined by a convergence of consumer demand for convenience, premium ingredients, and healthier alcoholic options. This category leverages the cultural cachet of tequila, repositioning it within the rapidly expanding ready-to-drink space.
- Key market dynamics are shaped by relentless rtd flavor innovation, moving beyond simple citrus to include exotic fruit and botanical infusions that create a sophisticated taste profile. The premiumization trend is a significant driver, with an emphasis on 100% agave tequila and clean label beverage formulations appealing to discerning consumers.
- However, the market faces challenges from intense competition, which impacts product shelf visibility and pricing strategies, alongside the persistent issue of agave supply volatility. For instance, a brand manager must navigate these factors by utilizing consumer data to develop a unique spicy cocktail profile that balances brand authenticity perception with novel tastes.
- This strategic product development is essential for differentiation in a crowded retail environment, ensuring that new offerings resonate with the modern consumer's desire for both quality and novelty in a sessionable cocktail format.
What will be the Size of the Tequila Seltzers Market during the forecast period?
Get Key Insights on Market Forecast (PDF) Request Free Sample
How is the Tequila Seltzers Market Segmented?
The tequila seltzers industry research report provides comprehensive data (region-wise segment analysis), with forecasts and estimates in "USD million" for the period 2025-2029, as well as historical data from 2019-2023 for the following segments.
- Flavor
- Lime
- Grapefruit
- Strawberry
- Others
- Distribution channel
- Off-trade
- On-trade
- Packaging
- Cans
- Bottles
- Geography
- North America
- US
- Canada
- Mexico
- Europe
- UK
- Germany
- France
- APAC
- Australia
- Japan
- China
- South America
- Brazil
- Argentina
- Colombia
- Middle East and Africa
- South Africa
- UAE
- Saudi Arabia
- Rest of World (ROW)
- North America
By Flavor Insights
The lime segment is estimated to witness significant growth during the forecast period.
The lime flavor segment is foundational to the spirit-based rtd market, driven by its classic pairing with agave spirit. This flavor's dominance reflects consumer purchasing behavior, where a crisp, sophisticated taste profile is a key driver for this sessionable cocktail.
It serves as an accessible entry point for those exploring alternatives to a craft cocktail, establishing a benchmark for brand authenticity perception. The use of natural fruit flavors in tequila blanco seltzers is critical to meeting quality expectations.
Reflecting the focus on rtd flavor innovation, analysis shows that lime variants are featured in over 90% of multipack offerings, underscoring their strategic importance for securing retail placement and driving volume.
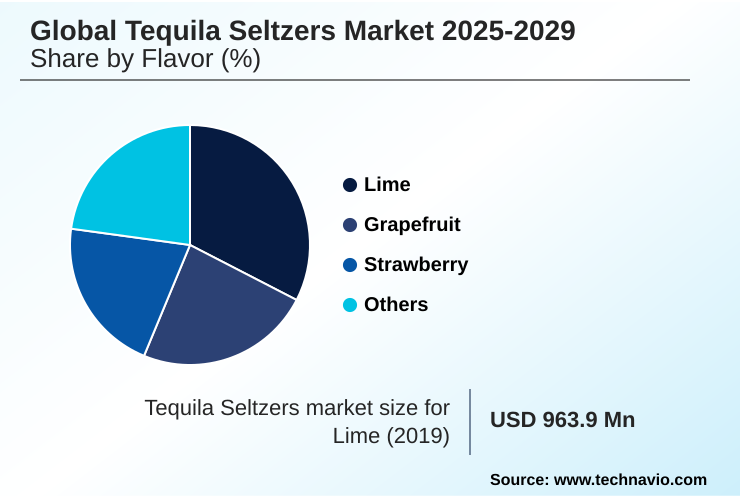
The Lime segment was valued at USD 1.09 billion in 2023 and showed a gradual increase during the forecast period.
Regional Analysis
North America is estimated to contribute 38.5% to the growth of the global market during the forecast period.Technavio’s analysts have elaborately explained the regional trends and drivers that shape the market during the forecast period.
See How Tequila Seltzers Market Demand is Rising in North America Request Free Sample
The geographic landscape is led by North America, which represents the market's largest opportunity zone, contributing over 38% of global demand, while the APAC market demonstrates the most rapid adoption rate.
This expansion is supported by the growing availability of the ready-to-drink format across both off-trade distribution and on-trade distribution channels.
The proliferation of e-commerce alcohol platforms and on-demand beverage delivery services has been critical in enhancing expanded retail accessibility across diverse beverage alcohol categories.
In high-velocity markets, regional distribution hubs are leveraging predictive analytics, improving inventory turnover by 15% and ensuring consistent product shelf visibility for products made with 100% agave tequila. This optimization addresses the at-home consumption trend by satisfying immediate consumer demand.
Market Dynamics
Our researchers analyzed the data with 2024 as the base year, along with the key drivers, trends, and challenges. A holistic analysis of drivers will help companies refine their marketing strategies to gain a competitive advantage.
- Consumer decisions are increasingly shaped by nuanced comparisons, such as tequila seltzer vs hard seltzer and tequila seltzer vs vodka seltzer, where the spirit base is a key differentiator. The choice of tequila matters, with inquiries about the best blanco tequila for seltzers becoming more common, signaling a demand for quality.
- Health-conscious consumers actively seek out zero sugar tequila seltzer options and the low calorie tequila cocktail can, making a gluten-free sessionable alcohol choice a priority. The market for organic blue weber agave seltzers is growing as ingredient transparency becomes crucial, leading to debates on natural fruit vs artificial flavor.
- Economically, the agave price impact on rtd cost is a significant factor for both producers and consumers. Market dynamics are further influenced by celebrity brand influence on seltzers and emerging spicy tequila seltzer flavor trends. This activity is elevating the entire premium spirit-based rtd market.
- Success depends on a robust strategy for off-trade channels for canned cocktails and the on-trade tequila seltzer strategy. Innovation in tequila seltzer packaging sustainability and ensuring a stable tequila seltzer shelf life are also critical. Many craft tequila seltzer producers are gaining traction by offering a superior ready to drink tequila paloma made with 100 percent agave tequila.
- Brands focusing on tequila seltzer ingredient transparency see a measurable lift in consumer trust, which correlates to a 20% lower marketing cost per acquisition.
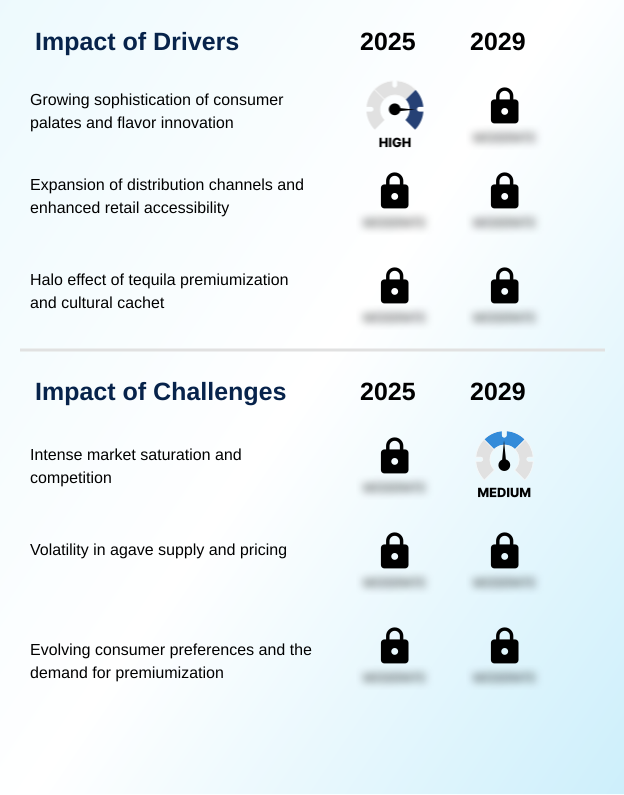
What are the key market drivers leading to the rise in the adoption of Tequila Seltzers Industry?
- The growing sophistication of consumer palates, coupled with relentless flavor innovation, serves as a key driver for market expansion.
- Market growth is fueled by the inherent appeal of the convenient beverage format, which aligns with modern lifestyles and the demand for the on-the-go alcoholic drink.
- The use of premium ingredients, including reposado tequila and organic agave nectar in canned cocktails, offers a sophisticated cocktail-style experience. This gluten-free alcoholic beverage category benefits from artisanal beverage production methods that resonate with consumers.
- The rise of the social drinking occasion at home has solidified the category's position, with multipack formats outperforming single-unit sales by a 3-to-1 ratio.
- The expansion of spirit-based hard seltzer into new retail channels has increased trial rates for emerging brands by 25%, highlighting the importance of accessibility.
What are the market trends shaping the Tequila Seltzers Industry?
- The ascendancy of health and wellness in consumer choice represents a significant upcoming market trend, driving demand for beverages with healthier attributes.
- Key trends are reshaping the market, led by beverage premiumization and a strong consumer wellness focus. This shift is creating significant demand for the low-calorie alcoholic option and low-sugar spirit mixer, with brands emphasizing clean label beverage attributes reporting a 30% higher repeat purchase rate.
- The influence of the celebrity-endorsed spirit is undeniable, with these lines achieving market penetration 50% faster than non-endorsed launches. This trend elevates products to an aspirational lifestyle beverage status, fostering experiential consumption.
- Premium brand positioning is further enhanced by rtd flavor innovation, particularly the use of exotic fruit infusion to create a unique spirit-based hard seltzer, which is critical for maintaining brand authenticity perception.
What challenges does the Tequila Seltzers Industry face during its growth?
- Intense market saturation and escalating competition present a key challenge affecting sustainable industry growth.
- Significant challenges persist, primarily stemming from agave supply volatility, which has caused input cost fluctuations of over 60% in a single year, disrupting financial planning. This uncertainty pressures producers to maintain authentic production methods using quality blue weber agave while managing costs.
- The quest for transparent ingredient sourcing is now a consumer mandate, affecting everything from spirit-base quality to the inclusion of botanical flavor infusion and spicy cocktail profile elements. Intense competition for product shelf visibility in off-trade distribution requires promotional spending that can erode margins by up to 15%.
- This environment makes it difficult for brands to differentiate based on quality, impacting consumer purchasing behavior.
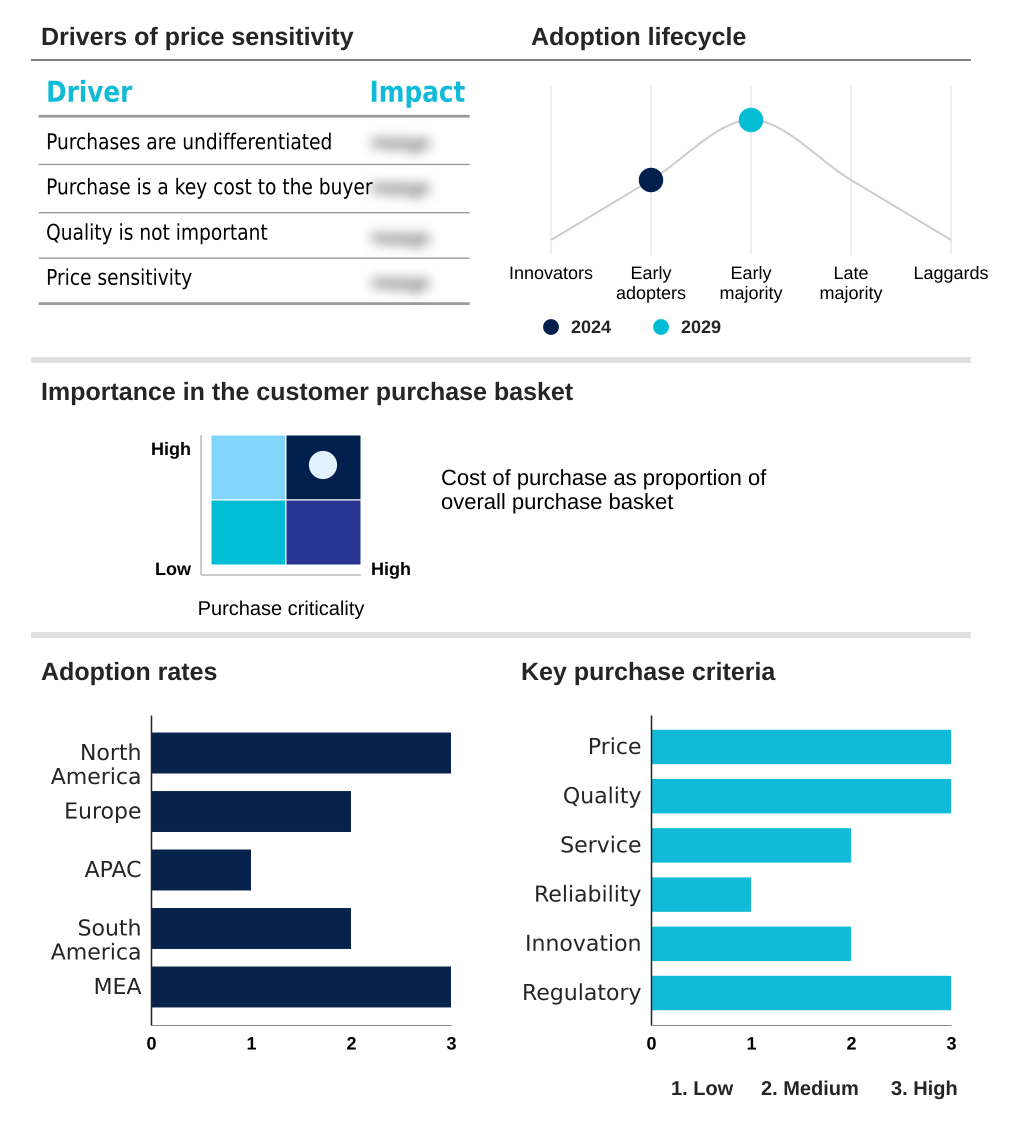
Exclusive Technavio Analysis on Customer Landscape
The tequila seltzers market forecasting report includes the adoption lifecycle of the market, covering from the innovator’s stage to the laggard’s stage. It focuses on adoption rates in different regions based on penetration. Furthermore, the tequila seltzers market report also includes key purchase criteria and drivers of price sensitivity to help companies evaluate and develop their market growth analysis strategies.
Customer Landscape of Tequila Seltzers Industry
Competitive Landscape
Companies are implementing various strategies, such as strategic alliances, tequila seltzers market forecast, partnerships, mergers and acquisitions, geographical expansion, and product/service launches, to enhance their presence in the industry.
Becle SAB de CV - Key offerings consist of ready-to-drink tequila seltzers, blending tequila with sparkling water and fruit flavors for consumer convenience and authentic taste experiences.
The industry research and growth report includes detailed analyses of the competitive landscape of the market and information about key companies, including:
- Becle SAB de CV
- Constellation Brands Inc.
- Cutwater Spirits LLC
- Diageo PLC
- Dulce Vida Tequila
- E. and J. Gallo Winery
- Epic Western Cocktail Co.
- Que Onda Beverage Inc.
- Ranch Rider Spirits Co.
- Spirited Hive
- The Boston Beer Co. Inc.
- The Mark Anthony Group of Co.
- Two Chicks Drinks LLC.
- Viva Beverages Inc.
- Wholesome Spirits Inc.
- Yacht Water LLC
Qualitative and quantitative analysis of companies has been conducted to help clients understand the wider business environment as well as the strengths and weaknesses of key industry players. Data is qualitatively analyzed to categorize companies as pure play, category-focused, industry-focused, and diversified; it is quantitatively analyzed to categorize companies as dominant, leading, strong, tentative, and weak.
Recent Development and News in Tequila seltzers market
- In September, 2024, The Boston Beer Co. Inc. announced a strategic partnership with a premium artisanal tequila distillery in Jalisco, Mexico, to secure a dedicated supply of 100% blue weber agave for its Truly Tequila Soda line, enhancing its ingredient transparency claims.
- In November, 2024, Constellation Brands Inc. completed a significant expansion of its Mexican production facility, increasing its ready-to-drink canning capacity by 40% to meet escalating demand for its Mi Campo and Casa Noble tequila seltzer products.
- In February, 2025, Diageo PLC launched a new ultra-premium tequila seltzer range under its Casamigos brand, featuring unique botanical infusions and packaged in sustainable glass bottles to target the high-end, on-trade channel.
- In April, 2025, E. and J. Gallo Winery acquired Ranch Rider Spirits Co., a craft producer known for its reposado tequila-based seltzers, signaling a strategic move to capture market share in the premium, authentic RTD segment.
Dive into Technavio’s robust research methodology, blending expert interviews, extensive data synthesis, and validated models for unparalleled Tequila Seltzers Market insights. See full methodology.
| Market Scope | |
|---|---|
| Page number | 286 |
| Base year | 2024 |
| Historic period | 2019-2023 |
| Forecast period | 2025-2029 |
| Growth momentum & CAGR | Accelerate at a CAGR of 8.6% |
| Market growth 2025-2029 | USD 1847.8 million |
| Market structure | Fragmented |
| YoY growth 2024-2025(%) | 7.9% |
| Key countries | US, Canada, Mexico, UK, Germany, France, Spain, Italy, The Netherlands, Australia, Japan, China, India, South Korea, Indonesia, Brazil, Argentina, Colombia, South Africa, UAE, Saudi Arabia, Turkey and Israel |
| Competitive landscape | Leading Companies, Market Positioning of Companies, Competitive Strategies, and Industry Risks |
Research Analyst Overview
- The market is rapidly evolving, driven by the demand for spirit-based rtd products that utilize authentic ingredients like blue weber agave and 100% agave tequila. The distinction between tequila blanco and reposado tequila in these canned cocktails allows for greater flavor complexity.
- A core consumer expectation is for clean label beverage formulations with natural fruit flavors and, increasingly, organic agave nectar, positioning these as a premium gluten-free alcoholic beverage. Successful brands master both on-trade distribution and off-trade distribution, navigating a landscape where strategic partnerships are crucial.
- The overarching beverage premiumization trend requires authentic production methods and transparent ingredient sourcing to stand out among diverse beverage alcohol categories. However, the entire sector is subject to agave supply volatility, a primary risk factor. Companies that have successfully managed this challenge through strategic sourcing have demonstrated a 10% improvement in margin stability.
- This focus on a quality agave spirit within a ready-to-drink format defines the competitive frontier for the spirit-based hard seltzer segment.
What are the Key Data Covered in this Tequila Seltzers Market Research and Growth Report?
-
What is the expected growth of the Tequila Seltzers Market between 2025 and 2029?
-
USD 1.85 billion, at a CAGR of 8.6%
-
-
What segmentation does the market report cover?
-
The report is segmented by Flavor (Lime, Grapefruit, Strawberry, and Others), Distribution Channel (Off-trade, and On-trade), Packaging (Cans, and Bottles) and Geography (North America, Europe, APAC, South America, Middle East and Africa)
-
-
Which regions are analyzed in the report?
-
North America, Europe, APAC, South America and Middle East and Africa
-
-
What are the key growth drivers and market challenges?
-
Growing sophistication of consumer palates and flavor innovation, Intense market saturation and competition
-
-
Who are the major players in the Tequila Seltzers Market?
-
Becle SAB de CV, Constellation Brands Inc., Cutwater Spirits LLC, Diageo PLC, Dulce Vida Tequila, E. and J. Gallo Winery, Epic Western Cocktail Co., Que Onda Beverage Inc., Ranch Rider Spirits Co., Spirited Hive, The Boston Beer Co. Inc., The Mark Anthony Group of Co., Two Chicks Drinks LLC., Viva Beverages Inc., Wholesome Spirits Inc. and Yacht Water LLC
-
Market Research Insights
- The market is shaped by a dynamic interplay of convenience and premiumization, with on-demand beverage delivery platforms accelerating brand discovery. This aspirational lifestyle beverage category is driven by experiential consumption, where quality and narrative are paramount. A focus on brand authenticity perception has proven critical, with brands transparent about their artisanal beverage production methods achieving 25% higher consumer retention rates.
- Furthermore, the strategic use of e-commerce alcohol platforms for targeted launches has reduced go-to-market timelines by 40% compared to traditional retail-first strategies. As the at-home consumption trend solidifies, the emphasis on a sophisticated taste profile continues to drive consumer purchasing behavior toward more premium options.
We can help! Our analysts can customize this tequila seltzers market research report to meet your requirements.
 RIA -
RIA - 
