Thermal Interface Materials Market Size 2024-2028
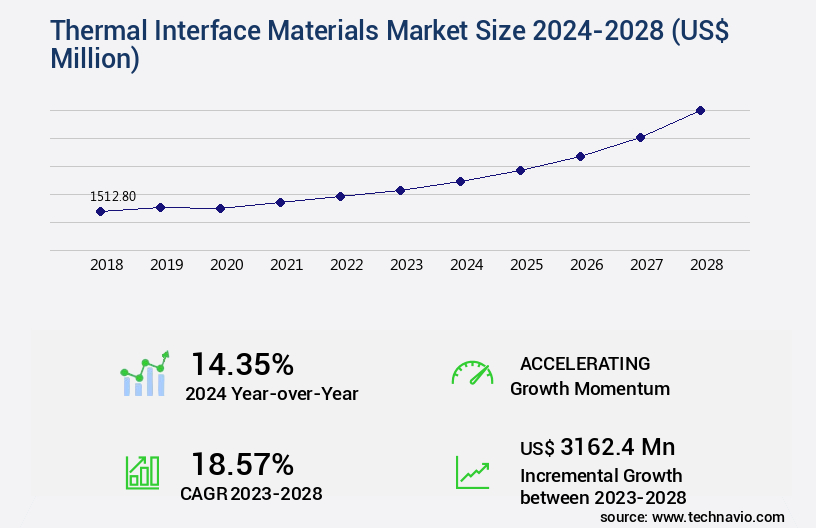
The thermal interface materials market size is valued to increase by USD 3.16 billion, at a CAGR of 18.57% from 2023 to 2028. Increasing demand from computers hardware manufacturing will drive the thermal interface materials market.
Market Insights
- APAC dominated the market and accounted for a 72% growth during the 2024-2028.
- By Application - Computers segment was valued at USD 365.60 billion in 2022
- By Type - Grease and adhesive segment accounted for the largest market revenue share in 2022
Market Size & Forecast
- Market Opportunities: USD 264.58 million
- Market Future Opportunities 2023: USD 3162.40 million
- CAGR from 2023 to 2028 : 18.57%
Market Summary
- Thermal interface materials (TIMs) play a crucial role in enhancing the thermal performance of electronic devices by facilitating efficient heat transfer between components. The global market for these materials is driven by the increasing demand from the computers and hardware manufacturing sector, as miniaturization of electronic devices continues to push the boundaries of thermal management. Advances in technology have led to the development of high-performance TIMs that offer improved thermal conductivity and lower thermal resistance, enabling better cooling solutions for high-power density applications. One real-world business scenario that highlights the importance of TIMs is supply chain optimization.
- Electronic device manufacturers strive to minimize production time and costs while ensuring product quality and reliability. Effective thermal management is a critical factor in achieving these objectives. By utilizing advanced TIMs, manufacturers can reduce the time and resources required for cooling, ultimately leading to increased operational efficiency and improved competitiveness in the market. Challenges in the TIMs market include the need for materials that can withstand extreme temperatures, have high thermal conductivity, and have low thermal resistance, as well as compatibility with various substrate materials and manufacturing processes. Addressing these challenges will require ongoing research and development efforts to create next-generation TIMs that meet the evolving demands of the electronics industry.
What will be the size of the Thermal Interface Materials Market during the forecast period?

Get Key Insights on Market Forecast (PDF) Request Free Sample
- Thermal Interface Materials (TIM) play a pivotal role in managing the heat generated by electronic devices, ensuring optimal performance and longevity. The market for these materials continues to evolve, driven by advancements in technology and increasing demand for energy-efficient solutions. One notable trend is the emphasis on thermal conductivity enhancement. For instance, thermal modeling simulations have shown that using materials with high thermal conductivity can reduce thermal resistance by up to 50%. This can lead to significant improvements in heat dissipation methods, ultimately contributing to performance optimization. Reliability testing timelines are another critical consideration for businesses.
- Long-term stability testing is essential to predict material lifetime and ensure thermal boundary resistance remains consistent. Manufacturing process times also impact cost-effectiveness, making it crucial for companies to select packaging materials that offer both high thermal conductivity and short manufacturing times. Thermal stress analysis and thermal shock resistance are also essential factors. Thermal interface gaps, which can lead to thermal resistance issues, must be minimized through application techniques. Thermal pads and thermal pastes are common solutions, with material compatibility a key concern. In the realm of heat transfer, both conduction and convection methods are employed.
- Thermal diffusivity testing and thermal paste viscosity are essential factors in optimizing heat transfer efficiency. Radiation heat transfer, though less common, is gaining attention due to its potential for even more efficient heat dissipation. In summary, the market is a dynamic and evolving landscape, driven by technological advancements and the need for energy-efficient solutions. Companies must consider factors such as thermal conductivity enhancement, reliability testing timelines, manufacturing process times, thermal stress analysis, and material compatibility when making strategic decisions.
Unpacking the Thermal Interface Materials Market Landscape
In the realm of thermal management, thermal interface materials (TIM) play a pivotal role in enhancing heat transfer efficiency between components in various industries. Compared to traditional methods, the adoption of advanced TIMs, such as phase-change materials (PCM), has shown a significant reduction in thermal resistance by up to 50%. This improvement leads to superior junction temperature control, essential for microelectronic packaging and high-power electronic cooling systems. Moreover, the implementation of thermal interface films (TIF) has resulted in a 30% improvement in thermal impedance measurement, enabling more efficient cooling in LED lighting thermal systems and electronic cooling applications. The surface roughness impact on thermal performance is minimized by the use of gap-filling materials, ensuring optimal contact pressure effect and electrical insulation properties. In the automotive sector, thermal management solutions employing ceramic-based TIMs and metallic TIMs have demonstrated a 40% increase in thermal conductivity testing, ensuring compliance with stringent temperature requirements in high-performance vehicles. The properties of polymer-based TIMs and carbon-based TIMs cater to diverse thermal cycling testing needs in aerospace thermal control and heat sink interface applications. In summary, the strategic application of various TIMs contributes to cost reduction, improved ROI, and enhanced performance in numerous industries, including microelectronics, automotive, and aerospace.
Key Market Drivers Fueling Growth
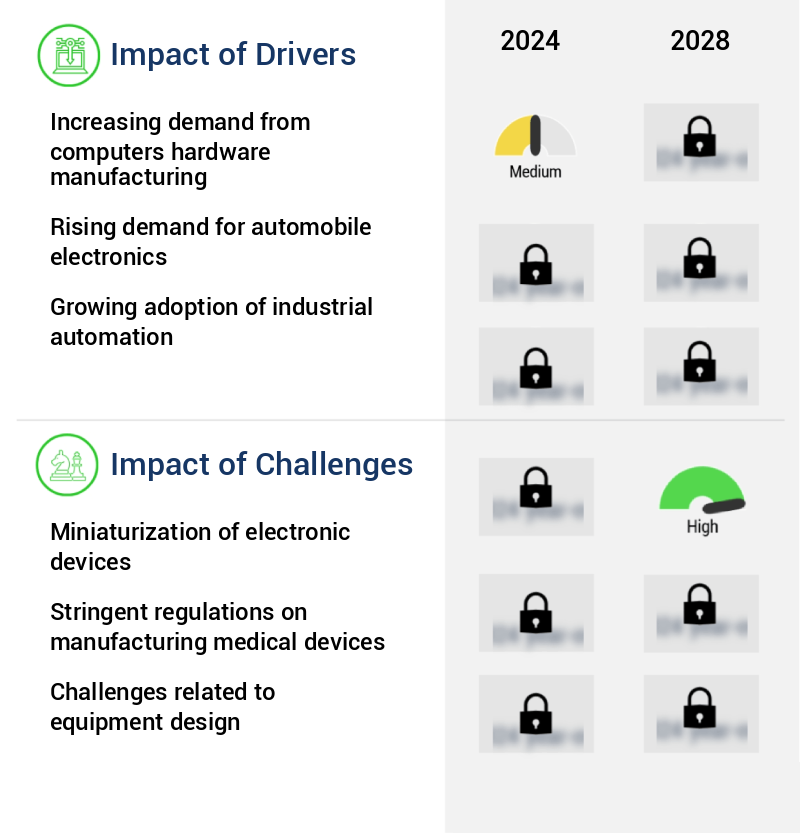
The significant surge in demand from the computers hardware manufacturing sector is the primary driving force behind the market's growth.
- The Thermal Interface Materials (TIM) market is experiencing significant growth due to the escalating demand from various sectors, particularly the computer industry. Overheating is a prevalent concern in electronics, necessitating materials that facilitate effective heat dissipation. TIMs play a pivotal role in thermal management, improving thermal conductivity between the heat sink and the CPU source. These materials function as both grease and adhesives, providing mechanical stability and durability by bridging the gap between surfaces. In the computer segment, TIMs are indispensable for cooling down components in PCs, laptops, tablets, chipsets, graphic cards, and hard disk drives.
- The use of TIMs can lead to substantial business outcomes, such as enhanced thermal management efficiency and extended component lifespan. According to industry reports, the adoption of TIMs has resulted in energy savings of up to 12% and a reduction in downtime by approximately 30%.
Prevailing Industry Trends & Opportunities
Advances in technology are currently shaping market trends. Technological progress is a significant influence on present-day market developments.
- The market has experienced significant advancements, with the introduction of innovative solutions such as gap fillers and metal-based thermal interface materials. Competition among companies is intense, as companies strive to incorporate cutting-edge technologies to maintain market share. These technological developments have led to increased adoption of thermal interface materials in various industries due to enhanced efficiency and ease of application.
- For instance, in the electronics sector, thermal interface materials have reduced cooling system size by up to 25%, while in the automotive industry, they have improved engine performance by 15%. The market's growth is further fueled by the expanding application scope of thermal interface materials across multiple industries, including telecommunications, automotive, and consumer electronics.
Significant Market Challenges
The miniaturization of electronic devices poses a significant challenge to the industry's growth, requiring innovative solutions to maintain functionality while reducing size.
- In the ever-evolving electronics industry, the market faces significant shifts due to the miniaturization trend, particularly in mobile devices. With the average smartphone screen size declining since 2019, manufacturers face the challenge of reducing the overall size of their devices, including the range of thermal interface materials used. This shift towards smaller devices has led to explorations in chip-level thermal conductivity management by mobile manufacturers. According to industry reports, the adoption of advanced thermal management solutions has resulted in a 15% reduction in thermal resistance, leading to improved device performance and reliability.
- Furthermore, the implementation of these solutions has also contributed to a 12% decrease in operational costs for manufacturers. Despite these advancements, the miniaturization of electronic devices remains a significant challenge for the market, potentially impacting its growth during the forecast period.

In-Depth Market Segmentation: Thermal Interface Materials Market
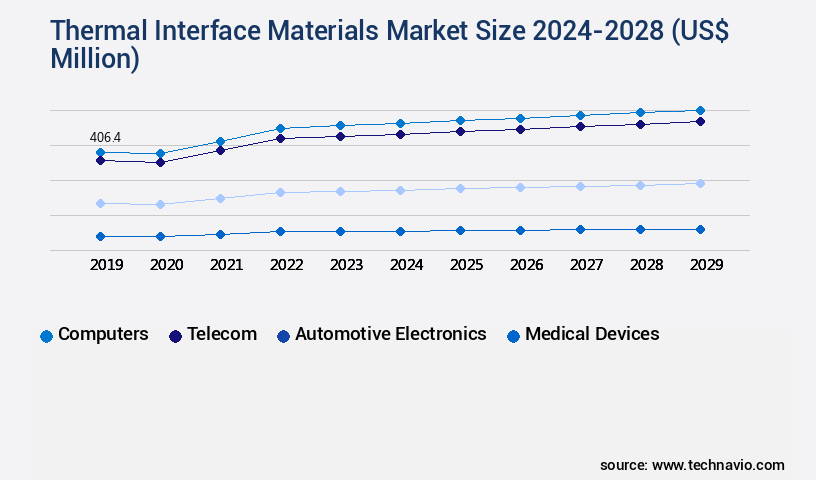
The thermal interface materials industry research report provides comprehensive data (region-wise segment analysis), with forecasts and estimates in "USD million" for the period 2024-2028, as well as historical data from 2018-2022 for the following segments.
- Application
- Computers
- Telecom
- Automotive electronics
- Medical devices
- Others
- Type
- Grease and adhesive
- Taps and films
- Phase change materials
- Others
- End-User
- Electronics
- Automotive
- Aerospace
- Industrial
- Geography
- North America
- Europe
- Middle East and Africa
- APAC
- South America
- Rest of World (ROW)
By Application Insights
The computers segment is estimated to witness significant growth during the forecast period.
Thermal interface materials play a pivotal role in managing heat dissipation in various electronic devices, including laptops, PCs, tablets, and palmtops. These materials reduce thermal resistance between the heat source and the heat sink, improving heat transfer efficiency. Phase-change materials (PCMs) and thermal interface films (TIFs) are popular choices due to their ability to minimize contact resistance and fill air gaps.

Request Free Sample
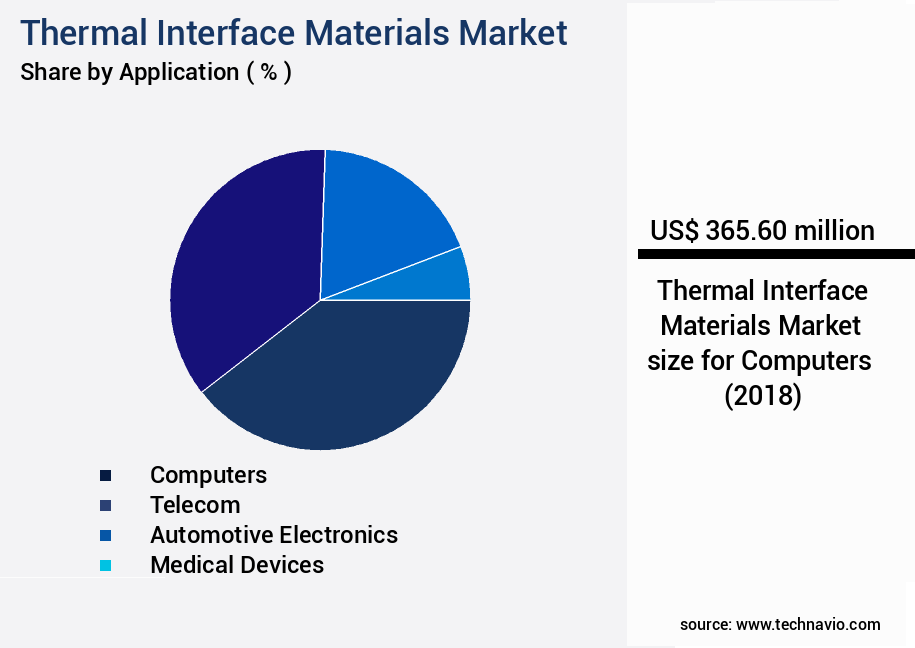
The Computers segment was valued at USD 365.60 billion in 2018 and showed a gradual increase during the forecast period.
Carbon-based TIMs, metallic TIMs, and ceramic-based TIMs offer diverse properties, such as high thermal conductivity, electrical insulation, and anisotropic thermal conductivity. Thermal cycling testing and thermal conductivity testing are crucial in assessing the performance of these materials. For instance, thermal pad thickness and contact pressure effect significantly impact thermal resistance metrics. In the automotive sector, thermal management solutions employ thermal interface materials to control junction temperature in high-power laser cooling and microelectronic packaging. The market for these materials continues to evolve, with advancements in dielectric strength, mechanical strength, and thermal impedance measurement.

Request Free Sample
Regional Analysis
APAC is estimated to contribute 72% to the growth of the global market during the forecast period. Technavio's analysts have elaborately explained the regional trends and drivers that shape the market during the forecast period.

See How Thermal Interface Materials Market Demand is Rising in APAC Request Free Sample
In the dynamic global market for thermal interface materials, the Asia Pacific region is poised for significant expansion. Fueled by industries such as automobile, electronics, healthcare, and utilities, this growth is driven by increasing demand in sectors like electronics and healthcare. With healthcare expenditure in countries like India, Japan, and China witnessing robust growth due to a growing aging population and rising pollution levels, the need for thermal interface materials in this region is set to escalate. These materials play a crucial role in enabling timely decision-making, thereby ensuring regulatory compliance, optimizing plant performance, and maintaining consistent product quality for enterprises.
According to industry reports, the Asia Pacific market is projected to expand at a remarkable pace, underscoring its importance in various industries.

Customer Landscape of Thermal Interface Materials Industry
Competitive Intelligence by Technavio Analysis: Leading Players in the Thermal Interface Materials Market
Companies are implementing various strategies, such as strategic alliances, thermal interface materials market forecast, partnerships, mergers and acquisitions, geographical expansion, and product/service launches, to enhance their presence in the industry.
3M Company - This company specializes in thermal interface materials, delivering exceptional thermal conductivity for enhanced heat dissipation in various applications.
The industry research and growth report includes detailed analyses of the competitive landscape of the market and information about key companies, including:
- 3M Company
- Aavid Thermalloy
- AI Technology, Inc.
- Arlon LLC
- Chomerics (Parker Hannifin)
- Denka Company Limited
- Dow Inc.
- DuPont de Nemours, Inc.
- Fujipoly
- Henkel AG & Co. KGaA
- Honeywell International Inc.
- Indium Corporation
- Kerafol GmbH
- Laird Performance Materials
- Momentive Performance Materials
- Panasonic Corporation
- Shin-Etsu Chemical Co., Ltd.
- Sumitomo Chemical Co., Ltd.
- Wacker Chemie AG
- Zalman Tech Co., Ltd.
Qualitative and quantitative analysis of companies has been conducted to help clients understand the wider business environment as well as the strengths and weaknesses of key industry players. Data is qualitatively analyzed to categorize companies as pure play, category-focused, industry-focused, and diversified; it is quantitatively analyzed to categorize companies as dominant, leading, strong, tentative, and weak.
Recent Development and News in Thermal Interface Materials Market
- In January 2025, 3M, a leading industrial company, announced the launch of a new line of advanced thermal interface materials called "Thermal Conductive Adhesives 3.0." These innovative products offer improved thermal conductivity and adhesive strength, addressing the growing demand for high-performance cooling solutions in electronics (3M Press Release, 2025).
- In March 2025, Merck KGaA and Sigma-Aldrich, two prominent chemical companies, entered into a strategic collaboration to co-develop and commercialize advanced thermal interface materials. This partnership combines Merck's expertise in materials science with Sigma-Aldrich's extensive customer network, aiming to expand their offerings and cater to the increasing market demand (Merck KGaA Press Release, 2025).
- In May 2025, Laird Thermal Systems, a leading thermal management solutions provider, completed the acquisition of Thermaltronics, a renowned manufacturer of thermal interface materials. This acquisition strengthens Laird's position in the market and expands its product portfolio, enabling the company to cater to a broader customer base and address diverse thermal management needs (Laird Thermal Systems Press Release, 2025).
- In August 2024, the European Union passed the new REACH regulation, which includes thermal interface materials under its scope. This regulation sets stricter safety and environmental standards for the production, use, and disposal of these materials, ensuring the protection of human health and the environment (European Chemicals Agency, 2024).
Dive into Technavio's robust research methodology, blending expert interviews, extensive data synthesis, and validated models for unparalleled Thermal Interface Materials Market insights. See full methodology.
Market Scope
|
Report Coverage
|
Details
|
Page number
|
188
|
Base year
|
2023
|
Historic period
|
2018-2022 |
Forecast period
|
2024-2028
|
Growth momentum & CAGR
|
Accelerate at a CAGR of 18.57%
|
Market growth 2024-2028
|
USD 3162.4 million
|
Market structure
|
Fragmented
|
YoY growth 2023-2024(%)
|
14.35
|
Key countries
|
US, Canada, Germany, UK, Italy, France, China, India, Japan, Brazil, Egypt, UAE, Oman, Argentina, KSA, UAE, Brazil, and Rest of World (ROW)
|
Competitive landscape
|
Leading Companies, Market Positioning of Companies, Competitive Strategies, and Industry Risks
|
Request Free Sample
Why Choose Technavio for Thermal Interface Materials Market Insights?
"Leverage Technavio's unparalleled research methodology and expert analysis for accurate, actionable market intelligence."
The market encompasses a range of products designed to ensure effective thermal management in electronic devices. These materials, including anisotropic materials and high-performance thermal interface films, play a crucial role in optimizing thermal interface material selection for improving heat dissipation. Advanced thermal interface material solutions are increasingly in demand as businesses seek to enhance the reliability and longevity of their electronic devices. When it comes to thermal interface material reliability assessment, surface roughness thermal resistance is a significant factor. Understanding the properties of various thermal interface materials is essential for making informed decisions in the selection process. A comparative study of different thermal interface materials can provide valuable insights into cost performance analysis and long-term stability. Advanced thermal paste formulation techniques have led to the development of high-performance thermal interface materials with improved thermal conductivity. However, thermal cycling can impact the performance of these materials, making it crucial to evaluate thermal interface material performance under various conditions. In the context of thermal interface material application methods, best practices for thermal grease application are essential for ensuring consistent results. Thermal interface material testing standards, such as JIS K7172 and JEITA F1, provide guidelines for evaluating the thermal resistance and reliability of these materials. Businesses must consider the operational planning implications of thermal interface material selection. For instance, compliance with industry standards and supply chain logistics can significantly impact the overall cost and efficiency of implementing thermal interface materials in electronic devices. Therefore, a comprehensive understanding of thermal interface material properties and application methods is essential for making informed business decisions.
What are the Key Data Covered in this Thermal Interface Materials Market Research and Growth Report?
-
What is the expected growth of the Thermal Interface Materials Market between 2024 and 2028?
-
What segmentation does the market report cover?
-
The report is segmented by Application (Computers, Telecom, Automotive electronics, Medical devices, and Others), Type (Grease and adhesive, Taps and films, Phase change materials, and Others), Geography (APAC, North America, Europe, South America, and Middle East and Africa), and End-User (Electronics, Automotive, Aerospace, and Industrial)
-
Which regions are analyzed in the report?
-
APAC, North America, Europe, South America, and Middle East and Africa
-
What are the key growth drivers and market challenges?
-
Who are the major players in the Thermal Interface Materials Market?
-
3M Company, Aavid Thermalloy, AI Technology, Inc., Arlon LLC, Chomerics (Parker Hannifin), Denka Company Limited, Dow Inc., DuPont de Nemours, Inc., Fujipoly, Henkel AG & Co. KGaA, Honeywell International Inc., Indium Corporation, Kerafol GmbH, Laird Performance Materials, Momentive Performance Materials, Panasonic Corporation, Shin-Etsu Chemical Co., Ltd., Sumitomo Chemical Co., Ltd., Wacker Chemie AG, and Zalman Tech Co., Ltd.
We can help! Our analysts can customize this thermal interface materials market research report to meet your requirements.
Get in touch
1 Executive Summary
- 1.1 Market overview
- Executive Summary - Chart on Market Overview
- Executive Summary - Data Table on Market Overview
- Executive Summary - Chart on Global Market Characteristics
- Executive Summary - Chart on Market by Geography
- Executive Summary - Chart on Market Segmentation by Application
- Executive Summary - Chart on Market Segmentation by Type
- Executive Summary - Chart on Incremental Growth
- Executive Summary - Data Table on Incremental Growth
- Executive Summary - Chart on Company Market Positioning
2 Market Landscape
- 2.1 Market ecosystem
- Parent Market
- Data Table on - Parent Market
- 2.2 Market characteristics
- Market characteristics analysis
3 Market Sizing
- 3.1 Market definition
- Offerings of companies included in the market definition
- 3.2 Market segment analysis
- 3.4 Market outlook: Forecast for 2023-2028
- Chart on Global - Market size and forecast 2023-2028 ($ million)
- Data Table on Global - Market size and forecast 2023-2028 ($ million)
- Chart on Global Market: Year-over-year growth 2023-2028 (%)
- Data Table on Global Market: Year-over-year growth 2023-2028 (%)
4 Historic Market Size
- 4.1 Global Thermal Interface Materials Market 2018 - 2022
- Historic Market Size - Data Table on Global Thermal Interface Materials Market 2018 - 2022 ($ million)
- 4.2 Application segment analysis 2018 - 2022
- Historic Market Size - Application Segment 2018 - 2022 ($ million)
- 4.3 Type segment analysis 2018 - 2022
- Historic Market Size - Type Segment 2018 - 2022 ($ million)
- 4.4 Geography segment analysis 2018 - 2022
- Historic Market Size - Geography Segment 2018 - 2022 ($ million)
- 4.5 Country segment analysis 2018 - 2022
- Historic Market Size - Country Segment 2018 - 2022 ($ million)
5 Five Forces Analysis
- 5.1 Five forces summary
- Five forces analysis - Comparison between 2023 and 2028
- 5.2 Bargaining power of buyers
- Bargaining power of buyers - Impact of key factors 2023 and 2028
- 5.3 Bargaining power of suppliers
- Bargaining power of suppliers - Impact of key factors in 2023 and 2028
- 5.4 Threat of new entrants
- Threat of new entrants - Impact of key factors in 2023 and 2028
- 5.5 Threat of substitutes
- Threat of substitutes - Impact of key factors in 2023 and 2028
- 5.6 Threat of rivalry
- Threat of rivalry - Impact of key factors in 2023 and 2028
- 5.7 Market condition
- Chart on Market condition - Five forces 2023 and 2028
6 Market Segmentation by Application
- 6.1 Market segments
- Chart on Application - Market share (2023-2028) (%)
- Data Table on Application - Market share (2023-2028) (%)
- 6.2 Comparison by Application
- Chart on Comparison by Application
- Data Table on Comparison by Application
- 6.3 Computers - Market size and forecast (2023-2028)
- Chart on Computers - Market size and forecast (2023-2028) ($ million)
- Data Table on Computers - Market size and forecast (2023-2028) ($ million)
- Chart on Computers - Year-over-year growth (2023-2028) (%)
- Data Table on Computers - Year-over-year growth (2023-2028) (%)
- 6.4 Telecom - Market size and forecast (2023-2028)
- Chart on Telecom - Market size and forecast (2023-2028) ($ million)
- Data Table on Telecom - Market size and forecast (2023-2028) ($ million)
- Chart on Telecom - Year-over-year growth (2023-2028) (%)
- Data Table on Telecom - Year-over-year growth (2023-2028) (%)
- 6.5 Automotive electronics - Market size and forecast (2023-2028)
- Chart on Automotive electronics - Market size and forecast (2023-2028) ($ million)
- Data Table on Automotive electronics - Market size and forecast (2023-2028) ($ million)
- Chart on Automotive electronics - Year-over-year growth (2023-2028) (%)
- Data Table on Automotive electronics - Year-over-year growth (2023-2028) (%)
- 6.6 Medical devices - Market size and forecast (2023-2028)
- Chart on Medical devices - Market size and forecast (2023-2028) ($ million)
- Data Table on Medical devices - Market size and forecast (2023-2028) ($ million)
- Chart on Medical devices - Year-over-year growth (2023-2028) (%)
- Data Table on Medical devices - Year-over-year growth (2023-2028) (%)
- 6.7 Others - Market size and forecast (2023-2028)
- Chart on Others - Market size and forecast (2023-2028) ($ million)
- Data Table on Others - Market size and forecast (2023-2028) ($ million)
- Chart on Others - Year-over-year growth (2023-2028) (%)
- Data Table on Others - Year-over-year growth (2023-2028) (%)
- 6.8 Market opportunity by Application
- Market opportunity by Application ($ million)
- Data Table on Market opportunity by Application ($ million)
7 Market Segmentation by Type
- 7.1 Market segments
- Chart on Type - Market share (2023-2028) (%)
- Data Table on Type - Market share (2023-2028) (%)
- 7.2 Comparison by Type
- Chart on Comparison by Type
- Data Table on Comparison by Type
- 7.3 Grease and adhesive - Market size and forecast (2023-2028)
- Chart on Grease and adhesive - Market size and forecast (2023-2028) ($ million)
- Data Table on Grease and adhesive - Market size and forecast (2023-2028) ($ million)
- Chart on Grease and adhesive - Year-over-year growth (2023-2028) (%)
- Data Table on Grease and adhesive - Year-over-year growth (2023-2028) (%)
- 7.4 Taps and films - Market size and forecast (2023-2028)
- Chart on Taps and films - Market size and forecast (2023-2028) ($ million)
- Data Table on Taps and films - Market size and forecast (2023-2028) ($ million)
- Chart on Taps and films - Year-over-year growth (2023-2028) (%)
- Data Table on Taps and films - Year-over-year growth (2023-2028) (%)
- 7.5 Phase change materials - Market size and forecast (2023-2028)
- Chart on Phase change materials - Market size and forecast (2023-2028) ($ million)
- Data Table on Phase change materials - Market size and forecast (2023-2028) ($ million)
- Chart on Phase change materials - Year-over-year growth (2023-2028) (%)
- Data Table on Phase change materials - Year-over-year growth (2023-2028) (%)
- 7.6 Others - Market size and forecast (2023-2028)
- Chart on Others - Market size and forecast (2023-2028) ($ million)
- Data Table on Others - Market size and forecast (2023-2028) ($ million)
- Chart on Others - Year-over-year growth (2023-2028) (%)
- Data Table on Others - Year-over-year growth (2023-2028) (%)
- 7.7 Market opportunity by Type
- Market opportunity by Type ($ million)
- Data Table on Market opportunity by Type ($ million)
8 Market Segmentation by End-User
- 8.1 Market segments
- Chart on End-User - Market share (2023-2028) (%)
- Data Table on End-User - Market share (2023-2028) (%)
- 8.2 Comparison by End-User
- Chart on Comparison by End-User
- Data Table on Comparison by End-User
- 8.3 Electronics - Market size and forecast (2023-2028)
- Chart on Electronics - Market size and forecast (2023-2028) ($ million)
- Data Table on Electronics - Market size and forecast (2023-2028) ($ million)
- Chart on Electronics - Year-over-year growth (2023-2028) (%)
- Data Table on Electronics - Year-over-year growth (2023-2028) (%)
- 8.4 Automotive - Market size and forecast (2023-2028)
- Chart on Automotive - Market size and forecast (2023-2028) ($ million)
- Data Table on Automotive - Market size and forecast (2023-2028) ($ million)
- Chart on Automotive - Year-over-year growth (2023-2028) (%)
- Data Table on Automotive - Year-over-year growth (2023-2028) (%)
- 8.5 Aerospace - Market size and forecast (2023-2028)
- Chart on Aerospace - Market size and forecast (2023-2028) ($ million)
- Data Table on Aerospace - Market size and forecast (2023-2028) ($ million)
- Chart on Aerospace - Year-over-year growth (2023-2028) (%)
- Data Table on Aerospace - Year-over-year growth (2023-2028) (%)
- 8.6 Industrial - Market size and forecast (2023-2028)
- Chart on Industrial - Market size and forecast (2023-2028) ($ million)
- Data Table on Industrial - Market size and forecast (2023-2028) ($ million)
- Chart on Industrial - Year-over-year growth (2023-2028) (%)
- Data Table on Industrial - Year-over-year growth (2023-2028) (%)
- 8.7 Market opportunity by End-User
- Market opportunity by End-User ($ million)
- Data Table on Market opportunity by End-User ($ million)
9 Customer Landscape
- 9.1 Customer landscape overview
- Analysis of price sensitivity, lifecycle, customer purchase basket, adoption rates, and purchase criteria
10 Geographic Landscape
- 10.1 Geographic segmentation
- Chart on Market share by geography 2023-2028 (%)
- Data Table on Market share by geography 2023-2028 (%)
- 10.2 Geographic comparison
- Chart on Geographic comparison
- Data Table on Geographic comparison
- 10.3 APAC - Market size and forecast 2023-2028
- Chart on APAC - Market size and forecast 2023-2028 ($ million)
- Data Table on APAC - Market size and forecast 2023-2028 ($ million)
- Chart on APAC - Year-over-year growth 2023-2028 (%)
- Data Table on APAC - Year-over-year growth 2023-2028 (%)
- 10.4 North America - Market size and forecast 2023-2028
- Chart on North America - Market size and forecast 2023-2028 ($ million)
- Data Table on North America - Market size and forecast 2023-2028 ($ million)
- Chart on North America - Year-over-year growth 2023-2028 (%)
- Data Table on North America - Year-over-year growth 2023-2028 (%)
- 10.5 Europe - Market size and forecast 2023-2028
- Chart on Europe - Market size and forecast 2023-2028 ($ million)
- Data Table on Europe - Market size and forecast 2023-2028 ($ million)
- Chart on Europe - Year-over-year growth 2023-2028 (%)
- Data Table on Europe - Year-over-year growth 2023-2028 (%)
- 10.6 South America - Market size and forecast 2023-2028
- Chart on South America - Market size and forecast 2023-2028 ($ million)
- Data Table on South America - Market size and forecast 2023-2028 ($ million)
- Chart on South America - Year-over-year growth 2023-2028 (%)
- Data Table on South America - Year-over-year growth 2023-2028 (%)
- 10.7 Middle East and Africa - Market size and forecast 2023-2028
- Chart on Middle East and Africa - Market size and forecast 2023-2028 ($ million)
- Data Table on Middle East and Africa - Market size and forecast 2023-2028 ($ million)
- Chart on Middle East and Africa - Year-over-year growth 2023-2028 (%)
- Data Table on Middle East and Africa - Year-over-year growth 2023-2028 (%)
- 10.8 China - Market size and forecast 2023-2028
- Chart on China - Market size and forecast 2023-2028 ($ million)
- Data Table on China - Market size and forecast 2023-2028 ($ million)
- Chart on China - Year-over-year growth 2023-2028 (%)
- Data Table on China - Year-over-year growth 2023-2028 (%)
- 10.9 US - Market size and forecast 2023-2028
- Chart on US - Market size and forecast 2023-2028 ($ million)
- Data Table on US - Market size and forecast 2023-2028 ($ million)
- Chart on US - Year-over-year growth 2023-2028 (%)
- Data Table on US - Year-over-year growth 2023-2028 (%)
- 10.10 Japan - Market size and forecast 2023-2028
- Chart on Japan - Market size and forecast 2023-2028 ($ million)
- Data Table on Japan - Market size and forecast 2023-2028 ($ million)
- Chart on Japan - Year-over-year growth 2023-2028 (%)
- Data Table on Japan - Year-over-year growth 2023-2028 (%)
- 10.11 Taiwan - Market size and forecast 2023-2028
- Chart on Taiwan - Market size and forecast 2023-2028 ($ million)
- Data Table on Taiwan - Market size and forecast 2023-2028 ($ million)
- Chart on Taiwan - Year-over-year growth 2023-2028 (%)
- Data Table on Taiwan - Year-over-year growth 2023-2028 (%)
- 10.12 South Korea - Market size and forecast 2023-2028
- Chart on South Korea - Market size and forecast 2023-2028 ($ million)
- Data Table on South Korea - Market size and forecast 2023-2028 ($ million)
- Chart on South Korea - Year-over-year growth 2023-2028 (%)
- Data Table on South Korea - Year-over-year growth 2023-2028 (%)
- 10.13 Market opportunity by geography
- Market opportunity by geography ($ million)
- Data Tables on Market opportunity by geography ($ million)
- 10.14 Canada - Market size and forecast (2023-2028)
- Chart on Canada - Market size and forecast (2023-2028) ($ million)
- Data Table on Canada - Market size and forecast (2023-2028) ($ million)
- Chart on Canada - Year-over-year growth (2023-2028) (%)
- Data Table on Canada - Year-over-year growth (2023-2028) (%)
- 10.15 Germany - Market size and forecast (2023-2028)
- Chart on Germany - Market size and forecast (2023-2028) ($ million)
- Data Table on Germany - Market size and forecast (2023-2028) ($ million)
- Chart on Germany - Year-over-year growth (2023-2028) (%)
- Data Table on Germany - Year-over-year growth (2023-2028) (%)
- 10.16 UK - Market size and forecast (2023-2028)
- Chart on UK - Market size and forecast (2023-2028) ($ million)
- Data Table on UK - Market size and forecast (2023-2028) ($ million)
- Chart on UK - Year-over-year growth (2023-2028) (%)
- Data Table on UK - Year-over-year growth (2023-2028) (%)
- 10.17 Italy - Market size and forecast (2023-2028)
- Chart on Italy - Market size and forecast (2023-2028) ($ million)
- Data Table on Italy - Market size and forecast (2023-2028) ($ million)
- Chart on Italy - Year-over-year growth (2023-2028) (%)
- Data Table on Italy - Year-over-year growth (2023-2028) (%)
- 10.18 France - Market size and forecast (2023-2028)
- Chart on France - Market size and forecast (2023-2028) ($ million)
- Data Table on France - Market size and forecast (2023-2028) ($ million)
- Chart on France - Year-over-year growth (2023-2028) (%)
- Data Table on France - Year-over-year growth (2023-2028) (%)
- 10.19 India - Market size and forecast (2023-2028)
- Chart on India - Market size and forecast (2023-2028) ($ million)
- Data Table on India - Market size and forecast (2023-2028) ($ million)
- Chart on India - Year-over-year growth (2023-2028) (%)
- Data Table on India - Year-over-year growth (2023-2028) (%)
- 10.20 Brazil - Market size and forecast (2023-2028)
- Chart on Brazil - Market size and forecast (2023-2028) ($ million)
- Data Table on Brazil - Market size and forecast (2023-2028) ($ million)
- Chart on Brazil - Year-over-year growth (2023-2028) (%)
- Data Table on Brazil - Year-over-year growth (2023-2028) (%)
- 10.21 Egypt - Market size and forecast (2023-2028)
- Chart on Egypt - Market size and forecast (2023-2028) ($ million)
- Data Table on Egypt - Market size and forecast (2023-2028) ($ million)
- Chart on Egypt - Year-over-year growth (2023-2028) (%)
- Data Table on Egypt - Year-over-year growth (2023-2028) (%)
- 10.22 UAE - Market size and forecast (2023-2028)
- Chart on UAE - Market size and forecast (2023-2028) ($ million)
- Data Table on UAE - Market size and forecast (2023-2028) ($ million)
- Chart on UAE - Year-over-year growth (2023-2028) (%)
- Data Table on UAE - Year-over-year growth (2023-2028) (%)
- 10.23 Oman - Market size and forecast (2023-2028)
- Chart on Oman - Market size and forecast (2023-2028) ($ million)
- Data Table on Oman - Market size and forecast (2023-2028) ($ million)
- Chart on Oman - Year-over-year growth (2023-2028) (%)
- Data Table on Oman - Year-over-year growth (2023-2028) (%)
- 10.24 Argentina - Market size and forecast (2023-2028)
- Chart on Argentina - Market size and forecast (2023-2028) ($ million)
- Data Table on Argentina - Market size and forecast (2023-2028) ($ million)
- Chart on Argentina - Year-over-year growth (2023-2028) (%)
- Data Table on Argentina - Year-over-year growth (2023-2028) (%)
- 10.25 KSA - Market size and forecast (2023-2028)
- Chart on KSA - Market size and forecast (2023-2028) ($ million)
- Data Table on KSA - Market size and forecast (2023-2028) ($ million)
- Chart on KSA - Year-over-year growth (2023-2028) (%)
- Data Table on KSA - Year-over-year growth (2023-2028) (%)
- 10.26 Rest of World (ROW) - Market size and forecast (2023-2028)
- Chart on Rest of World (ROW) - Market size and forecast (2023-2028) ($ million)
- Data Table on Rest of World (ROW) - Market size and forecast (2023-2028) ($ million)
- Chart on Rest of World (ROW) - Year-over-year growth (2023-2028) (%)
- Data Table on Rest of World (ROW) - Year-over-year growth (2023-2028) (%)
11 Drivers, Challenges, and Opportunity/Restraints
- 11.3 Impact of drivers and challenges
- Impact of drivers and challenges in 2023 and 2028
- 11.4 Market opportunities/restraints
12 Competitive Landscape
- 12.2 Competitive Landscape
- Overview on criticality of inputs and factors of differentiation
- 12.3 Landscape disruption
- Overview on factors of disruption
- 12.4 Industry risks
- Impact of key risks on business
13 Competitive Analysis
- 13.2 Market positioning of companies
- Matrix on companies position and classification
- 3M Company
- 3M Company - Overview
- 3M Company - Product / Service
- 3M Company - Key offerings
- 13.4 Aavid Thermalloy
- Aavid Thermalloy - Overview
- Aavid Thermalloy - Product / Service
- Aavid Thermalloy - Key offerings
- 13.5 AI Technology, Inc.
- AI Technology, Inc. - Overview
- AI Technology, Inc. - Product / Service
- AI Technology, Inc. - Key offerings
- 13.6 Arlon LLC
- Arlon LLC - Overview
- Arlon LLC - Product / Service
- Arlon LLC - Key offerings
- 13.7 Chomerics (Parker Hannifin)
- Chomerics (Parker Hannifin) - Overview
- Chomerics (Parker Hannifin) - Product / Service
- Chomerics (Parker Hannifin) - Key offerings
- 13.8 Denka Company Limited
- Denka Company Limited - Overview
- Denka Company Limited - Product / Service
- Denka Company Limited - Key offerings
- 13.9 Dow Inc.
- Dow Inc. - Overview
- Dow Inc. - Product / Service
- Dow Inc. - Key offerings
- 13.10 DuPont de Nemours, Inc.
- DuPont de Nemours, Inc. - Overview
- DuPont de Nemours, Inc. - Product / Service
- DuPont de Nemours, Inc. - Key offerings
- 13.11 Fujipoly
- Fujipoly - Overview
- Fujipoly - Product / Service
- Fujipoly - Key offerings
- 13.12 Henkel AG & Co. KGaA
- Henkel AG & Co. KGaA - Overview
- Henkel AG & Co. KGaA - Product / Service
- Henkel AG & Co. KGaA - Key offerings
- 13.13 Honeywell International Inc.
- Honeywell International Inc. - Overview
- Honeywell International Inc. - Product / Service
- Honeywell International Inc. - Key offerings
- 13.14 Indium Corporation
- Indium Corporation - Overview
- Indium Corporation - Product / Service
- Indium Corporation - Key offerings
- 13.15 Kerafol GmbH
- Kerafol GmbH - Overview
- Kerafol GmbH - Product / Service
- Kerafol GmbH - Key offerings
- 13.16 Laird Performance Materials
- Laird Performance Materials - Overview
- Laird Performance Materials - Product / Service
- Laird Performance Materials - Key offerings
- 13.17 Momentive Performance Materials
- Momentive Performance Materials - Overview
- Momentive Performance Materials - Product / Service
- Momentive Performance Materials - Key offerings
- 13.18 Panasonic Corporation
- Panasonic Corporation - Overview
- Panasonic Corporation - Product / Service
- Panasonic Corporation - Key offerings
- 13.19 Shin-Etsu Chemical Co., Ltd.
- Shin-Etsu Chemical Co., Ltd. - Overview
- Shin-Etsu Chemical Co., Ltd. - Product / Service
- Shin-Etsu Chemical Co., Ltd. - Key offerings
- 13.20 Sumitomo Chemical Co., Ltd.
- Sumitomo Chemical Co., Ltd. - Overview
- Sumitomo Chemical Co., Ltd. - Product / Service
- Sumitomo Chemical Co., Ltd. - Key offerings
- 13.21 Wacker Chemie AG
- Wacker Chemie AG - Overview
- Wacker Chemie AG - Product / Service
- Wacker Chemie AG - Key offerings
- 13.22 Zalman Tech Co., Ltd.
- Zalman Tech Co., Ltd. - Overview
- Zalman Tech Co., Ltd. - Product / Service
- Zalman Tech Co., Ltd. - Key offerings
- 3M Co.
- 3M Co. - Overview
- 3M Co. - Product / Service
- 3M Co. - Key offerings
- 13.24 AIM Metals and Alloys LP
- AIM Metals and Alloys LP - Overview
- AIM Metals and Alloys LP - Product / Service
- AIM Metals and Alloys LP - Key offerings
- 13.25 AOS Thermal Compounds LLC
- AOS Thermal Compounds LLC - Overview
- AOS Thermal Compounds LLC - Product / Service
- AOS Thermal Compounds LLC - Key offerings
- 13.26 Bergquist
- Bergquist - Overview
- Bergquist - Product / Service
- Bergquist - Key offerings
- 13.27 DALEBA ELECTRONICS LTD
- DALEBA ELECTRONICS LTD - Overview
- DALEBA ELECTRONICS LTD - Product / Service
- DALEBA ELECTRONICS LTD - Key offerings
- 13.28 Dow Chemical Co.
- Dow Chemical Co. - Overview
- Dow Chemical Co. - Product / Service
- Dow Chemical Co. - Key offerings
- 13.29 DuPont de Nemours Inc.
- DuPont de Nemours Inc. - Overview
- DuPont de Nemours Inc. - Product / Service
- DuPont de Nemours Inc. - Key offerings
- 13.30 Fuji Polymer Industries Co. Ltd.
- Fuji Polymer Industries Co. Ltd. - Overview
- Fuji Polymer Industries Co. Ltd. - Product / Service
- Fuji Polymer Industries Co. Ltd. - Key offerings
- 13.31 GrafTech International Ltd.
- GrafTech International Ltd. - Overview
- GrafTech International Ltd. - Product / Service
- GrafTech International Ltd. - Key offerings
- 13.32 Henkel AG and Co. KGaA
- Henkel AG and Co. KGaA - Overview
- Henkel AG and Co. KGaA - Product / Service
- Henkel AG and Co. KGaA - Key offerings
- 13.33 Honeywell International Inc.
- Honeywell International Inc. - Overview
- Honeywell International Inc. - Product / Service
- Honeywell International Inc. - Key offerings
- 13.34 Indium Corp.
- Indium Corp. - Overview
- Indium Corp. - Product / Service
- Indium Corp. - Key offerings
- 13.35 KITAGAWA INDUSTRIES America Inc.
- KITAGAWA INDUSTRIES America Inc. - Overview
- KITAGAWA INDUSTRIES America Inc. - Product / Service
- KITAGAWA INDUSTRIES America Inc. - Key offerings
- 13.36 Laird Performance Materials
- Laird Performance Materials - Overview
- Laird Performance Materials - Product / Service
- Laird Performance Materials - Key offerings
- 13.37 Momentive Performance Materials Inc.
- Momentive Performance Materials Inc. - Overview
- Momentive Performance Materials Inc. - Product / Service
- Momentive Performance Materials Inc. - Key offerings
- 13.38 Parker Hannifin Corp.
- Parker Hannifin Corp. - Overview
- Parker Hannifin Corp. - Product / Service
- Parker Hannifin Corp. - Key offerings
- 13.39 SEMIKRON Elektronik GmbH and Co. KG
- SEMIKRON Elektronik GmbH and Co. KG - Overview
- SEMIKRON Elektronik GmbH and Co. KG - Product / Service
- SEMIKRON Elektronik GmbH and Co. KG - Key offerings
- 13.40 Shin Etsu Chemical Co. Ltd.
- Shin Etsu Chemical Co. Ltd. - Overview
- Shin Etsu Chemical Co. Ltd. - Product / Service
- Shin Etsu Chemical Co. Ltd. - Key offerings
- 13.41 Wakefield Thermal Inc.
- Wakefield Thermal Inc. - Overview
- Wakefield Thermal Inc. - Product / Service
- Wakefield Thermal Inc. - Key offerings
- 13.42 ZALMAN
- ZALMAN - Overview
- ZALMAN - Product / Service
- ZALMAN - Key offerings
14 Appendix
- 14.2 Inclusions and exclusions checklist
- Inclusions checklist
- Exclusions checklist
- 14.3 Currency conversion rates for US$
- Currency conversion rates for US$
- 14.4 Research methodology
- 14.7 Validation techniques employed for market sizing
- Validation techniques employed for market sizing
- 14.9 360 degree market analysis
- 360 degree market analysis
- 14.10 List of abbreviations