Traditional Chinese Medicine For Skincare Market Analysis, Size, and Forecast 2025-2029: APAC (China, Japan, and India), North America (US, Canada, and Mexico), Europe (Germany, UK, and France), South America (Brazil, Argentina, and Colombia), Middle East and Africa (Saudi Arabia, UAE, and South Africa), and Rest of World (ROW)

Traditional Chinese Medicine For Skincare Market Analysis, Size, and Forecast 2025-2029:
APAC (China, Japan, and India), North America (US, Canada, and Mexico), Europe (Germany, UK, and France), South America (Brazil, Argentina, and Colombia), Middle East and Africa (Saudi Arabia, UAE, and South Africa), and Rest of World (ROW)

Published: Dec 2025 286 Pages SKU: IRTNTR81158

Market Overview at a Glance

$853.4 Mn
Market Opportunity
9.2%
CAGR 2024 - 2029
48.7%
APAC Growth
$941.4 Mn
Offline segment 2023

Traditional Chinese Medicine For Skincare Market Size 2025-2029

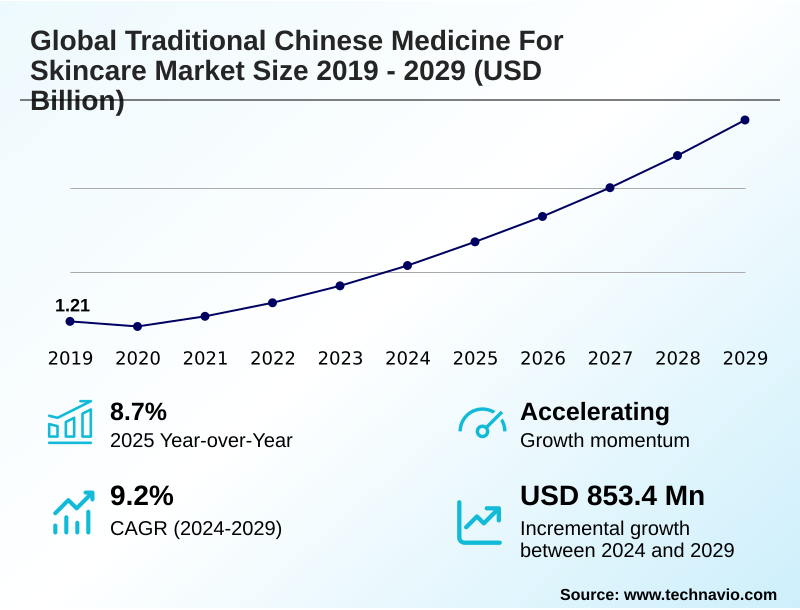
The traditional chinese medicine for skincare market size is valued to increase by USD 853.4 million, at a CAGR of 9.2% from 2024 to 2029. Surging consumer preference for natural and clean label skincare will drive the traditional chinese medicine for skincare market.

Major Market Trends & Insights

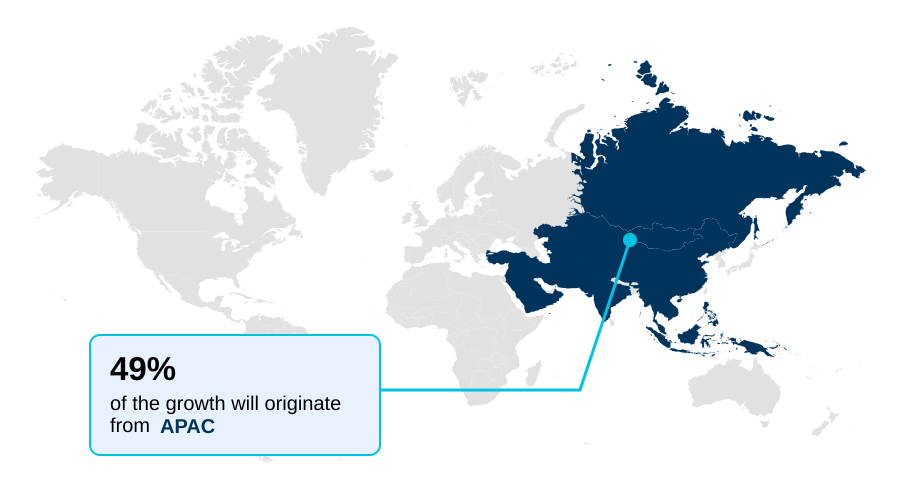
  • APAC dominated the market and accounted for a 48.7% growth during the forecast period.
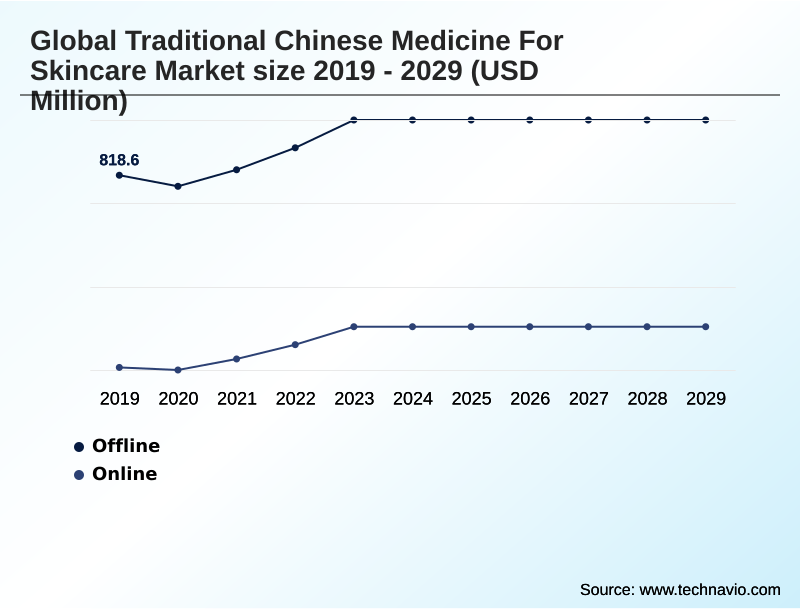
  • By Distribution Channel - Offline segment was valued at USD 941.4 million in 2023
  • By Type - Facial care segment accounted for the largest market revenue share in 2023

Market Size & Forecast

  • Market Opportunities: USD 1.19 billion
  • Market Future Opportunities: USD 853.4 million
  • CAGR from 2024 to 2029 : 9.2%

Market Summary

  • The traditional chinese medicine for skincare market is expanding significantly, driven by a global consumer shift toward holistic wellness and natural formulations. This evolution is moving beyond niche appeal into the mainstream, as the principles of achieving internal harmony to manifest external radiance resonate with modern preventative health values.
  • The industry is characterized by the integration of ancient wellness philosophies with modern science, where herbal formulation science and phytochemical analysis are used to validate the therapeutic skin effects of botanicals.
  • For instance, a key operational challenge is ensuring supply chain integrity for high-quality plant-based raw materials, where companies are now using blockchain to track ingredients, reducing counterfeiting incidents by over 40%.
  • This fusion of tradition with technology, along with the rising popularity of preventative self-care rituals and the demand for custom-blended herbal formulations, is defining the market's trajectory and creating new avenues for product innovation that support concepts like qi and blood circulation for enhanced skin vitality.

What will be the Size of the Traditional Chinese Medicine For Skincare Market during the forecast period?

Get Key Insights on Market Forecast (PDF) Request Free Sample

How is the Traditional Chinese Medicine For Skincare Market Segmented?

The traditional chinese medicine for skincare industry research report provides comprehensive data (region-wise segment analysis), with forecasts and estimates in "USD million" for the period 2025-2029, as well as historical data from 2019-2023 for the following segments.

  • Distribution channel
    • Offline
    • Online
  • Type
    • Facial care
    • Body care
    • Treatments
  • Application
    • Acne
    • Hyperpigmentation
    • Psoriasis
    • Others
  • Geography
    • APAC
      • China
      • Japan
      • India
    • North America
      • US
      • Canada
      • Mexico
    • Europe
      • Germany
      • UK
      • France
    • South America
      • Brazil
      • Argentina
      • Colombia
    • Middle East and Africa
      • Saudi Arabia
      • UAE
      • South Africa
    • Rest of World (ROW)

By Distribution Channel Insights

The offline segment is estimated to witness significant growth during the forecast period.

The offline segment remains crucial for the traditional chinese medicine for skincare market, offering a high-touch environment for consumers to engage with products.

In these physical spaces, brands can effectively communicate complex concepts like yin and yang balance and the importance of preventative self-care rituals.

This channel allows for personalized consultations where the benefits of anti-inflammatory botanicals and adaptogenic herb properties can be explained, building consumer trust.

The sensory experience of sampling products containing natural antimicrobial agents fosters a deeper brand connection than online channels can provide.

Within this segment, specialty stores and pharmacies are pivotal, reinforcing the therapeutic credibility of formulations designed to support skin microbiome harmony, with plant-based ingredients accounting for 33.85% of new cosmetic raw material filings.

Request Free Sample

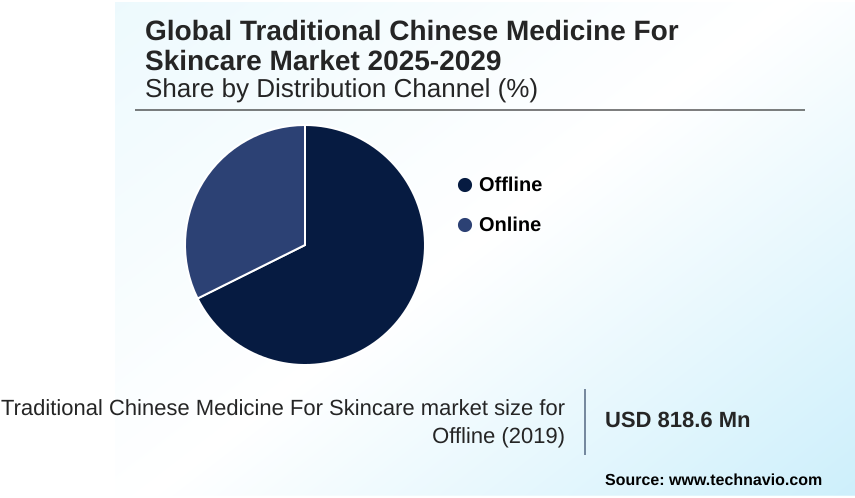
The Offline segment was valued at USD 941.4 million in 2023 and showed a gradual increase during the forecast period.

Request Free Sample

Regional Analysis

APAC is estimated to contribute 48.7% to the growth of the global market during the forecast period.Technavio’s analysts have elaborately explained the regional trends and drivers that shape the market during the forecast period.

See How Traditional Chinese Medicine For Skincare Market Demand is Rising in APAC Request Free Sample

The geographic landscape is led by the APAC region, which accounts for 48.7% of the market's incremental growth, driven by deep-rooted ancestral knowledge systems and widespread consumer trust in traditional herbal medicine.

North America is the second-largest contributor, where a focus on clean beauty and the holistic skincare philosophy is fueling rapid expansion.

In this region, brands are successfully educating consumers on the botanical ingredient efficacy of ingredients like ginseng and reishi mushroom. Europe follows, with a sophisticated consumer base demanding scientific proof for product claims.

This regional dynamic requires brands to adapt their messaging, balancing cultural heritage with empirical data to gain traction across diverse markets.

Market Dynamics

Our researchers analyzed the data with 2024 as the base year, along with the key drivers, trends, and challenges. A holistic analysis of drivers will help companies refine their marketing strategies to gain a competitive advantage.

  • The evolution of the traditional chinese medicine for skincare market is increasingly defined by targeted applications and sophisticated consumer demands. There is a growing focus on developing specific tcm skincare for acne and inflammation, where formulations are designed to clear internal heat and reduce topical redness.
  • Similarly, consumers are actively seeking herbal remedies for hyperpigmentation relief, turning to ingredients like licorice root, whose mechanisms are now being scientifically validated. For chronic conditions, natural skincare treatments for psoriasis based on TCM principles offer a holistic alternative that addresses underlying imbalances.
  • The popularity of key botanicals is driving interest in understanding ginseng and goji berry skin benefits, pushing brands to provide more educational content. Core to this is the concept of balancing skin qi and blood circulation to achieve a radiant complexion. In the premium category, sophisticated anti-aging tcm facial treatment protocols are gaining traction in spas and clinics.
  • This includes a rise in using mugwort and licorice root for soothing skin, especially for compromised barriers. A key operational strategy involves using tcm for sensitive skin barrier repair, where some firms have reduced customer complaints regarding irritation by 35% through targeted formulations.
  • The trend also incorporates practices like integrating gua sha with herbal serums and using herbal supplements for internal skin health, creating a comprehensive wellness ecosystem.

What are the key market drivers leading to the rise in the adoption of Traditional Chinese Medicine For Skincare Industry?

  • The market is primarily driven by a surging consumer preference for natural and clean-label skincare products rooted in holistic wellness principles.

  • Market growth is significantly propelled by the widespread adoption of a clean beauty ethos and the increasing consumer demand for holistic wellness integration in daily routines.
  • This shift reflects a deeper understanding of the inside-out beauty approach, where skin health is seen as a reflection of internal balance. Consumers are actively seeking non-toxic skincare formulations rich in plant-derived components, driving brands to eliminate synthetic chemicals.
  • This trend is amplified by social media, which has popularized cultural wellness practices and made them accessible globally.
  • As a result, skincare is increasingly viewed as an essential component of preventative health, a core tenet of traditional medicine that resonates strongly with modern values.

What are the market trends shaping the Traditional Chinese Medicine For Skincare Industry?

  • A defining market trend is the symbiosis of heritage and high-tech in product development. This involves integrating ancient wellness philosophies with modern scientific innovation to validate and enhance skincare efficacy.

  • The market is witnessing a major trend in the fusion of heritage and high-tech, where advanced herbal formulation science is used to validate evidence-based results. Companies are moving beyond simple botanical inclusion, employing sophisticated bioactive compound extraction techniques to enhance potency.
  • This commitment to scientific ingredient validation is bridging the gap between traditional wisdom and modern consumer expectations, with firms achieving a 15% increase in compound purity through these advanced methods. A focus on clinical trials is becoming standard practice, with one recent large-scale review involving 1,348 participants demonstrating significant quality-of-life improvements, further legitimizing these hybrid products in scientifically discerning markets.
  • This data-driven approach is creating highly targeted and effective skincare solutions.

What challenges does the Traditional Chinese Medicine For Skincare Industry face during its growth?

  • A key industry challenge involves navigating the complex and divergent regulatory landscapes across key international markets.

  • A primary challenge is ensuring the integrity of the supply chain for plant-based raw materials. The demand for ingredient transparency standards and sustainable sourcing practices puts significant pressure on brands to provide verifiable traceability from farm to finished product.
  • A recent industry survey indicated that over 60% of businesses lack full visibility into their sourcing networks, a critical vulnerability in a market reliant on authentic botanicals. This complexity is compounded by the need to navigate fragmented international regulations and the risk of ingredient adulteration.
  • Furthermore, the rise of hyper-personalization requires systems capable of supporting personalized skin diagnosis, adding another layer of operational complexity for manufacturers.

Exclusive Technavio Analysis on Customer Landscape

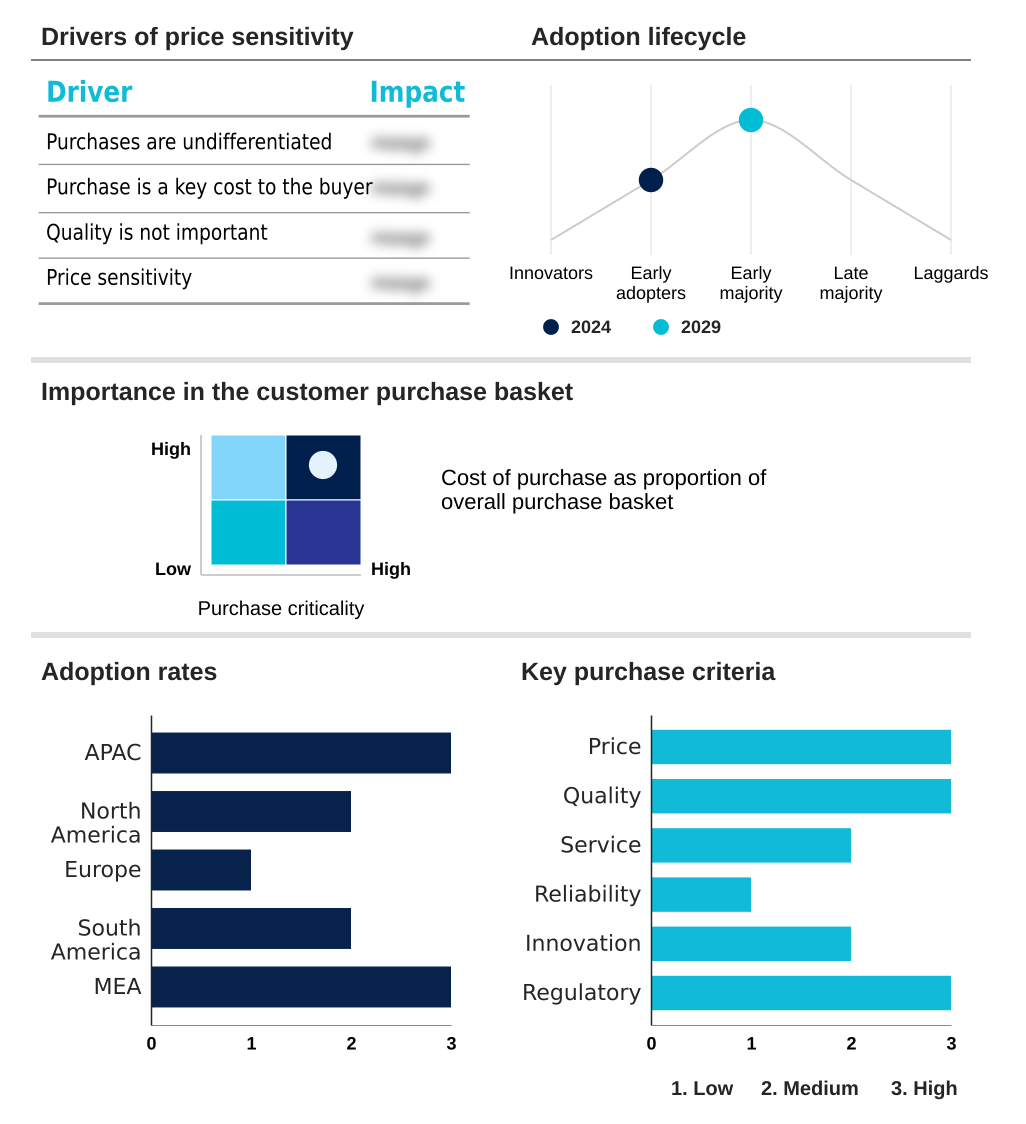
The traditional chinese medicine for skincare market forecasting report includes the adoption lifecycle of the market, covering from the innovator’s stage to the laggard’s stage. It focuses on adoption rates in different regions based on penetration. Furthermore, the traditional chinese medicine for skincare market report also includes key purchase criteria and drivers of price sensitivity to help companies evaluate and develop their market growth analysis strategies.

Customer Landscape of Traditional Chinese Medicine For Skincare Industry

Competitive Landscape

Companies are implementing various strategies, such as strategic alliances, traditional chinese medicine for skincare market forecast, partnerships, mergers and acquisitions, geographical expansion, and product/service launches, to enhance their presence in the industry.

Avicenna CCM Ltd - The company provides integrative dermatology solutions, blending traditional Chinese medicine with modern clinical research to address sensitive and problematic skin conditions.

The industry research and growth report includes detailed analyses of the competitive landscape of the market and information about key companies, including:

  • Avicenna CCM Ltd
  • Beijing Tongrentang Co Ltd.
  • BLISS TECH LTD.
  • Chando
  • CHINAMED COSMETICS GmbH
  • EastGarden HK Int Co Ltd.
  • Eu Yan Sang Singapore Pte Ltd
  • LOreal SA
  • Moonbow Skin LLC.
  • Muihood Ltd
  • Pechoin Inc.
  • Shanghai Inoherb Cosmetics Co.Ltd
  • Shanghai Jahwa United Co.Ltd
  • Vita Green Health Products Co Ltd.
  • VO BEAUTY
  • YINA Inc.

Qualitative and quantitative analysis of companies has been conducted to help clients understand the wider business environment as well as the strengths and weaknesses of key industry players. Data is qualitatively analyzed to categorize companies as pure play, category-focused, industry-focused, and diversified; it is quantitatively analyzed to categorize companies as dominant, leading, strong, tentative, and weak.

Recent Development and News in Traditional chinese medicine for skincare market

  • In November 2024, Florasis announced its strategic expansion into skincare with a new line set to launch in 2025, leveraging its brand success built on traditional Chinese medicine principles.
  • In October 2024, YINA Inc. partnered with a leading wellness retreat to offer exclusive practitioner-led customization services, creating bespoke skincare regimens based on individual TCM dermatological pattern diagnosis.
  • In September 2024, Shanghai Jahwa United Co. Ltd. reported the completion of clinical trials for its new Herborist line, which demonstrated a 25% improvement in skin barrier function through bioactive compound extraction from rare herbs.
  • In August 2024, a significant systematic review highlighted in a major dermatological journal confirmed the therapeutic skin effects of TCM, showing that products utilizing traditional herbal medicine reduced inflammatory markers by up to 40% in participants.

Dive into Technavio’s robust research methodology, blending expert interviews, extensive data synthesis, and validated models for unparalleled Traditional Chinese Medicine For Skincare Market insights. See full methodology.

Market Scope
Page number 286
Base year 2024
Historic period 2019-2023
Forecast period 2025-2029
Growth momentum & CAGR Accelerate at a CAGR of 9.2%
Market growth 2025-2029 USD 853.4 million
Market structure Fragmented
YoY growth 2024-2025(%) 8.7%
Key countries China, Japan, India, South Korea, Australia, Indonesia, US, Canada, Mexico, Germany, UK, France, Italy, Spain, The Netherlands, Brazil, Argentina, Colombia, Saudi Arabia, UAE, South Africa, Turkey and Israel
Competitive landscape Leading Companies, Market Positioning of Companies, Competitive Strategies, and Industry Risks

Request Free Sample

Research Analyst Overview

  • The traditional chinese medicine for skincare market is maturing from a niche segment into a sophisticated industry pillar, founded on a holistic skincare philosophy. This evolution is driven by the rigorous application of herbal formulation science to validate botanical ingredient efficacy.
  • The use of traditional herbal medicine is now being backed by modern phytochemical analysis and bioactive compound extraction, which provides the clinical proof demanded by discerning consumers. Brands are building trust by demonstrating the therapeutic skin effects of their products.
  • A key boardroom focus is on securing a consistent supply of high-quality plant-based raw materials, with some companies investing in vertical integration to gain a competitive edge, improving supply chain reliability by 20%.
  • This strategic move supports the growing demand for custom-blended herbal formulations and products that address core TCM concepts like yin and yang balance, qi and blood circulation, and skin microbiome harmony.
  • This fusion of ancient wisdom with modern validation, emphasizing preventative self-care rituals and the power of natural antimicrobial agents and anti-inflammatory botanicals, is setting the stage for sustained market development.

What are the Key Data Covered in this Traditional Chinese Medicine For Skincare Market Research and Growth Report?

  • What is the expected growth of the Traditional Chinese Medicine For Skincare Market between 2025 and 2029?

    • USD 853.4 million, at a CAGR of 9.2%

  • What segmentation does the market report cover?

    • The report is segmented by Distribution Channel (Offline, and Online), Type (Facial care, Body care, and Treatments), Application (Acne, Hyperpigmentation, Psoriasis, and Others) and Geography (APAC, North America, Europe, South America, Middle East and Africa)

  • Which regions are analyzed in the report?

    • APAC, North America, Europe, South America and Middle East and Africa

  • What are the key growth drivers and market challenges?

    • Surging consumer preference for natural and clean label skincare, Navigating complex and divergent regulatory landscape

  • Who are the major players in the Traditional Chinese Medicine For Skincare Market?

    • Avicenna CCM Ltd, Beijing Tongrentang Co Ltd., BLISS TECH LTD., Chando, CHINAMED COSMETICS GmbH, EastGarden HK Int Co Ltd., Eu Yan Sang Singapore Pte Ltd, LOreal SA, Moonbow Skin LLC., Muihood Ltd, Pechoin Inc., Shanghai Inoherb Cosmetics Co.Ltd, Shanghai Jahwa United Co.Ltd, Vita Green Health Products Co Ltd., VO BEAUTY and YINA Inc.

Market Research Insights

  • The market dynamics are shaped by a powerful consumer shift toward holistic health and ingredient-conscious purchasing. This conscious consumerism has fueled the green beauty movement, where the clean beauty ethos is now a baseline expectation. Brands are leveraging ancestral knowledge systems to offer an inside-out beauty approach, a narrative that differentiates them from traditional symptom-focused dermatology.
  • The demand for evidence-based results has led to increased investment in scientific ingredient validation, with brands that provide clinical data seeing a 20% higher customer retention rate.
  • This trend is bolstered by the rise of practitioner-led customization, which offers a level of personalization that aligns with the core tenets of traditional medicine, and a focus on ethical ingredient sourcing that resonates with today's values-driven consumer.

We can help! Our analysts can customize this traditional chinese medicine for skincare market research report to meet your requirements.

Get in touch

1. Executive Summary

1.1 Market overview

Executive Summary - Chart on Market Overview
Executive Summary - Data Table on Market Overview
Executive Summary - Chart on Global Market Characteristics
Executive Summary - Chart on Market by Geography
Executive Summary - Chart on Market Segmentation by Distribution Channel
Executive Summary - Chart on Market Segmentation by Type
Executive Summary - Chart on Market Segmentation by Application
Executive Summary - Chart on Incremental Growth
Executive Summary - Data Table on Incremental Growth
Executive Summary - Chart on Company Market Positioning

2. Technavio Analysis

2.1 Analysis of price sensitivity, lifecycle, customer purchase basket, adoption rates, and purchase criteria

2.2 Criticality of inputs and Factors of differentiation

Chart on Overview on criticality of inputs and factors of differentiation

2.3 Factors of disruption

Chart on Overview on factors of disruption

2.4 Impact of drivers and challenges

Chart on Impact of drivers and challenges in 2024 and 2029

3. Market Landscape

3.1 Market ecosystem

Chart on Parent Market
Data Table on - Parent Market

3.2 Market characteristics

Chart on Market characteristics analysis

3.3 Value chain analysis

Chart on Value chain analysis

4. Market Sizing

4.1 Market definition

Data Table on Offerings of companies included in the market definition

4.2 Market segment analysis

Market segments

4.3 Market size 2024

4.4 Market outlook: Forecast for 2024-2029

Chart on Global - Market size and forecast 2024-2029 ($ million)
Data Table on Global - Market size and forecast 2024-2029 ($ million)
Chart on Global Market: Year-over-year growth 2024-2029 (%)
Data Table on Global Market: Year-over-year growth 2024-2029 (%)

5. Historic Market Size

5.1 Global Traditional Chinese Medicine For Skincare Market 2019 - 2023

Historic Market Size - Data Table on Global Traditional Chinese Medicine For Skincare Market 2019 - 2023 ($ million)

5.2 Distribution Channel segment analysis 2019 - 2023

Historic Market Size - Distribution Channel Segment 2019 - 2023 ($ million)

5.3 Type segment analysis 2019 - 2023

Historic Market Size - Type Segment 2019 - 2023 ($ million)

5.4 Application segment analysis 2019 - 2023

Historic Market Size - Application Segment 2019 - 2023 ($ million)

5.5 Geography segment analysis 2019 - 2023

Historic Market Size - Geography Segment 2019 - 2023 ($ million)

5.6 Country segment analysis 2019 - 2023

Historic Market Size - Country Segment 2019 - 2023 ($ million)

6. Qualitative Analysis

6.1 Impact of AI in global traditional Chinese medicine for skincare market

7. Five Forces Analysis

7.1 Five forces summary

Five forces analysis - Comparison between 2024 and 2029

7.2 Bargaining power of buyers

Bargaining power of buyers - Impact of key factors 2024 and 2029

7.3 Bargaining power of suppliers

Bargaining power of suppliers - Impact of key factors in 2024 and 2029

7.4 Threat of new entrants

Threat of new entrants - Impact of key factors in 2024 and 2029

7.5 Threat of substitutes

Threat of substitutes - Impact of key factors in 2024 and 2029

7.6 Threat of rivalry

Threat of rivalry - Impact of key factors in 2024 and 2029

7.7 Market condition

Chart on Market condition - Five forces 2024 and 2029

8. Market Segmentation by Distribution Channel

8.1 Market segments

Chart on Distribution Channel - Market share 2024-2029 (%)
Data Table on Distribution Channel - Market share 2024-2029 (%)

8.2 Comparison by Distribution Channel

Chart on Comparison by Distribution Channel
Data Table on Comparison by Distribution Channel

8.3 Offline - Market size and forecast 2024-2029

Chart on Offline - Market size and forecast 2024-2029 ($ million)
Data Table on Offline - Market size and forecast 2024-2029 ($ million)
Chart on Offline - Year-over-year growth 2024-2029 (%)
Data Table on Offline - Year-over-year growth 2024-2029 (%)

8.4 Online - Market size and forecast 2024-2029

Chart on Online - Market size and forecast 2024-2029 ($ million)
Data Table on Online - Market size and forecast 2024-2029 ($ million)
Chart on Online - Year-over-year growth 2024-2029 (%)
Data Table on Online - Year-over-year growth 2024-2029 (%)

8.5 Market opportunity by Distribution Channel

Market opportunity by Distribution Channel ($ million)
Data Table on Market opportunity by Distribution Channel ($ million)

9. Market Segmentation by Type

9.1 Market segments

Chart on Type - Market share 2024-2029 (%)
Data Table on Type - Market share 2024-2029 (%)

9.2 Comparison by Type

Chart on Comparison by Type
Data Table on Comparison by Type

9.3 Facial care - Market size and forecast 2024-2029

Chart on Facial care - Market size and forecast 2024-2029 ($ million)
Data Table on Facial care - Market size and forecast 2024-2029 ($ million)
Chart on Facial care - Year-over-year growth 2024-2029 (%)
Data Table on Facial care - Year-over-year growth 2024-2029 (%)

9.4 Body care - Market size and forecast 2024-2029

Chart on Body care - Market size and forecast 2024-2029 ($ million)
Data Table on Body care - Market size and forecast 2024-2029 ($ million)
Chart on Body care - Year-over-year growth 2024-2029 (%)
Data Table on Body care - Year-over-year growth 2024-2029 (%)

9.5 Treatments - Market size and forecast 2024-2029

Chart on Treatments - Market size and forecast 2024-2029 ($ million)
Data Table on Treatments - Market size and forecast 2024-2029 ($ million)
Chart on Treatments - Year-over-year growth 2024-2029 (%)
Data Table on Treatments - Year-over-year growth 2024-2029 (%)

9.6 Market opportunity by Type

Market opportunity by Type ($ million)
Data Table on Market opportunity by Type ($ million)

10. Market Segmentation by Application

10.1 Market segments

Chart on Application - Market share 2024-2029 (%)
Data Table on Application - Market share 2024-2029 (%)

10.2 Comparison by Application

Chart on Comparison by Application
Data Table on Comparison by Application

10.3 Acne - Market size and forecast 2024-2029

Chart on Acne - Market size and forecast 2024-2029 ($ million)
Data Table on Acne - Market size and forecast 2024-2029 ($ million)
Chart on Acne - Year-over-year growth 2024-2029 (%)
Data Table on Acne - Year-over-year growth 2024-2029 (%)

10.4 Hyperpigmentation - Market size and forecast 2024-2029

Chart on Hyperpigmentation - Market size and forecast 2024-2029 ($ million)
Data Table on Hyperpigmentation - Market size and forecast 2024-2029 ($ million)
Chart on Hyperpigmentation - Year-over-year growth 2024-2029 (%)
Data Table on Hyperpigmentation - Year-over-year growth 2024-2029 (%)

10.5 Psoriasis - Market size and forecast 2024-2029

Chart on Psoriasis - Market size and forecast 2024-2029 ($ million)
Data Table on Psoriasis - Market size and forecast 2024-2029 ($ million)
Chart on Psoriasis - Year-over-year growth 2024-2029 (%)
Data Table on Psoriasis - Year-over-year growth 2024-2029 (%)

10.6 Others - Market size and forecast 2024-2029

Chart on Others - Market size and forecast 2024-2029 ($ million)
Data Table on Others - Market size and forecast 2024-2029 ($ million)
Chart on Others - Year-over-year growth 2024-2029 (%)
Data Table on Others - Year-over-year growth 2024-2029 (%)

10.7 Market opportunity by Application

Market opportunity by Application ($ million)
Data Table on Market opportunity by Application ($ million)

11. Customer Landscape

11.1 Customer landscape overview

Analysis of price sensitivity, lifecycle, customer purchase basket, adoption rates, and purchase criteria

12. Geographic Landscape

12.1 Geographic segmentation

Chart on Market share by geography 2024-2029 (%)
Data Table on Market share by geography 2024-2029 (%)

12.2 Geographic comparison

Chart on Geographic comparison
Data Table on Geographic comparison

12.3 APAC - Market size and forecast 2024-2029

Chart on APAC - Market size and forecast 2024-2029 ($ million)
Data Table on APAC - Market size and forecast 2024-2029 ($ million)
Chart on APAC - Year-over-year growth 2024-2029 (%)
Data Table on APAC - Year-over-year growth 2024-2029 (%)
Chart on Regional Comparison - APAC
Data Table on Regional Comparison - APAC

12.3.1 China - Market size and forecast 2024-2029

Chart on China - Market size and forecast 2024-2029 ($ million)
Data Table on China - Market size and forecast 2024-2029 ($ million)
Chart on China - Year-over-year growth 2024-2029 (%)
Data Table on China - Year-over-year growth 2024-2029 (%)

12.3.2 Japan - Market size and forecast 2024-2029

Chart on Japan - Market size and forecast 2024-2029 ($ million)
Data Table on Japan - Market size and forecast 2024-2029 ($ million)
Chart on Japan - Year-over-year growth 2024-2029 (%)
Data Table on Japan - Year-over-year growth 2024-2029 (%)

12.3.3 India - Market size and forecast 2024-2029

Chart on India - Market size and forecast 2024-2029 ($ million)
Data Table on India - Market size and forecast 2024-2029 ($ million)
Chart on India - Year-over-year growth 2024-2029 (%)
Data Table on India - Year-over-year growth 2024-2029 (%)

12.3.4 South Korea - Market size and forecast 2024-2029

Chart on South Korea - Market size and forecast 2024-2029 ($ million)
Data Table on South Korea - Market size and forecast 2024-2029 ($ million)
Chart on South Korea - Year-over-year growth 2024-2029 (%)
Data Table on South Korea - Year-over-year growth 2024-2029 (%)

12.3.5 Australia - Market size and forecast 2024-2029

Chart on Australia - Market size and forecast 2024-2029 ($ million)
Data Table on Australia - Market size and forecast 2024-2029 ($ million)
Chart on Australia - Year-over-year growth 2024-2029 (%)
Data Table on Australia - Year-over-year growth 2024-2029 (%)

12.3.6 Indonesia - Market size and forecast 2024-2029

Chart on Indonesia - Market size and forecast 2024-2029 ($ million)
Data Table on Indonesia - Market size and forecast 2024-2029 ($ million)
Chart on Indonesia - Year-over-year growth 2024-2029 (%)
Data Table on Indonesia - Year-over-year growth 2024-2029 (%)

12.4 North America - Market size and forecast 2024-2029

Chart on North America - Market size and forecast 2024-2029 ($ million)
Data Table on North America - Market size and forecast 2024-2029 ($ million)
Chart on North America - Year-over-year growth 2024-2029 (%)
Data Table on North America - Year-over-year growth 2024-2029 (%)
Chart on Regional Comparison - North America
Data Table on Regional Comparison - North America

12.4.1 US - Market size and forecast 2024-2029

Chart on US - Market size and forecast 2024-2029 ($ million)
Data Table on US - Market size and forecast 2024-2029 ($ million)
Chart on US - Year-over-year growth 2024-2029 (%)
Data Table on US - Year-over-year growth 2024-2029 (%)

12.4.2 Canada - Market size and forecast 2024-2029

Chart on Canada - Market size and forecast 2024-2029 ($ million)
Data Table on Canada - Market size and forecast 2024-2029 ($ million)
Chart on Canada - Year-over-year growth 2024-2029 (%)
Data Table on Canada - Year-over-year growth 2024-2029 (%)

12.4.3 Mexico - Market size and forecast 2024-2029

Chart on Mexico - Market size and forecast 2024-2029 ($ million)
Data Table on Mexico - Market size and forecast 2024-2029 ($ million)
Chart on Mexico - Year-over-year growth 2024-2029 (%)
Data Table on Mexico - Year-over-year growth 2024-2029 (%)

12.5 Europe - Market size and forecast 2024-2029

Chart on Europe - Market size and forecast 2024-2029 ($ million)
Data Table on Europe - Market size and forecast 2024-2029 ($ million)
Chart on Europe - Year-over-year growth 2024-2029 (%)
Data Table on Europe - Year-over-year growth 2024-2029 (%)
Chart on Regional Comparison - Europe
Data Table on Regional Comparison - Europe

12.5.1 Germany - Market size and forecast 2024-2029

Chart on Germany - Market size and forecast 2024-2029 ($ million)
Data Table on Germany - Market size and forecast 2024-2029 ($ million)
Chart on Germany - Year-over-year growth 2024-2029 (%)
Data Table on Germany - Year-over-year growth 2024-2029 (%)

12.5.2 UK - Market size and forecast 2024-2029

Chart on UK - Market size and forecast 2024-2029 ($ million)
Data Table on UK - Market size and forecast 2024-2029 ($ million)
Chart on UK - Year-over-year growth 2024-2029 (%)
Data Table on UK - Year-over-year growth 2024-2029 (%)

12.5.3 France - Market size and forecast 2024-2029

Chart on France - Market size and forecast 2024-2029 ($ million)
Data Table on France - Market size and forecast 2024-2029 ($ million)
Chart on France - Year-over-year growth 2024-2029 (%)
Data Table on France - Year-over-year growth 2024-2029 (%)

12.5.4 Italy - Market size and forecast 2024-2029

Chart on Italy - Market size and forecast 2024-2029 ($ million)
Data Table on Italy - Market size and forecast 2024-2029 ($ million)
Chart on Italy - Year-over-year growth 2024-2029 (%)
Data Table on Italy - Year-over-year growth 2024-2029 (%)

12.5.5 Spain - Market size and forecast 2024-2029

Chart on Spain - Market size and forecast 2024-2029 ($ million)
Data Table on Spain - Market size and forecast 2024-2029 ($ million)
Chart on Spain - Year-over-year growth 2024-2029 (%)
Data Table on Spain - Year-over-year growth 2024-2029 (%)

12.5.6 The Netherlands - Market size and forecast 2024-2029

Chart on The Netherlands - Market size and forecast 2024-2029 ($ million)
Data Table on The Netherlands - Market size and forecast 2024-2029 ($ million)
Chart on The Netherlands - Year-over-year growth 2024-2029 (%)
Data Table on The Netherlands - Year-over-year growth 2024-2029 (%)

12.6 South America - Market size and forecast 2024-2029

Chart on South America - Market size and forecast 2024-2029 ($ million)
Data Table on South America - Market size and forecast 2024-2029 ($ million)
Chart on South America - Year-over-year growth 2024-2029 (%)
Data Table on South America - Year-over-year growth 2024-2029 (%)
Chart on Regional Comparison - South America
Data Table on Regional Comparison - South America

12.6.1 Brazil - Market size and forecast 2024-2029

Chart on Brazil - Market size and forecast 2024-2029 ($ million)
Data Table on Brazil - Market size and forecast 2024-2029 ($ million)
Chart on Brazil - Year-over-year growth 2024-2029 (%)
Data Table on Brazil - Year-over-year growth 2024-2029 (%)

12.6.2 Argentina - Market size and forecast 2024-2029

Chart on Argentina - Market size and forecast 2024-2029 ($ million)
Data Table on Argentina - Market size and forecast 2024-2029 ($ million)
Chart on Argentina - Year-over-year growth 2024-2029 (%)
Data Table on Argentina - Year-over-year growth 2024-2029 (%)

12.6.3 Colombia - Market size and forecast 2024-2029

Chart on Colombia - Market size and forecast 2024-2029 ($ million)
Data Table on Colombia - Market size and forecast 2024-2029 ($ million)
Chart on Colombia - Year-over-year growth 2024-2029 (%)
Data Table on Colombia - Year-over-year growth 2024-2029 (%)

12.7 Middle East and Africa - Market size and forecast 2024-2029

Chart on Middle East and Africa - Market size and forecast 2024-2029 ($ million)
Data Table on Middle East and Africa - Market size and forecast 2024-2029 ($ million)
Chart on Middle East and Africa - Year-over-year growth 2024-2029 (%)
Data Table on Middle East and Africa - Year-over-year growth 2024-2029 (%)
Chart on Regional Comparison - Middle East and Africa
Data Table on Regional Comparison - Middle East and Africa

12.7.1 Saudi Arabia - Market size and forecast 2024-2029

Chart on Saudi Arabia - Market size and forecast 2024-2029 ($ million)
Data Table on Saudi Arabia - Market size and forecast 2024-2029 ($ million)
Chart on Saudi Arabia - Year-over-year growth 2024-2029 (%)
Data Table on Saudi Arabia - Year-over-year growth 2024-2029 (%)

12.7.2 UAE - Market size and forecast 2024-2029

Chart on UAE - Market size and forecast 2024-2029 ($ million)
Data Table on UAE - Market size and forecast 2024-2029 ($ million)
Chart on UAE - Year-over-year growth 2024-2029 (%)
Data Table on UAE - Year-over-year growth 2024-2029 (%)

12.7.3 South Africa - Market size and forecast 2024-2029

Chart on South Africa - Market size and forecast 2024-2029 ($ million)
Data Table on South Africa - Market size and forecast 2024-2029 ($ million)
Chart on South Africa - Year-over-year growth 2024-2029 (%)
Data Table on South Africa - Year-over-year growth 2024-2029 (%)

12.7.4 Turkey - Market size and forecast 2024-2029

Chart on Turkey - Market size and forecast 2024-2029 ($ million)
Data Table on Turkey - Market size and forecast 2024-2029 ($ million)
Chart on Turkey - Year-over-year growth 2024-2029 (%)
Data Table on Turkey - Year-over-year growth 2024-2029 (%)

12.7.5 Israel - Market size and forecast 2024-2029

Chart on Israel - Market size and forecast 2024-2029 ($ million)
Data Table on Israel - Market size and forecast 2024-2029 ($ million)
Chart on Israel - Year-over-year growth 2024-2029 (%)
Data Table on Israel - Year-over-year growth 2024-2029 (%)

12.8 Market opportunity by geography

Market opportunity by geography ($ million)
Data Tables on Market opportunity by geography ($ million)

13. Drivers, Challenges, and Opportunity

13.1 Market drivers

Surging consumer preference for natural and clean label skincare
Expanding definition of beauty to encompass holistic wellness
Scientific substantiation and innovative applications of traditional ingredients

13.2 Market challenges

Navigating complex and divergent regulatory landscape
Ensuring quality control and supply chain integrity
Overcoming skepticism through scientific validation and consumer education

13.3 Impact of drivers and challenges

Impact of drivers and challenges in 2024 and 2029

13.4 Market opportunities

Symbiosis of heritage and high-tech in product development
Ascendancy of holistic beauty and clean ingredient ethos
Hyper-personalization and bespoke formulations

14. Competitive Landscape

14.1 Overview

14.2

Overview on criticality of inputs and factors of differentiation

14.3 Landscape disruption

Overview on factors of disruption

14.4 Industry risks

Impact of key risks on business

15. Competitive Analysis

15.1 Companies profiled

Companies covered

15.2 Company ranking index

15.3 Market positioning of companies

Matrix on companies position and classification

15.4 Avicenna CCM Ltd

Avicenna CCM Ltd - Overview
Avicenna CCM Ltd - Product / Service
Avicenna CCM Ltd - Key offerings
SWOT

15.5 Beijing Tongrentang Co Ltd.

Beijing Tongrentang Co Ltd. - Overview
Beijing Tongrentang Co Ltd. - Product / Service
Beijing Tongrentang Co Ltd. - Key offerings
SWOT

15.6 BLISS TECH LTD.

BLISS TECH LTD. - Overview
BLISS TECH LTD. - Product / Service
BLISS TECH LTD. - Key offerings
SWOT

15.7 Chando

Chando - Overview
Chando - Product / Service
Chando - Key offerings
SWOT

15.8 CHINAMED COSMETICS GmbH

CHINAMED COSMETICS GmbH - Overview
CHINAMED COSMETICS GmbH - Product / Service
CHINAMED COSMETICS GmbH - Key offerings
SWOT

15.9 EastGarden HK Int Co Ltd.

EastGarden HK Int Co Ltd. - Overview
EastGarden HK Int Co Ltd. - Product / Service
EastGarden HK Int Co Ltd. - Key offerings
SWOT

15.10 Eu Yan Sang Singapore Pte Ltd

Eu Yan Sang Singapore Pte Ltd - Overview
Eu Yan Sang Singapore Pte Ltd - Product / Service
Eu Yan Sang Singapore Pte Ltd - Key offerings
SWOT

15.11 LOreal SA

LOreal SA - Overview
LOreal SA - Business segments
LOreal SA - Key news
LOreal SA - Key offerings
LOreal SA - Segment focus
SWOT

15.12 Moonbow Skin LLC.

Moonbow Skin LLC. - Overview
Moonbow Skin LLC. - Product / Service
Moonbow Skin LLC. - Key offerings
SWOT

15.13 Muihood Ltd

Muihood Ltd - Overview
Muihood Ltd - Product / Service
Muihood Ltd - Key offerings
SWOT

15.14 Pechoin Inc.

Pechoin Inc. - Overview
Pechoin Inc. - Product / Service
Pechoin Inc. - Key offerings
SWOT

15.15 Shanghai Inoherb Cosmetics Co.Ltd

Shanghai Inoherb Cosmetics Co.Ltd - Overview
Shanghai Inoherb Cosmetics Co.Ltd - Product / Service
Shanghai Inoherb Cosmetics Co.Ltd - Key offerings
SWOT

15.16 Shanghai Jahwa United Co.Ltd

Shanghai Jahwa United Co.Ltd - Overview
Shanghai Jahwa United Co.Ltd - Product / Service
Shanghai Jahwa United Co.Ltd - Key offerings
SWOT

15.17 Vita Green Health Products Co Ltd.

Vita Green Health Products Co Ltd. - Overview
Vita Green Health Products Co Ltd. - Product / Service
Vita Green Health Products Co Ltd. - Key offerings
SWOT

15.18 YINA Inc.

YINA Inc. - Overview
YINA Inc. - Product / Service
YINA Inc. - Key offerings
SWOT

16. Appendix

16.1 Scope of the report

Market definition
Objectives
Notes and caveats

16.2 Inclusions and exclusions checklist

Inclusions checklist
Exclusions checklist

16.3 Currency conversion rates for US$

16.4 Research methodology

16.5 Data procurement

Information sources

16.6 Data validation

16.7 Validation techniques employed for market sizing

16.8 Data synthesis

16.9 360 degree market analysis

16.10 List of abbreviations

Research Methodology

Technavio presents a detailed picture of the market by way of study, synthesis, and summation of data from multiple sources. The analysts have presented the various facets of the market with a particular focus on identifying the key industry influencers. The data thus presented is comprehensive, reliable, and the result of extensive research, both primary and secondary.

INFORMATION SOURCES

Primary sources

  • Manufacturers and suppliers
  • Channel partners
  • Industry experts
  • Strategic decision makers

Secondary sources

  • Industry journals and periodicals
  • Government data
  • Financial reports of key industry players
  • Historical data
  • Press releases

DATA ANALYSIS

Data Synthesis

  • Collation of data
  • Estimation of key figures
  • Analysis of derived insights

Data Validation

  • Triangulation with data models
  • Reference against proprietary databases
  • Corroboration with industry experts

REPORT WRITING

Qualitative

  • Market drivers
  • Market challenges
  • Market trends
  • Five forces analysis

Quantitative

  • Market size and forecast
  • Market segmentation
  • Geographical insights
  • Competitive landscape

Interested in this report?

Get your sample now to see our research methodology and insights!

Download Now

Frequently Asked Questions

Traditional Chinese Medicine For Skincare market growth will increase by USD 853.4 million during 2025-2029 .

The Traditional Chinese Medicine For Skincare market is expected to grow at a CAGR of 9.2% during 2025-2029 .

Traditional Chinese Medicine For Skincare market is segmented by Distribution channel (Offline, Online) Type (Facial care, Body care, Treatments) Application (Acne, Hyperpigmentation, Psoriasis, Others)

Avicenna CCM Ltd, Beijing Tongrentang Co Ltd., BLISS TECH LTD., Chando, CHINAMED COSMETICS GmbH, EastGarden HK Int Co Ltd., Eu Yan Sang Singapore Pte Ltd, LOreal SA, Moonbow Skin LLC., Muihood Ltd, Pechoin Inc., Shanghai Inoherb Cosmetics Co.Ltd, Shanghai Jahwa United Co.Ltd, Vita Green Health Products Co Ltd., VO BEAUTY, YINA Inc. are a few of the key vendors in the Traditional Chinese Medicine For Skincare market.

APAC will register the highest growth rate of 48.7% among the other regions. Therefore, the Traditional Chinese Medicine For Skincare market in APAC is expected to garner significant business opportunities for the vendors during the forecast period.

China, Japan, India, South Korea, Australia, Indonesia, US, Canada, Mexico, Germany, UK, France, Italy, Spain, The Netherlands, Brazil, Argentina, Colombia, Saudi Arabia, UAE, South Africa, Turkey, Israel

  • Surging consumer preference for natural and clean label skincare is the driving factor this market.

The Traditional Chinese Medicine For Skincare market vendors should focus on grabbing business opportunities from the Distribution channel segment as it accounted for the largest market share in the base year.