Transportation Battery Recycling Market Size 2024-2028
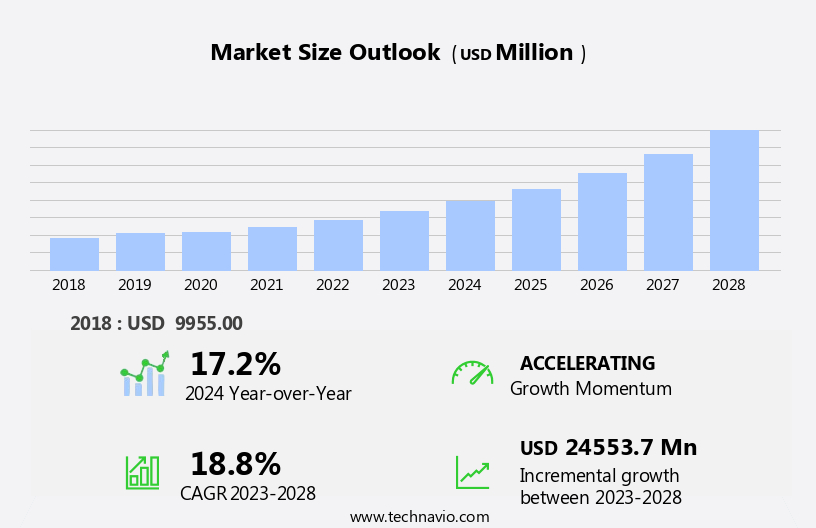
The transportation battery recycling market size is forecast to increase by USD 24.55 billion at a CAGR of 18.8% between 2023 and 2028.
-
The market is experiencing significant growth due to increasing investment in the sector and the launch of new recycling facilities. Cobalt recovery, a critical component of battery chemistry, is a major focus in this market as it is a finite resource and its extraction is energy-intensive. Resource conservation and efficiency are essential trends in the transportation battery recycling industry, as the energy intensity of battery production is high. Supercritical CO2 and mechanical steps are being employed to improve the efficiency of cobalt recovery.
-
Moreover, the recycling process must maintain electronic conductivity to ensure the quality of the recycled materials. Heavy metals, such as lithium and nickel, are also targeted for recovery. However, logistical challenges in disposing of battery waste remain a significant hurdle in the market's growth. Despite these challenges, the transportation battery recycling market forecast is poised for growth as the demand for sustainable and eco-friendly solutions continues to increase.
What will be the Size of the Transportation Battery Recycling Market During the Forecast Period?
- The market is gaining significant traction as the world shifts towards sustainable industries and green energy. Rechargeable batteries, a crucial component of electric vehicles (EVs) and renewable energy storage systems, have become an integral part of our daily lives. However, the disposal of these batteries at the end of their life cycles poses a challenge due to the presence of valuable materials and potential environmental hazards. The production and disposal of batteries contribute to greenhouse gas emissions and environmental pollution. Rechargeable batteries, particularly those used in electric vehicles, contain valuable metals like nickel, lithium, cobalt, and lead. The extraction and processing of these metals have significant energy intensity and resource consumption, leading to substantial carbon dioxide emissions. Moreover, the improper disposal of batteries can result in contamination of soil and water sources.
- Battery life cycles can be categorized into three stages, primary use, secondary use, and recycling. Recycling is an essential step in the battery life cycle, as it allows for the recovery of valuable materials and minimizes the environmental impact. Two primary recycling methods are direct recycling and pyrometallurgical recycling. Direct recycling involves the mechanical steps to recover materials directly from spent batteries without melting them. This method is suitable for batteries with low heavy metal content and high electronic conductivity, such as nickel-cadmium and nickel-metal hydride batteries. Pyrometallurgical recycling, also known as smelting, involves melting the batteries in high-temperature furnaces to separate valuable metals. This method is commonly used for lithium-ion batteries due to their high energy density and the presence of valuable metals like nickel, cobalt, and lithium. Despite the benefits of battery recycling, some challenges need to be addressed. Energy consumption is a significant concern, as the recycling process requires substantial energy inputs. Contamination is another challenge, as batteries may contain hazardous materials that can pose risks during the recycling process.
How is this market segmented and which is the largest segment?
The market research report provides comprehensive data (region-wise segment analysis), with forecasts and estimates in "USD billion" for the period 2024-2028, as well as historical data from 2018-2022 for the following segments.
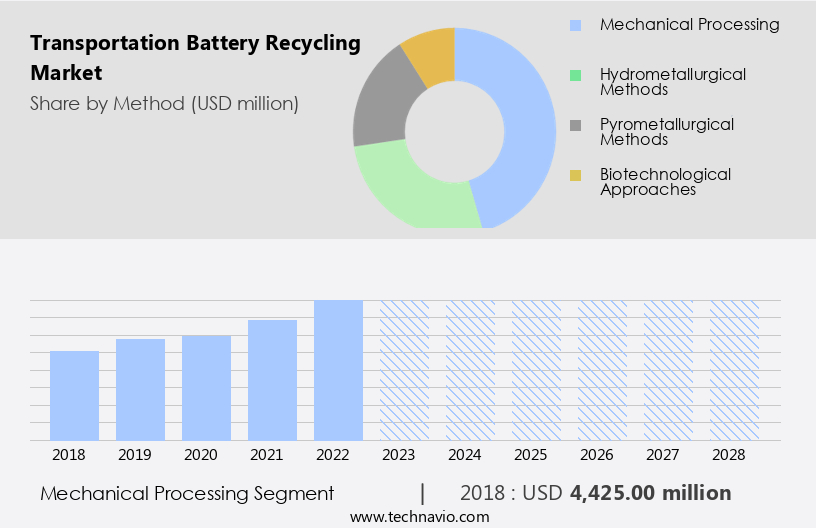
- Method
- Mechanical processing
- Hydrometallurgical methods
- Pyrometallurgical methods
- Biotechnological approaches
- Type
- Lithium-Ion batteries
- Lead acid batteries
- Nickel-metal hydride batteries
- Others
- Geography
- APAC
- China
- India
- Japan
- South Korea
- North America
- Canada
- US
- Europe
- Germany
- UK
- France
- South America
- Brazil
- Middle East and Africa
- APAC
By Method Insights
- The mechanical processing segment is estimated to witness significant growth during the forecast period.
The transportation battery recycling industry relies heavily on mechanical processing to efficiently recycle lithium-ion batteries from electric vehicles (EVs). This method is crucial for both economic gain and environmental sustainability. In August 2024, researchers at the University of Graz in Austria introduced a compact system designed specifically for recycling lithium-ion batteries from EVs. This innovative system employs a mechanical process, which consists of two primary stages. The initial stage involves a machine that securely shreds the batteries, reducing them into manageable components. Subsequently, a mechanical separation phase ensues, where various materials are sorted using physical methods. This approach ensures the recovery of valuable metals, such as lead, cadmium, and mercury, while minimizing the ecological impact. By employing renewable electricity and adhering to ecosystems' health and human health guidelines, this recycling method aligns with the global shift towards sustainable practices. The initial stage involves a machine that securely shreds the batteries, reducing them into manageable components. Subsequently, a mechanical separation phase ensues, where various materials are sorted using physical methods. This approach ensures the recovery of valuable metals, such as lead, cadmium, and mercury, while minimizing the ecological impact. By employing renewable electricity and adhering to ecosystems' health and human health guidelines, this recycling method aligns with the global shift towards sustainable practices.
Get a glance at the market report of share of various segments Request Free Sample
The mechanical processing segment was valued at USD 4.42 billion in 2018 and showed a gradual increase during the forecast period.
Regional Analysis
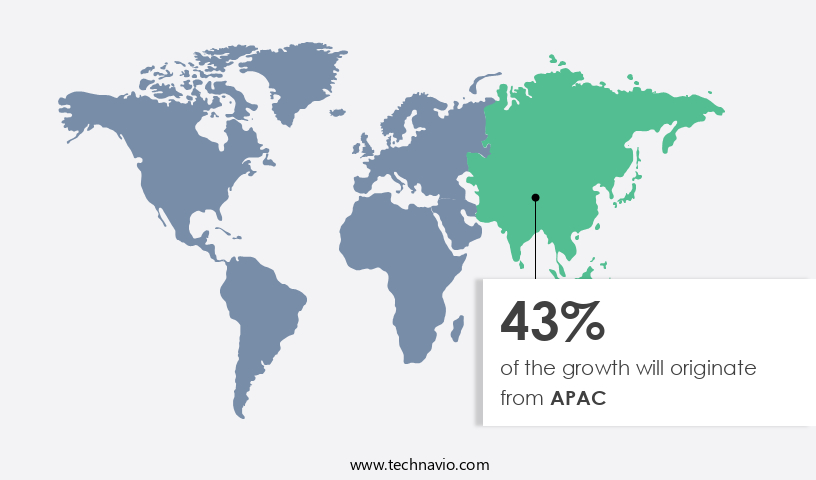
- APAC is estimated to contribute 43% to the growth of the global market during the forecast period.
Technavio's analysts have elaborately explained the regional trends and drivers that shape the market during the forecast period.
For more insights on the market share of various regions Request Free Sample
The APAC region is a significant contributor to the market, with a strong emphasis on sustainability and a growing network of recycling facilities because of increasing count of transportation battery recycling projects. The region's commitment to establishing a stable supply of raw materials for electric vehicle (EV) batteries and fostering a sustainable end-of-life battery collection and recycling system is evident in recent developments. Health and safety, working conditions, and robotic automation are essential considerations in the transportation battery recycling industry. Recycling facilities must adhere to stringent regulations to ensure the safety of workers and the environment. Robotic automation plays a crucial role in improving efficiency and reducing human intervention, ultimately contributing to cost savings and a more sustainable recycling process. Governments and industry players in the APAC region are implementing take-back schemes to encourage consumers to return their used batteries for recycling. These initiatives not only promote sustainability but also create economic opportunities for local communities and businesses. In conclusion, the APAC region's market is poised for growth, driven by strategic partnerships, a focus on sustainability, and a commitment to creating a circular economy for EV batteries.
Market Dynamics
Our researchers analyzed the data with 2023 as the base year, along with the key drivers, trends, and challenges. A holistic analysis of drivers will help companies refine their marketing strategies to gain a competitive advantage.
What are the key market drivers leading to the rise in adoption of Transportation Battery Recycling Market?
Increasing investment in the transportation battery recycling sector is the key driver of the market.
-
The market is experiencing substantial growth, fueled by increasing investments and technological advancements. This scaling-up will occur at an established brownfield industrial facility in Germany. This investment underscores the importance of reducing carbon dioxide emissions and minimizing greenhouse gases by addressing environmental pollution from spent batteries.
-
Nickel and lithium, key components of transportation batteries, are valuable resources that can be recycled through various methods, including direct recycling and pyrometallurgical recycling. By extending battery life cycles through recycling, the industry can mitigate the need for raw material extraction and contribute to a more sustainable future. Thus, such factors are driving the growth of the market during the forecast period.
What are the market trends shaping the Transportation Battery Recycling Market?
The launch of new battery recycling facilities is the upcoming trend in the market.
- The market is experiencing significant growth, with the establishment of new facilities playing a pivotal role. This facility comprises two primary processing lines, each capable of recycling 10,000 tonnes of lithium-ion battery material yearly. An additional 10,000 tonnes of ancillary capacity is planned, increasing the total capacity to 30,000 tonnes per annum.
- This large-scale facility, which is among the biggest in Europe, underscores the industry's determination to expand battery recycling capabilities. The efficient recovery of cobalt and other heavy metals from battery materials through advanced processes like supercritical CO2 and mechanical steps is crucial for resource conservation and reducing energy intensity. The increased electronic conductivity of these recycled materials is vital for maintaining battery chemistry's performance standards. Thus, such transportation battery recycling market trends will shape the growth of the market during the forecast period.
What challenges does Transportation Battery Recycling Market face during its growth?
Logistical challenges in disposing of battery waste is a key challenge affecting the market growth.
- The market is confronted with substantial logistical hurdles in managing the disposal of spent batteries. Traditional disposal methods, such as landfilling and incineration, continue to be the preferred options due to limited awareness regarding the advantages of battery recycling through reverse logistics. Reverse logistics refers to the process of transporting utilized batteries from the point of consumption back to recycling facilities. However, many consumers and businesses remain oblivious to this eco-friendly solution. A pressing concern intensifying this challenge is the scarcity of recycling infrastructure to cater to the escalating demand for battery recycling. The existing infrastructure falls short, resulting in a considerable amount of spent batteries being deposited in landfills, where they can take centuries to decompose.
- This not only contributes to energy consumption but also poses potential contamination risks. The adoption of green energy and the proliferation of rechargeable batteries in various industries necessitate a sustainable approach to battery manufacturing and disposal. Materials recovery from spent batteries is crucial to reduce the environmental impact and promote a circular economy. To address these challenges, increasing awareness and investing in advanced recycling technologies can pave the way for a more sustainable future in the market. Hence, the above factors will impede the growth of the market during the forecast period.
Exclusive Customer Landscape
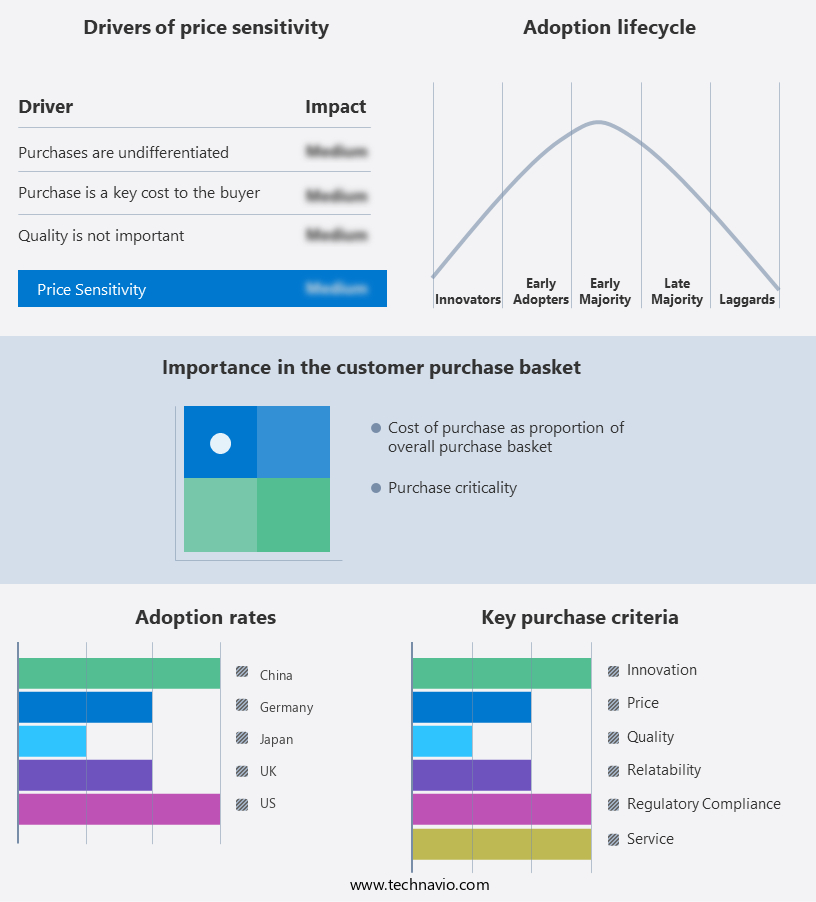
The market forecasting report includes the adoption lifecycle of the market, covering from the innovator's stage to the laggard's stage. It focuses on adoption rates in different regions based on penetration. Furthermore, the market report also includes key purchase criteria and drivers of price sensitivity to help companies evaluate and develop their market growth analysis strategies.
Customer Landscape
Key Companies & Market Insights
Companies are implementing various strategies, such as strategic alliances, market forecast, partnerships, mergers and acquisitions, geographical expansion, and product/service launches, to enhance their presence in the market.
The market research and growth report includes detailed analyses of the competitive landscape of the market and information about key companies, including:
- Call2Recycle Inc.
- Battery Solutions LLC
- Contemporary Amperex Technology Co. Ltd.
- Ecobat LLC
- EnerSys
- Exide Industries Ltd.
- Fortum Oyj
- GEM Co. Ltd.
- Gopher Resource LLC
- Li Cycle Holdings Corp.
- Lohum Cleantech Pvt. Ltd.
- Mitsui and Co. Ltd.
- Neometals Ltd.
- Novocycle Technologies
- POSCO holdings Inc.
- Primobius GmbH
- Stellantis NV
- SungEel Hi Tech Co. Ltd.
- Toyota Motor Corp.
- Umicore SA
Qualitative and quantitative analysis of companies has been conducted to help clients understand the wider business environment as well as the strengths and weaknesses of key market players. Data is qualitatively analyzed to categorize companies as pure play, category-focused, industry-focused, and diversified; it is quantitatively analyzed to categorize companies as dominant, leading, strong, tentative, and weak.
Research Analyst Overview
The market is gaining significant traction due to the increasing environmental concerns and the need for resource conservation. Rechargeable batteries, particularly lithium-ion batteries (LIBs) used in electric vehicles (EVs), are a major contributor to environmental pollution and greenhouse gas emissions. Battery life cycles are crucial in reducing the environmental impact. Recycling methods such as direct recycling and pyrometallurgical recycling are being adopted to recover valuable materials like nickel, cobalt, lithium, and other heavy metals from end-of-life batteries. Pyrometallurgical recycling involves high energy consumption and contamination risks, while hydrometallurgical processes are more energy-efficient and environmentally friendly. The recycling industry is striving to minimize the energy intensity and improve the efficiency of the recycling processes. Sustainable industries are focusing on green energy and renewable electricity to power recycling facilities. The recycling rate of batteries is a critical factor in reducing the environmental damage caused by mining and extraction of raw materials.
Furthermore, the battery chemistry, including materials like lead, cadmium, mercury, and other heavy metals, poses health and safety risks during battery disposal. Recycling facilities are implementing stringent health and safety measures and investing in robotic automation to minimize these risks. The recycling market is also focusing on reuse and minimizing the amount of batteries that end up in landfills. Precious metals like cobalt and lithium are in high demand, making battery recycling an essential part of the circular economy. The market is essential in reducing carbon dioxide emissions, minimizing the environmental impact, and preserving resources for future generations. The market is expected to grow significantly due to the increasing demand for sustainable industries, green energy, and the need to address climate change.
|
Market Scope |
|
|
Report Coverage |
Details |
|
Page number |
214 |
|
Base year |
2023 |
|
Historic period |
2018-2022 |
|
Forecast period |
2024-2028 |
|
Growth momentum & CAGR |
Accelerate at a CAGR of 18.8% |
|
Market Growth 2024-2028 |
USD 24.55 billion |
|
Market structure |
Fragmented |
|
YoY growth 2023-2024(%) |
17.2 |
|
Key countries |
China, US, Japan, Germany, UK, South Korea, India, Canada, France, and Brazil |
|
Competitive landscape |
Leading Companies, Market Positioning of Companies, Competitive Strategies, and Industry Risks |
What are the Key Data Covered in this Market Research and Growth Report?
- CAGR of the market during the forecast period
- Detailed information on factors that will drive the market growth and forecasting between 2024 and 2028
- Precise estimation of the size of the market and its contribution of the market in focus to the parent market
- Accurate predictions about upcoming market growth and trends and changes in consumer behaviour
- Growth of the market across APAC, North America, Europe, South America, and Middle East and Africa
- Thorough analysis of the market's competitive landscape and detailed information about companies
- Comprehensive analysis of factors that will challenge the growth of market companies
We can help! Our analysts can customize this market research report to meet your requirements. Get in touch
 RIA -
RIA - 
