Trash Bags Market Analysis, Size, and Forecast 2024-2028: North America (Mexico), Europe (France, Germany, Italy, Spain, and UK), Middle East and Africa (UAE), APAC (Australia, China, India, Japan, and South Korea), South America (Brazil), and Rest of World (ROW)

Trash Bags Market Analysis, Size, and Forecast 2024-2028:
North America (Mexico), Europe (France, Germany, Italy, Spain, and UK), Middle East and Africa (UAE), APAC (Australia, China, India, Japan, and South Korea), South America (Brazil), and Rest of World (ROW)

Published: Jul 2024 151 Pages SKU: IRTNTR74543

Market Overview at a Glance

$2.31 B
Market Opportunity
4.83%
CAGR
4.37
YoY growth 2023-2024(%)

Trash Bags Market Size 2024-2028

The trash bags market size is forecast to increase by USD 2.31 billion at a CAGR of 4.83% between 2023 and 2028.

  • The market is experiencing significant growth, driven by increasing awareness regarding hygiene and the resulting demand for effective waste management solutions. Rapid urbanization is another key factor fueling market expansion, as more populated areas necessitate larger quantities of trash bags. However, the market faces challenges in the form of rising concerns over plastic waste and its environmental impact. Consumers and governments are increasingly pushing for eco-friendly alternatives to traditional plastic trash bags, posing a significant obstacle for market participants. Companies seeking to capitalize on market opportunities must focus on innovation, developing biodegradable or recycled compostable plastic trash bags to meet evolving consumer demands and regulatory requirements. Navigating this complex market landscape requires a deep understanding of both the drivers and challenges shaping the market.

What will be the Size of the Trash Bags Market during the forecast period?

Trash Bags Market Size

 Request Free Sample

  • The market continues to evolve, driven by shifting consumer preferences and regulatory requirements. Waste minimization is a key focus, with an increasing demand for plant-based materials, responsible sourcing, and recycled content. The retail industry is embracing reusable and recyclable bags, while waste collection companies explore compostable bags and landfill diversion strategies. Gallon capacity and odor control remain essential considerations for residential and commercial waste, with heavy-duty bags catering to industrial applications. The smart manufacturing industry seeks to reduce its carbon footprint through low-carbon footprint and circular economy initiatives. The hospitality industry prioritizes hygiene and sustainability, favoring odor-controlled and biodegradable bags.
  • Waste management companies innovate with product design, such as drawstring closures and subscription services, to enhance convenience and reduce waste. Consumer behavior and environmental consciousness shape the market, with online retailers and green certifications influencing purchasing decisions. The market's dynamics unfold as waste awareness grows, and companies respond with product innovation, ethical production, and waste reduction strategies. Material recovery facilities play a crucial role in the circular economy, ensuring efficient recovery and recycling of waste materials. The market's continuous evolution reflects the ongoing efforts to minimize waste and promote environmental sustainability.

How is this Trash Bags Industry segmented?

The trash bags industry research report provides comprehensive data (region-wise segment analysis), with forecasts and estimates in "USD million" for the period 2024-2028, as well as historical data from 2018-2022 for the following segments.

  • End-user
    • Residential
    • Commercial
    • Industrial
  • Type
    • Biodegradable
    • Non-biodegradable
  • Product Types
    • Drawstring
    • Star-Sealed
    • Flat-Sealed
  • Distribution Channel
    • Supermarkets
    • Online Retail
    • Direct Sales
    • Distributors
  • Geography
    • North America
      • US
      • Mexico
    • Europe
      • France
      • Germany
      • Italy
      • Spain
      • UK
    • Middle East and Africa
      • UAE
    • APAC
      • Australia
      • China
      • India
      • Japan
      • South Korea
    • South America
      • Brazil
    • Rest of World (ROW)

By End-user Insights

The residential segment is estimated to witness significant growth during the forecast period.

The market for trash bags is experiencing significant growth due to the increasing generation of waste, particularly in residential areas. The rise of urban living and the convenience of ready-made food and beverages have contributed to this trend. Trash bags offer a hygienic and convenient solution for waste disposal in homes, reducing odors and minimizing the risk of spillage or leakage. Consumers' improving living standards and disposable incomes enable them to afford these disposable products as part of their everyday waste management practices. In the manufacturing industry, the product lifecycle of trash bags includes the use of various materials such as recycled plastic, plant-based materials, and biodegradable or compostable options.

Sustainable packaging, carbon offsetting, and waste reduction are becoming increasingly important considerations in the production process. Ethical production and responsible sourcing are also key concerns for both manufacturers and consumers. The retail industry plays a significant role in the distribution of trash bags, with online retailers and subscription services offering convenience and accessibility. Recycling programs and green certifications have become essential for brand loyalty, and waste awareness is a growing concern for consumers. The food service industry and hospitality sector also utilize heavy-duty, industrial-strength trash bags for waste collection. The manufacturing of trash bags involves various waste streams, including commercial waste and construction waste, which can be diverted from landfills through recycling and material recovery facilities.

The circular economy and waste minimization are important concepts in the industry, with a focus on reducing waste and promoting environmental sustainability. The product innovation in trash bags includes advancements in packaging efficiency, liners with different thicknesses, and specialized bags for specific applications, such as kitchen trash bags, hospital waste bags, and food waste bags. The market for trash bags is expected to continue growing as waste generation increases and consumers demand more sustainable and responsible waste management solutions.

Trash Bags Market Size

Request Free Sample

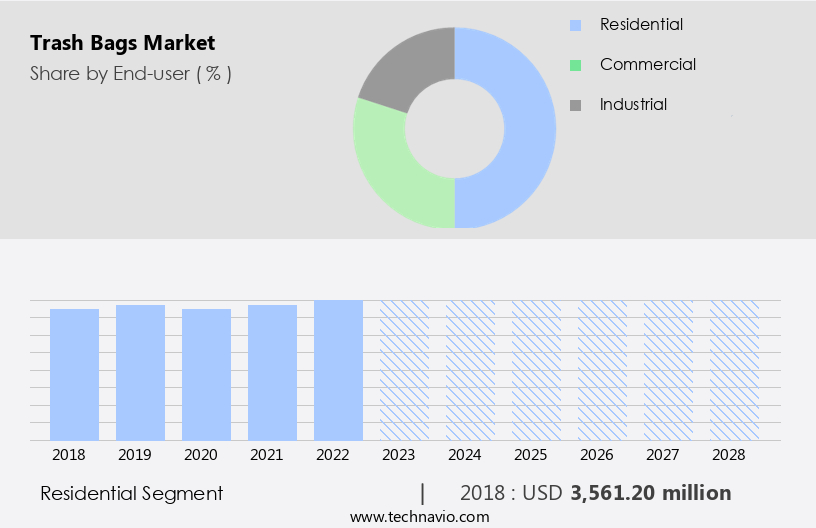
The Residential segment was valued at USD 3.56 billion in 2018 and showed a gradual increase during the forecast period.
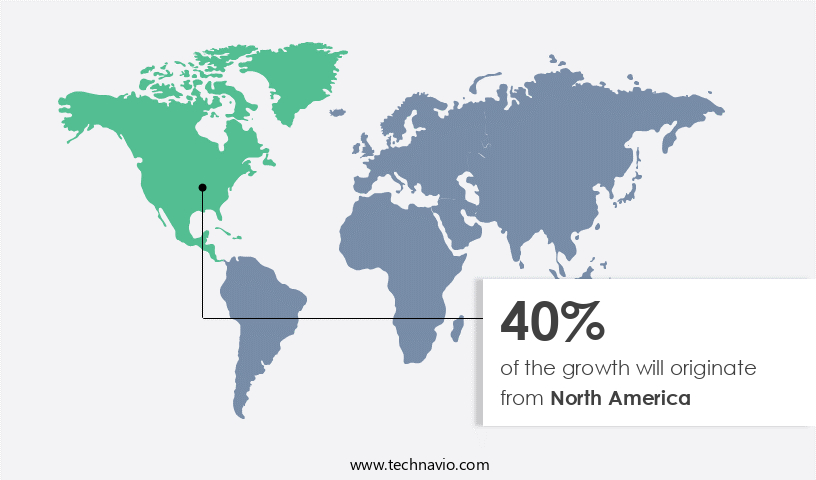
Regional Analysis

North America is estimated to contribute 40% to the growth of the global market during the forecast period.Technavio's analysts have elaborately explained the regional trends and drivers that shape the market during the forecast period.

Trash Bags Market Share by Geography

 Request Free Sample

The market is driven by various factors, including the increasing preference for bulk purchasing, recycling rates, and waste minimization. The manufacturing industry utilizes heavy-duty and industrial waste bags, while the retail industry relies on various sizes for kitchen trash bags, office trash bags, and commercial waste liners. The food service industry requires odor control and large gallon capacity bags for food waste and hospitality industry waste. The product lifecycle of trash bags includes raw material sourcing, manufacturing, packaging design, and waste disposal. Responsible sourcing of plant-based materials and recycled plastic is essential for reducing the industry's carbon footprint and promoting environmental sustainability.

The circular economy concept is gaining traction, leading to the production of compostable and biodegradable bags, which can divert waste from landfills and promote waste reduction. Price sensitivity is a critical factor in consumer behavior, with online retailers offering competitive pricing and subscription services for regular deliveries. Green certifications and waste awareness campaigns are also influencing consumer choices. Waste audits and recycling programs are essential for waste management and landfill diversion. The manufacturing industry is focusing on product innovation, ethical production, and sustainable packaging to meet the evolving market demands. Material recovery facilities and waste collection systems are crucial for efficient material recovery and minimizing waste.

Carbon offsetting and waste reduction initiatives are also gaining popularity to promote environmental consciousness. In conclusion, the market is evolving with a focus on product innovation, smart waste minimization, and environmental sustainability. The market dynamics are influenced by various factors, including consumer behavior, industry trends, and government regulations. The market is expected to continue growing, driven by the increasing demand for eco-friendly and cost-effective waste management solutions.

Market Dynamics

Our researchers analyzed the data with 2023 as the base year, along with the key drivers, trends, and challenges. A holistic analysis of drivers will help companies refine their marketing strategies to gain a competitive advantage.

The Global Trash Bags Market grows with biodegradable trash bags for households and heavy-duty trash bags for commercial use. Trash bags market trends highlight compostable trash bags for sustainability and scented trash bags for odor control. Trash bags for municipal waste and trash bags for industrial waste drive demand, per trash bags market forecast. Recyclable trash bags for environment leverage trash bags with drawstring closure, while trash bags for medical waste ensure safety. Trash bags for retail packaging and trash bags for food waste enhance convenience. Trash bags for construction debris, eco-friendly trash bag production, and trash bags for public facilities optimize usage. Trash bags for waste management, advanced trash bag materials, trash bags supply chain, trash bags for regulatory compliance, trash bags for urban areas, and trash bags for global markets fuel growth through 2028.

What are the key market drivers leading to the rise in the adoption of Trash Bags Industry?

  • The market's growth is primarily driven by heightened consciousness and prioritization of hygiene. 
  • Trash bags play a crucial role in maintaining hygiene and facilitating waste management. However, the environmental impact of their production is a growing concern, particularly as global waste generation is projected to increase by over 70% in the next three decades. The majority of the world's waste is produced in the Asia Pacific region, amounting to approximately 468 million tonnes annually (World Bank). The primary material used to manufacture trash bags is polyethylene, which poses a significant environmental risk due to inadequate recycling. To address these concerns, there is a growing demand for trash bags with post-consumer recycled content, sustainable packaging, and carbon offsetting.
  • Consumer behavior is shifting towards eco-friendly alternatives, and businesses are responding by investing in material recovery facilities to improve packaging efficiency and waste reduction. Furthermore, the importance of environmental consciousness is increasingly influencing purchasing decisions. Thinner liner thicknesses and food waste bags are also gaining popularity as solutions to reduce waste and improve sustainability in commercial waste management. Overall, the market dynamics of trash bags are evolving to meet the demands of a more environmentally-conscious consumer base.

What are the market trends shaping the Trash Bags Industry?

  • The trend in the market reflects a significant increase in demand for trash bags due to rapid urbanization. Urban development leads to an escalating need for effective waste management solutions.
  • Trash bags are in high demand due to the increasing urbanization and industrialization in emerging markets. The growing population density and rising disposable income in these regions are major factors fueling the consumption of trash bags. The market is witnessing significant growth in the retail, industrial, and institutional segments. In the retail sector, the trend of bulk purchasing is gaining popularity, leading to increased demand for larger trash bags. Construction waste bags are another significant application area, particularly in the manufacturing industry. The food service industry also contributes significantly to the market growth, with the need for smaller, more frequent trash bag replacements.
  • Recycling rates are a critical consideration in the trash bag market, with many manufacturers focusing on the use of recycled waste in their products. Price sensitivity is a key factor influencing consumer behavior, and the circular economy concept is gaining traction as a more sustainable and cost-effective solution. Biodegradable bags and those with a low-carbon footprint are also becoming increasingly popular, aligning with the global shift towards more eco-friendly solutions. In conclusion, the trash bag market is experiencing robust growth, driven by the increasing urbanization and industrialization in emerging markets. The market is diverse, with various applications in the retail, industrial, and institutional sectors.
  • The use of recycled plastic, biodegradable bags, and low-carbon footprint products are key trends shaping the market. The market is expected to continue its growth trajectory during the forecast period.

What challenges does the Trash Bags Industry face during its growth?

  • The escalating issue of plastic waste poses a significant challenge to the expansion of the industry. The global market for trash bags is witnessing significant shifts due to increasing concerns over waste minimization and environmental sustainability. In several countries, there are bans or restrictions on single-use plastic trash bags, which cannot be recycled or reused, due to their negative impact on the environment. These bags often end up in landfills or through incineration methods, leading to environmental contamination and soil and water pollution. To address these concerns, there is a growing trend towards the use of plant-based materials, compostable bags, and responsible sourcing in the production of trash bags. Retailers and the hospitality industry are adopting these eco-friendly alternatives to reduce their carbon footprint and promote waste collection and landfill diversion.
  • Industrial waste bags and heavy-duty bags are also being manufactured using sustainable materials to cater to the needs of various industries. Trash bags with odor control features are gaining popularity in both residential and commercial applications. Gallon capacity options cater to various needs, from small household use to large-scale industrial waste disposal. By prioritizing sustainability and waste reduction, the trash bag market is evolving to meet the demands of businesses and consumers alike.

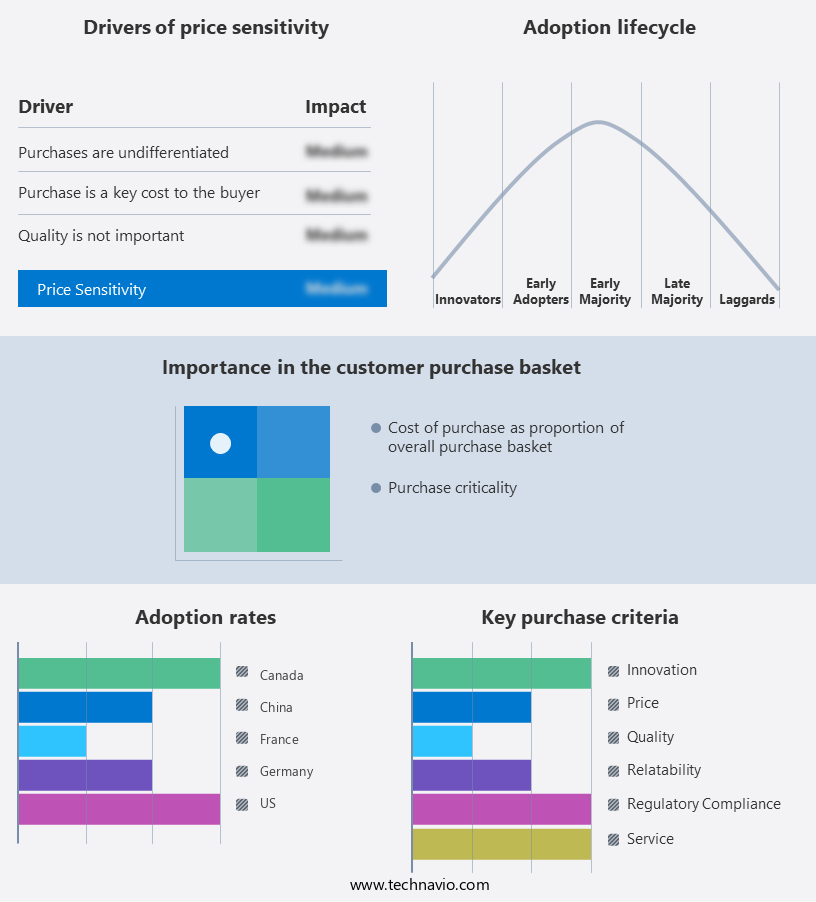
Exclusive Customer Landscape

The trash bags market forecasting report includes the adoption lifecycle of the market, covering from the innovator's stage to the laggard's stage. It focuses on adoption rates in different regions based on penetration. Furthermore, the trash bags market report also includes key purchase criteria and drivers of price sensitivity to help companies evaluate and develop their market growth analysis strategies.

Trash Bags Market Share by Geography

 Customer Landscape

Key Companies & Market Insights

Companies are implementing various strategies, such as strategic alliances, trash bags market forecast, partnerships, mergers and acquisitions, geographical expansion, and product/service launches, to enhance their presence in the industry.

Glad Products - The company specializes in providing a range of trash management solutions, including bulk bags, pallet covers, and scented trash bags. These offerings cater to various industries and applications, enhancing waste containment and disposal processes. Bulk bags offer increased capacity for large-scale waste disposal, while pallet covers ensure protection during transportation. Scented trash bags provide an additional layer of odor control, maintaining cleanliness and hygiene. Our solutions prioritize functionality, durability, and sustainability, aligning with industry best practices.

The industry research and growth report includes detailed analyses of the competitive landscape of the market and information about key companies, including:

  • Glad Products
  • Reynolds Consumer Products
  • Berry Global
  • Inteplast Group
  • Poly-America
  • Clorox
  • Novolex
  • Four Star Plastics
  • International Plastics
  • Primax
  • Terdex
  • Advance Polybag
  • BioBag International
  • Compostable Bag Company
  • Envision Plastics
  • GreenPolly
  • EcoSafe Zero Waste
  • Natur-Bag
  • Unni Eco
  • Stout

Qualitative and quantitative analysis of companies has been conducted to help clients understand the wider business environment as well as the strengths and weaknesses of key industry players. Data is qualitatively analyzed to categorize companies as pure play, category-focused, industry-focused, and diversified; it is quantitatively analyzed to categorize companies as dominant, leading, strong, tentative, and weak.

Recent Development and News in Trash Bags Market

  • In February 2023, Berry Global, a leading supplier of innovative sustainable plastic packaging, announced the acquisition of Sigma Plastics Group, a significant player in the market. This strategic move expanded Berry Global's product portfolio and strengthened its presence in the North American market (Berry Global, 2023).
  • In May 2024, Sealed Air, a leading provider of food safety and security solutions, launched its new line of Cryovac Flex-Pak Advantage trash bags, featuring enhanced strength and improved puncture resistance. This innovation catered to the growing demand for durable and reliable trash bags in the food service industry (Sealed Air, 2024).
  • In October 2024, the European Union passed the Single Use Plastics Directive, banning several single-use plastic products, including certain types of plastic bags, from the European market by 2026. This regulatory initiative created opportunities for manufacturers of biodegradable and compostable trash bags (European Parliament and Council of the European Union, 2019).
  • In January 2025, Wipro Enterprises Limited, an Indian conglomerate, announced its entry into the market through a joint venture with a leading Indian plastic manufacturer. This strategic expansion aimed to capitalize on the growing demand for affordable and eco-friendly trash bags in the Indian market (Wipro Enterprises Limited, 2025).

Research Analyst Overview

In the dynamic trash bag market, regulatory compliance plays a significant role in shaping industry trends. Packaging regulations, such as those mandating product traceability and waste sorting, drive demand for bags with specific features, including custom printing, color coding, and biodegradable plastics. Consumers increasingly prioritize eco-friendly alternatives, leading to the popularity of bamboo and hemp bags, as well as paper bags with renewable energy sourced liners. Manufacturers respond by investing in research and development, exploring biodegradable plastics, bio-based materials, and closed loop systems.

Thinner film thickness and perforation patterns aim to reduce greenhouse gas emissions, while social responsibility and anti-bacterial additives address health concerns. The market also embraces automated bagging systems and the integration of composting and anaerobic digestion technologies. Biopolymer research and supply chain transparency further fuel innovation and sustainability in the trash bag industry.

Dive into Technavio's robust research methodology, blending expert interviews, extensive data synthesis, and validated models for unparalleled Trash Bags Market insights. See full methodology.

Market Scope

Report Coverage

Details

Page number

151

Base year

2023

Historic period

2018-2022

Forecast period

2024-2028

Growth momentum & CAGR

Accelerate at a CAGR of 4.83%

Market growth 2024-2028

USD 2310.6 million

Market structure

Fragmented

YoY growth 2023-2024(%)

4.37

Key countries

US, China, Germany, Japan, UK, Australia, India, France, Brazil, UAE, Rest of World (ROW), Saudi Arabia, France, South Korea, Mexico, Italy, and Spain

Competitive landscape

Leading Companies, Market Positioning of Companies, Competitive Strategies, and Industry Risks

Request Free Sample

What are the Key Data Covered in this Trash Bags Market Research and Growth Report?

  • CAGR of the Trash Bags industry during the forecast period
  • Detailed information on factors that will drive the growth and forecasting between 2024 and 2028
  • Precise estimation of the size of the market and its contribution of the industry in focus to the parent market
  • Accurate predictions about upcoming growth and trends and changes in consumer behaviour
  • Growth of the market across North America, Europe, APAC, South America, and Middle East and Africa
  • Thorough analysis of the market's competitive landscape and detailed information about companies
  • Comprehensive analysis of factors that will challenge the trash bags market growth of industry companies

We can help! Our analysts can customize this trash bags market research report to meet your requirements.

Get in touch

1 Executive Summary

  • 1.1 Market overview
    • Executive Summary - Chart on Market Overview
    • Executive Summary - Data Table on Market Overview
    • Executive Summary - Chart on Global Market Characteristics
    • Executive Summary - Chart on Market by Geography
    • Executive Summary - Chart on Market Segmentation by End-user
    • Executive Summary - Chart on Market Segmentation by Type
    • Executive Summary - Chart on Incremental Growth
    • Executive Summary - Data Table on Incremental Growth
    • Executive Summary - Chart on Company Market Positioning

2 Market Landscape

  • 2.1 Market ecosystem
    • Parent Market
    • Data Table on - Parent Market
  • 2.2 Market characteristics
    • Market characteristics analysis
  • 2.3 Value chain analysis
    • Value Chain Analysis

3 Market Sizing

  • 3.1 Market definition
    • Offerings of companies included in the market definition
  • 3.2 Market segment analysis
    • Market segments
  • 3.3 Market size 2023
    • 3.4 Market outlook: Forecast for 2023-2028
      • Chart on Global - Market size and forecast 2023-2028 ($ million)
      • Data Table on Global - Market size and forecast 2023-2028 ($ million)
      • Chart on Global Market: Year-over-year growth 2023-2028 (%)
      • Data Table on Global Market: Year-over-year growth 2023-2028 (%)

    4 Historic Market Size

    • 4.1 Global Trash Bags Market 2018 - 2022
      • Historic Market Size - Data Table on Global Trash Bags Market 2018 - 2022 ($ million)
    • 4.2 End-user segment analysis 2018 - 2022
      • Historic Market Size - End-user Segment 2018 - 2022 ($ million)
    • 4.3 Type segment analysis 2018 - 2022
      • Historic Market Size - Type Segment 2018 - 2022 ($ million)
    • 4.4 Geography segment analysis 2018 - 2022
      • Historic Market Size - Geography Segment 2018 - 2022 ($ million)
    • 4.5 Country segment analysis 2018 - 2022
      • Historic Market Size - Country Segment 2018 - 2022 ($ million)

    5 Five Forces Analysis

    • 5.1 Five forces summary
      • Five forces analysis - Comparison between 2023 and 2028
    • 5.2 Bargaining power of buyers
      • Bargaining power of buyers - Impact of key factors 2023 and 2028
    • 5.3 Bargaining power of suppliers
      • Bargaining power of suppliers - Impact of key factors in 2023 and 2028
    • 5.4 Threat of new entrants
      • Threat of new entrants - Impact of key factors in 2023 and 2028
    • 5.5 Threat of substitutes
      • Threat of substitutes - Impact of key factors in 2023 and 2028
    • 5.6 Threat of rivalry
      • Threat of rivalry - Impact of key factors in 2023 and 2028
    • 5.7 Market condition
      • Chart on Market condition - Five forces 2023 and 2028

    6 Market Segmentation by End-user

    • 6.1 Market segments
      • Chart on End-user - Market share (2023-2028) (%)
      • Data Table on End-user - Market share (2023-2028) (%)
    • 6.2 Comparison by End-user
      • Chart on Comparison by End-user
      • Data Table on Comparison by End-user
    • 6.3 Residential - Market size and forecast (2023-2028)
      • Chart on Residential - Market size and forecast (2023-2028) ($ million)
      • Data Table on Residential - Market size and forecast (2023-2028) ($ million)
      • Chart on Residential - Year-over-year growth (2023-2028) (%)
      • Data Table on Residential - Year-over-year growth (2023-2028) (%)
    • 6.4 Commercial - Market size and forecast (2023-2028)
      • Chart on Commercial - Market size and forecast (2023-2028) ($ million)
      • Data Table on Commercial - Market size and forecast (2023-2028) ($ million)
      • Chart on Commercial - Year-over-year growth (2023-2028) (%)
      • Data Table on Commercial - Year-over-year growth (2023-2028) (%)
    • 6.5 Industrial - Market size and forecast (2023-2028)
      • Chart on Industrial - Market size and forecast (2023-2028) ($ million)
      • Data Table on Industrial - Market size and forecast (2023-2028) ($ million)
      • Chart on Industrial - Year-over-year growth (2023-2028) (%)
      • Data Table on Industrial - Year-over-year growth (2023-2028) (%)
    • 6.6 Market opportunity by End-user
      • Market opportunity by End-user ($ million)
      • Data Table on Market opportunity by End-user ($ million)

    7 Market Segmentation by Type

    • 7.1 Market segments
      • Chart on Type - Market share (2023-2028) (%)
      • Data Table on Type - Market share (2023-2028) (%)
    • 7.2 Comparison by Type
      • Chart on Comparison by Type
      • Data Table on Comparison by Type
    • 7.3 Biodegradable - Market size and forecast (2023-2028)
      • Chart on Biodegradable - Market size and forecast (2023-2028) ($ million)
      • Data Table on Biodegradable - Market size and forecast (2023-2028) ($ million)
      • Chart on Biodegradable - Year-over-year growth (2023-2028) (%)
      • Data Table on Biodegradable - Year-over-year growth (2023-2028) (%)
    • 7.4 Non-biodegradable - Market size and forecast (2023-2028)
      • Chart on Non-biodegradable - Market size and forecast (2023-2028) ($ million)
      • Data Table on Non-biodegradable - Market size and forecast (2023-2028) ($ million)
      • Chart on Non-biodegradable - Year-over-year growth (2023-2028) (%)
      • Data Table on Non-biodegradable - Year-over-year growth (2023-2028) (%)
    • 7.5 Market opportunity by Type
      • Market opportunity by Type ($ million)
      • Data Table on Market opportunity by Type ($ million)

    8 Market Segmentation by Product Types

    • 8.1 Market segments
      • Chart on Product Types - Market share (2023-2028) (%)
      • Data Table on Product Types - Market share (2023-2028) (%)
    • 8.2 Comparison by Product Types
      • Chart on Comparison by Product Types
      • Data Table on Comparison by Product Types
    • 8.3 Drawstring - Market size and forecast (2023-2028)
      • Chart on Drawstring - Market size and forecast (2023-2028) ($ million)
      • Data Table on Drawstring - Market size and forecast (2023-2028) ($ million)
      • Chart on Drawstring - Year-over-year growth (2023-2028) (%)
      • Data Table on Drawstring - Year-over-year growth (2023-2028) (%)
    • 8.4 Star-Sealed - Market size and forecast (2023-2028)
      • Chart on Star-Sealed - Market size and forecast (2023-2028) ($ million)
      • Data Table on Star-Sealed - Market size and forecast (2023-2028) ($ million)
      • Chart on Star-Sealed - Year-over-year growth (2023-2028) (%)
      • Data Table on Star-Sealed - Year-over-year growth (2023-2028) (%)
    • 8.5 Flat-Sealed - Market size and forecast (2023-2028)
      • Chart on Flat-Sealed - Market size and forecast (2023-2028) ($ million)
      • Data Table on Flat-Sealed - Market size and forecast (2023-2028) ($ million)
      • Chart on Flat-Sealed - Year-over-year growth (2023-2028) (%)
      • Data Table on Flat-Sealed - Year-over-year growth (2023-2028) (%)
    • 8.6 Market opportunity by Product Types
      • Market opportunity by Product Types ($ million)
      • Data Table on Market opportunity by Product Types ($ million)

    9 Market Segmentation by Distribution Channel

    • 9.1 Market segments
      • Chart on Distribution Channel - Market share (2023-2028) (%)
      • Data Table on Distribution Channel - Market share (2023-2028) (%)
    • 9.2 Comparison by Distribution Channel
      • Chart on Comparison by Distribution Channel
      • Data Table on Comparison by Distribution Channel
    • 9.3 Supermarkets - Market size and forecast (2023-2028)
      • Chart on Supermarkets - Market size and forecast (2023-2028) ($ million)
      • Data Table on Supermarkets - Market size and forecast (2023-2028) ($ million)
      • Chart on Supermarkets - Year-over-year growth (2023-2028) (%)
      • Data Table on Supermarkets - Year-over-year growth (2023-2028) (%)
    • 9.4 Online Retail - Market size and forecast (2023-2028)
      • Chart on Online Retail - Market size and forecast (2023-2028) ($ million)
      • Data Table on Online Retail - Market size and forecast (2023-2028) ($ million)
      • Chart on Online Retail - Year-over-year growth (2023-2028) (%)
      • Data Table on Online Retail - Year-over-year growth (2023-2028) (%)
    • 9.5 Direct Sales - Market size and forecast (2023-2028)
      • Chart on Direct Sales - Market size and forecast (2023-2028) ($ million)
      • Data Table on Direct Sales - Market size and forecast (2023-2028) ($ million)
      • Chart on Direct Sales - Year-over-year growth (2023-2028) (%)
      • Data Table on Direct Sales - Year-over-year growth (2023-2028) (%)
    • 9.6 Distributors - Market size and forecast (2023-2028)
      • Chart on Distributors - Market size and forecast (2023-2028) ($ million)
      • Data Table on Distributors - Market size and forecast (2023-2028) ($ million)
      • Chart on Distributors - Year-over-year growth (2023-2028) (%)
      • Data Table on Distributors - Year-over-year growth (2023-2028) (%)
    • 9.7 Market opportunity by Distribution Channel
      • Market opportunity by Distribution Channel ($ million)
      • Data Table on Market opportunity by Distribution Channel ($ million)

    10 Customer Landscape

    • 10.1 Customer landscape overview
      • Analysis of price sensitivity, lifecycle, customer purchase basket, adoption rates, and purchase criteria

    11 Geographic Landscape

    • 11.1 Geographic segmentation
      • Chart on Market share by geography 2023-2028 (%)
      • Data Table on Market share by geography 2023-2028 (%)
    • 11.2 Geographic comparison
      • Chart on Geographic comparison
      • Data Table on Geographic comparison
    • 11.3 North America - Market size and forecast 2023-2028
      • Chart on North America - Market size and forecast 2023-2028 ($ million)
      • Data Table on North America - Market size and forecast 2023-2028 ($ million)
      • Chart on North America - Year-over-year growth 2023-2028 (%)
      • Data Table on North America - Year-over-year growth 2023-2028 (%)
    • 11.4 Europe - Market size and forecast 2023-2028
      • Chart on Europe - Market size and forecast 2023-2028 ($ million)
      • Data Table on Europe - Market size and forecast 2023-2028 ($ million)
      • Chart on Europe - Year-over-year growth 2023-2028 (%)
      • Data Table on Europe - Year-over-year growth 2023-2028 (%)
    • 11.5 APAC - Market size and forecast 2023-2028
      • Chart on APAC - Market size and forecast 2023-2028 ($ million)
      • Data Table on APAC - Market size and forecast 2023-2028 ($ million)
      • Chart on APAC - Year-over-year growth 2023-2028 (%)
      • Data Table on APAC - Year-over-year growth 2023-2028 (%)
    • 11.6 South America - Market size and forecast 2023-2028
      • Chart on South America - Market size and forecast 2023-2028 ($ million)
      • Data Table on South America - Market size and forecast 2023-2028 ($ million)
      • Chart on South America - Year-over-year growth 2023-2028 (%)
      • Data Table on South America - Year-over-year growth 2023-2028 (%)
    • 11.7 Middle East and Africa - Market size and forecast 2023-2028
      • Chart on Middle East and Africa - Market size and forecast 2023-2028 ($ million)
      • Data Table on Middle East and Africa - Market size and forecast 2023-2028 ($ million)
      • Chart on Middle East and Africa - Year-over-year growth 2023-2028 (%)
      • Data Table on Middle East and Africa - Year-over-year growth 2023-2028 (%)
    • 11.8 US - Market size and forecast 2023-2028
      • Chart on US - Market size and forecast 2023-2028 ($ million)
      • Data Table on US - Market size and forecast 2023-2028 ($ million)
      • Chart on US - Year-over-year growth 2023-2028 (%)
      • Data Table on US - Year-over-year growth 2023-2028 (%)
    • 11.9 China - Market size and forecast 2023-2028
      • Chart on China - Market size and forecast 2023-2028 ($ million)
      • Data Table on China - Market size and forecast 2023-2028 ($ million)
      • Chart on China - Year-over-year growth 2023-2028 (%)
      • Data Table on China - Year-over-year growth 2023-2028 (%)
    • 11.10 Germany - Market size and forecast 2023-2028
      • Chart on Germany - Market size and forecast 2023-2028 ($ million)
      • Data Table on Germany - Market size and forecast 2023-2028 ($ million)
      • Chart on Germany - Year-over-year growth 2023-2028 (%)
      • Data Table on Germany - Year-over-year growth 2023-2028 (%)
    • 11.11 France - Market size and forecast 2023-2028
      • Chart on France - Market size and forecast 2023-2028 ($ million)
      • Data Table on France - Market size and forecast 2023-2028 ($ million)
      • Chart on France - Year-over-year growth 2023-2028 (%)
      • Data Table on France - Year-over-year growth 2023-2028 (%)
    • 11.12 Canada - Market size and forecast 2023-2028
      • Chart on Canada - Market size and forecast 2023-2028 ($ million)
      • Data Table on Canada - Market size and forecast 2023-2028 ($ million)
      • Chart on Canada - Year-over-year growth 2023-2028 (%)
      • Data Table on Canada - Year-over-year growth 2023-2028 (%)
    • 11.13 Market opportunity by geography
      • Market opportunity by geography ($ million)
      • Data Tables on Market opportunity by geography ($ million)
    • 11.14 US - Market size and forecast (2023-2028)
      • Chart on US - Market size and forecast (2023-2028) ($ million)
      • Data Table on US - Market size and forecast (2023-2028) ($ million)
      • Chart on US - Year-over-year growth (2023-2028) (%)
      • Data Table on US - Year-over-year growth (2023-2028) (%)
    • 11.15 Japan - Market size and forecast (2023-2028)
      • Chart on Japan - Market size and forecast (2023-2028) ($ million)
      • Data Table on Japan - Market size and forecast (2023-2028) ($ million)
      • Chart on Japan - Year-over-year growth (2023-2028) (%)
      • Data Table on Japan - Year-over-year growth (2023-2028) (%)
    • 11.16 UK - Market size and forecast (2023-2028)
      • Chart on UK - Market size and forecast (2023-2028) ($ million)
      • Data Table on UK - Market size and forecast (2023-2028) ($ million)
      • Chart on UK - Year-over-year growth (2023-2028) (%)
      • Data Table on UK - Year-over-year growth (2023-2028) (%)
    • 11.17 Australia - Market size and forecast (2023-2028)
      • Chart on Australia - Market size and forecast (2023-2028) ($ million)
      • Data Table on Australia - Market size and forecast (2023-2028) ($ million)
      • Chart on Australia - Year-over-year growth (2023-2028) (%)
      • Data Table on Australia - Year-over-year growth (2023-2028) (%)
    • 11.18 India - Market size and forecast (2023-2028)
      • Chart on India - Market size and forecast (2023-2028) ($ million)
      • Data Table on India - Market size and forecast (2023-2028) ($ million)
      • Chart on India - Year-over-year growth (2023-2028) (%)
      • Data Table on India - Year-over-year growth (2023-2028) (%)
    • 11.19 Brazil - Market size and forecast (2023-2028)
      • Chart on Brazil - Market size and forecast (2023-2028) ($ million)
      • Data Table on Brazil - Market size and forecast (2023-2028) ($ million)
      • Chart on Brazil - Year-over-year growth (2023-2028) (%)
      • Data Table on Brazil - Year-over-year growth (2023-2028) (%)
    • 11.20 UAE - Market size and forecast (2023-2028)
      • Chart on UAE - Market size and forecast (2023-2028) ($ million)
      • Data Table on UAE - Market size and forecast (2023-2028) ($ million)
      • Chart on UAE - Year-over-year growth (2023-2028) (%)
      • Data Table on UAE - Year-over-year growth (2023-2028) (%)
    • 11.21 Rest of World (ROW) - Market size and forecast (2023-2028)
      • Chart on Rest of World (ROW) - Market size and forecast (2023-2028) ($ million)
      • Data Table on Rest of World (ROW) - Market size and forecast (2023-2028) ($ million)
      • Chart on Rest of World (ROW) - Year-over-year growth (2023-2028) (%)
      • Data Table on Rest of World (ROW) - Year-over-year growth (2023-2028) (%)
    • 11.22 Saudi Arabia - Market size and forecast (2023-2028)
      • Chart on Saudi Arabia - Market size and forecast (2023-2028) ($ million)
      • Data Table on Saudi Arabia - Market size and forecast (2023-2028) ($ million)
      • Chart on Saudi Arabia - Year-over-year growth (2023-2028) (%)
      • Data Table on Saudi Arabia - Year-over-year growth (2023-2028) (%)
    • 11.23 South Korea - Market size and forecast (2023-2028)
      • Chart on South Korea - Market size and forecast (2023-2028) ($ million)
      • Data Table on South Korea - Market size and forecast (2023-2028) ($ million)
      • Chart on South Korea - Year-over-year growth (2023-2028) (%)
      • Data Table on South Korea - Year-over-year growth (2023-2028) (%)
    • 11.24 Mexico - Market size and forecast (2023-2028)
      • Chart on Mexico - Market size and forecast (2023-2028) ($ million)
      • Data Table on Mexico - Market size and forecast (2023-2028) ($ million)
      • Chart on Mexico - Year-over-year growth (2023-2028) (%)
      • Data Table on Mexico - Year-over-year growth (2023-2028) (%)
    • 11.25 Italy - Market size and forecast (2023-2028)
      • Chart on Italy - Market size and forecast (2023-2028) ($ million)
      • Data Table on Italy - Market size and forecast (2023-2028) ($ million)
      • Chart on Italy - Year-over-year growth (2023-2028) (%)
      • Data Table on Italy - Year-over-year growth (2023-2028) (%)
    • 11.26 Spain - Market size and forecast (2023-2028)
      • Chart on Spain - Market size and forecast (2023-2028) ($ million)
      • Data Table on Spain - Market size and forecast (2023-2028) ($ million)
      • Chart on Spain - Year-over-year growth (2023-2028) (%)
      • Data Table on Spain - Year-over-year growth (2023-2028) (%)

    12 Drivers, Challenges, and Opportunity/Restraints

    • 12.1 Market drivers
      • 12.2 Market challenges
        • 12.3 Impact of drivers and challenges
          • Impact of drivers and challenges in 2023 and 2028
        • 12.4 Market opportunities/restraints

          13 Competitive Landscape

          • 13.1 Overview
            • 13.2 Competitive Landscape
              • Overview on criticality of inputs and factors of differentiation
            • 13.3 Landscape disruption
              • Overview on factors of disruption
            • 13.4 Industry risks
              • Impact of key risks on business

            14 Competitive Analysis

            • 14.1 Companies profiled
              • Companies covered
            • 14.2 Market positioning of companies
              • Matrix on companies position and classification
            • 14.3 Glad Products
              • Glad Products - Overview
              • Glad Products - Product / Service
              • Glad Products - Key offerings
            • 14.4 Reynolds Consumer Products
              • Reynolds Consumer Products - Overview
              • Reynolds Consumer Products - Product / Service
              • Reynolds Consumer Products - Key offerings
            • 14.5 Berry Global
              • Berry Global - Overview
              • Berry Global - Product / Service
              • Berry Global - Key offerings
            • 14.6 Inteplast Group
              • Inteplast Group - Overview
              • Inteplast Group - Product / Service
              • Inteplast Group - Key offerings
            • 14.7 Poly-America
              • Poly-America - Overview
              • Poly-America - Product / Service
              • Poly-America - Key offerings
            • 14.8 Clorox
              • Clorox - Overview
              • Clorox - Product / Service
              • Clorox - Key offerings
            • 14.9 Novolex
              • Novolex - Overview
              • Novolex - Product / Service
              • Novolex - Key offerings
            • 14.10 Four Star Plastics
              • Four Star Plastics - Overview
              • Four Star Plastics - Product / Service
              • Four Star Plastics - Key offerings
            • 14.11 International Plastics
              • International Plastics - Overview
              • International Plastics - Product / Service
              • International Plastics - Key offerings
            • 14.12 Primax
              • Primax - Overview
              • Primax - Product / Service
              • Primax - Key offerings
            • 14.13 Terdex
              • Terdex - Overview
              • Terdex - Product / Service
              • Terdex - Key offerings
            • 14.14 Advance Polybag
              • Advance Polybag - Overview
              • Advance Polybag - Product / Service
              • Advance Polybag - Key offerings
            • 14.15 BioBag International
              • BioBag International - Overview
              • BioBag International - Product / Service
              • BioBag International - Key offerings
            • 14.16 Compostable Bag Company
              • Compostable Bag Company - Overview
              • Compostable Bag Company - Product / Service
              • Compostable Bag Company - Key offerings
            • 14.17 Envision Plastics
              • Envision Plastics - Overview
              • Envision Plastics - Product / Service
              • Envision Plastics - Key offerings
            • 14.18 GreenPolly
              • GreenPolly - Overview
              • GreenPolly - Product / Service
              • GreenPolly - Key offerings
            • 14.19 EcoSafe Zero Waste
              • EcoSafe Zero Waste - Overview
              • EcoSafe Zero Waste - Product / Service
              • EcoSafe Zero Waste - Key offerings
            • 14.20 Natur-Bag
              • Natur-Bag - Overview
              • Natur-Bag - Product / Service
              • Natur-Bag - Key offerings
            • 14.21 Unni Eco
              • Unni Eco - Overview
              • Unni Eco - Product / Service
              • Unni Eco - Key offerings
            • 14.22 Stout
              • Stout - Overview
              • Stout - Product / Service
              • Stout - Key offerings
            • 14.23 Achaika Plastic S.A.
              • Achaika Plastic S.A. - Overview
              • Achaika Plastic S.A. - Product / Service
              • Achaika Plastic S.A. - Key offerings
            • 14.24 Alpha Omega Plastic Manufacturing L.L.C.
              • Alpha Omega Plastic Manufacturing L.L.C. - Overview
              • Alpha Omega Plastic Manufacturing L.L.C. - Product / Service
              • Alpha Omega Plastic Manufacturing L.L.C. - Key offerings
            • 14.25 ALUF Plastics
              • ALUF Plastics - Overview
              • ALUF Plastics - Product / Service
              • ALUF Plastics - Key offerings
            • 14.26 Berry Global Inc.
              • Berry Global Inc. - Overview
              • Berry Global Inc. - Product / Service
              • Berry Global Inc. - Key offerings
            • 14.27 BioBag Americas Inc.
              • BioBag Americas Inc. - Overview
              • BioBag Americas Inc. - Product / Service
              • BioBag Americas Inc. - Key offerings
            • 14.28 Complete Packaging and Shipping Supplies
              • Complete Packaging and Shipping Supplies - Overview
              • Complete Packaging and Shipping Supplies - Product / Service
              • Complete Packaging and Shipping Supplies - Key offerings
            • 14.29 Cosmoplast Ind. Co. LLC
              • Cosmoplast Ind. Co. LLC - Overview
              • Cosmoplast Ind. Co. LLC - Product / Service
              • Cosmoplast Ind. Co. LLC - Key offerings
            • 14.30 Four Star Plastics
              • Four Star Plastics - Overview
              • Four Star Plastics - Product / Service
              • Four Star Plastics - Key offerings
            • 14.31 Inteplast Group
              • Inteplast Group - Overview
              • Inteplast Group - Product / Service
              • Inteplast Group - Key offerings
            • 14.32 International Plastics Inc.
              • International Plastics Inc. - Overview
              • International Plastics Inc. - Product / Service
              • International Plastics Inc. - Key offerings
            • 14.33 Les Industries Polykar Inc.
              • Les Industries Polykar Inc. - Overview
              • Les Industries Polykar Inc. - Product / Service
              • Les Industries Polykar Inc. - Key offerings
            • 14.34 Luban Packing LLC
              • Luban Packing LLC - Overview
              • Luban Packing LLC - Product / Service
              • Luban Packing LLC - Key offerings
            • 14.35 Mapco Pvt. Ltd.
              • Mapco Pvt. Ltd. - Overview
              • Mapco Pvt. Ltd. - Product / Service
              • Mapco Pvt. Ltd. - Key offerings
            • 14.36 Mir Pack
              • Mir Pack - Overview
              • Mir Pack - Product / Service
              • Mir Pack - Key offerings
            • 14.37 NOVPLASTA CZ s.r.o.
              • NOVPLASTA CZ s.r.o. - Overview
              • NOVPLASTA CZ s.r.o. - Product / Service
              • NOVPLASTA CZ s.r.o. - Key offerings
            • 14.38 Pack It B.V.
              • Pack It B.V. - Overview
              • Pack It B.V. - Product / Service
              • Pack It B.V. - Key offerings
            • 14.39 PLASTA
              • PLASTA - Overview
              • PLASTA - Product / Service
              • PLASTA - Key offerings
            • 14.40 Poly America L.P.
              • Poly America L.P. - Overview
              • Poly America L.P. - Product / Service
              • Poly America L.P. - Key offerings
            • 14.41 Reynolds Consumer Products
              • Reynolds Consumer Products - Overview
              • Reynolds Consumer Products - Product / Service
              • Reynolds Consumer Products - Key offerings
            • 14.42 TERDEX GmbH
              • TERDEX GmbH - Overview
              • TERDEX GmbH - Product / Service
              • TERDEX GmbH - Key offerings
            • 14.43 The Clorox Co.
              • The Clorox Co. - Overview
              • The Clorox Co. - Product / Service
              • The Clorox Co. - Key offerings
            • 14.44 Universal Plastic Bags
              • Universal Plastic Bags - Overview
              • Universal Plastic Bags - Product / Service
              • Universal Plastic Bags - Key offerings

            15 Appendix

            • 15.1 Scope of the report
              • 15.2 Inclusions and exclusions checklist
                • Inclusions checklist
                • Exclusions checklist
              • 15.3 Currency conversion rates for US$
                • Currency conversion rates for US$
              • 15.4 Research methodology
                • Research methodology
              • 15.5 Data procurement
                • Information sources
              • 15.6 Data validation
                • Data validation
              • 15.7 Validation techniques employed for market sizing
                • Validation techniques employed for market sizing
              • 15.8 Data synthesis
                • Data synthesis
              • 15.9 360 degree market analysis
                • 360 degree market analysis
              • 15.10 List of abbreviations
                • List of abbreviations

              Research Methodology

              Technavio presents a detailed picture of the market by way of study, synthesis, and summation of data from multiple sources. The analysts have presented the various facets of the market with a particular focus on identifying the key industry influencers. The data thus presented is comprehensive, reliable, and the result of extensive research, both primary and secondary.

              INFORMATION SOURCES

              Primary sources

              • Manufacturers and suppliers
              • Channel partners
              • Industry experts
              • Strategic decision makers

              Secondary sources

              • Industry journals and periodicals
              • Government data
              • Financial reports of key industry players
              • Historical data
              • Press releases

              DATA ANALYSIS

              Data Synthesis

              • Collation of data
              • Estimation of key figures
              • Analysis of derived insights

              Data Validation

              • Triangulation with data models
              • Reference against proprietary databases
              • Corroboration with industry experts

              REPORT WRITING

              Qualitative

              • Market drivers
              • Market challenges
              • Market trends
              • Five forces analysis

              Quantitative

              • Market size and forecast
              • Market segmentation
              • Geographical insights
              • Competitive landscape

              Interested in this report?

              Get your sample now to see our research methodology and insights!

              Download Now

              Frequently Asked Questions

              Trash Bags market growth will increase by $ 2310.6 mn during 2024-2028.

              The Trash Bags market is expected to grow at a CAGR of 4.83% during 2024-2028.

              Trash Bags market is segmented by End-user( Residential, Commercial, Industrial) Type( Biodegradable, Non-biodegradable)

              Glad Products, Reynolds Consumer Products, Berry Global, Inteplast Group, Poly-America, Clorox, Novolex, Four Star Plastics, International Plastics, Primax, Terdex, Advance Polybag, BioBag International, Compostable Bag Company, Envision Plastics, GreenPolly, EcoSafe Zero Waste, Natur-Bag, Unni Eco, Stout are a few of the key vendors in the Trash Bags market.

              North America will register the highest growth rate of 40% among the other regions. Therefore, the Trash Bags market in North America is expected to garner significant business opportunities for the vendors during the forecast period.

              US, China, Germany, Japan, UK, Australia, India, France, Brazil, UAE, Rest of World (ROW), Saudi Arabia, France, South Korea, Mexico, Italy, Spain

              • Increasing awareness regarding hygieneHuman well-being has long depended on good hygiene. The Asia Pacific is said to produce the majority of the world's waste is the driving factor this market.
              • roughly 468 million tonnes yearly is the driving factor this market.
              • according to worldbank.org. In the next 30 years is the driving factor this market.
              • trash creation is expected to increase by 70% is the driving factor this market.
              • or over 3.4 billion tonnes yearly. In the coming years is the driving factor this market.
              • it is projected that this increase in waste generation will accelerate the growth of trash bags. The material used to produce trash bags is an important consideration is the driving factor this market.
              • even though they are helpful for maintaining hygiene. Trash bags are frequently made of polyethylene is the driving factor this market.
              • which poses a serious environmental risk because it is not recycled correctly. A surge in awareness about hygiene and cleanliness is expected to drive the growth of the global trash market during the forecast period.   is the driving factor this market.

              The Trash Bags market vendors should focus on grabbing business opportunities from the Residential segment as it accounted for the largest market share in the base year.
              RIA - Research AI Assistant
              Ask RIA