Two-Wheeler Electronic Control Unit (ECU) Market Size 2025-2029
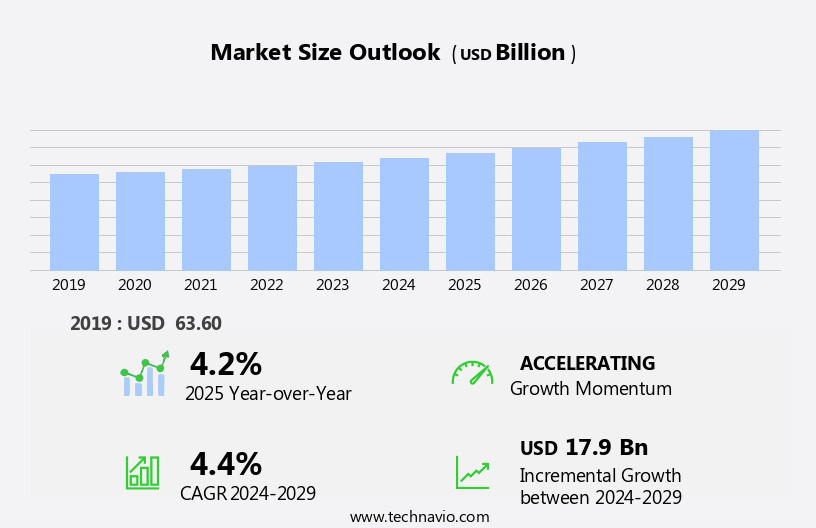
The two-wheeler electronic control unit (ECU) market size is forecast to increase by USD 17.9 billion, at a CAGR of 4.4% between 2024 and 2029.
- The market is experiencing significant growth, driven by the increasing electrification of mechanical components and the integration of smartphone connectivity for diagnostics. The trend towards electrification is transforming the two-wheeler industry, with ECUs becoming an essential component for managing the powertrain and other vehicle systems. Moreover, the growing availability of affordable electric two-wheelers is expanding the market's reach to a broader customer base. Sensor inputs provide real-time data for engine management, ensuring efficient and effective engine operation. However, the market also faces challenges, including the need for standardization and interoperability in ECU systems. Additionally, the high cost of advanced ECUs and the lack of charging infrastructure in some regions pose significant obstacles to market growth.
- Additionally, the integration of smartphone connectivity for two-wheeler diagnostics is gaining traction, enabling real-time monitoring and remote troubleshooting. To capitalize on the opportunities presented by this market, companies must focus on developing cost-effective, standardized ECU solutions that cater to the needs of both traditional and electric two-wheeler segments. Effective collaboration between industry players, governments, and infrastructure providers can help address the challenges and accelerate market growth.
What will be the Size of the Two-Wheeler Electronic Control Unit (ECU) Market during the forecast period?
- The market encompasses various components, including battery management, motor control, fueling DC conversion, and powertrain motor systems. Two-wheeler ECUs encompass a range of systems, including body control units, sensors, engine immobilizers, antitheft alarms, and telematics. Automotive engineers design these ECUs to monitor and manage engine parameters, battery systems, body control units, ignition timing, and advanced diagnostics. Telematics, compatibility with OEMs' Android infotainment systems, and antitheft alarms are increasingly integrated into these ECUs. Electric motorcycles and electric cars are driving the demand for sophisticated ECUs. Sensors, data logging, and CAN networks facilitate communication between vehicle ECUs, enhancing vehicle performance and safety. Fuel level and battery system management are critical aspects of electric vehicles' ECUs.
- The DC conversion system in two-wheeler ECUs is a critical aspect, converting the direct current (DC) from the battery into alternating current (AC) for powering various vehicle systems. Engine immobilizers and motor control ensure vehicle security and efficient power delivery. Battery management systems play a crucial role in electric vehicles' ECUs, optimizing battery usage and ensuring longevity. Motor control ECUs regulate the electric motor's power flow, ensuring optimal performance. Fueling ECUs manage the charging process, while DC conversion ECUs convert direct current from the battery to alternating current for vehicle systems. The integration of advanced electronics in two-wheeler ECUs continues to evolve, with sensors and data logging capabilities providing real-time vehicle performance information for enthusiasts. The future of the two-wheeler ECU market lies in the development of more efficient, integrated systems that optimize vehicle performance and safety.
How is this Two-Wheeler Electronic Control Unit (ECU) Industry segmented?
The two-wheeler electronic control unit (ECU) industry research report provides comprehensive data (region-wise segment analysis), with forecasts and estimates in "USD billion" for the period 2025-2029, as well as historical data from 2019-2023 for the following segments.
- End-user
- Commuter
- Mid-premium
- Premium
- Vehicle Type
- Motorcycles
- Scooters
- Mopeds
- Technology
- Conventional ECUs
- AI and ML-based ECUs
- Cloud-connected ECUs
- Autonomous ride ECUs
- Geography
- North America
- US
- Canada
- Europe
- Germany
- APAC
- China
- India
- Indonesia
- Thailand
- Vietnam
- South America
- Argentina
- Brazil
- Rest of World (ROW)
- North America
By End-user Insights
- The commuter segment is estimated to witness significant growth during the forecast period. The market is witnessing significant growth due to the integration of advanced technologies in motorcycles. New innovations, such as Antitheft alarms and advanced diagnostics, are becoming essential features for consumers. Sensor inputs, including ignition timing, Induction motor, and engine functions, are optimized for improved efficiency and performance. Motor control, fuel consumption monitoring, and critical component monitoring are critical functionalities that are driving the demand for ECUs in motorcycles. The adoption of electric motorcycles and scooters is increasing, leading to the integration of Powertrain ECUs, battery systems, and Battery Management Systems (BMS). Stricter emission standards are also encouraging the use of efficient engine management systems and fuel injection.
- Telematics and Android Infotainment systems are also gaining popularity, offering advanced features like real-time monitoring, data logging, and fueling information. Major OEMs are investing in research and development to introduce new technologies, such as CAN networks, motor control, and DC conversion. For instance, the integration of AC motors in electric motorcycles and Electric Cars is a recent trend. Engine immobilizers and advanced diagnostics are also becoming standard features to enhance security and performance. The demand for advanced features, such as throttle position control and compatibility with various sensors, is increasing, driving the growth of the two-wheeler ECU market.
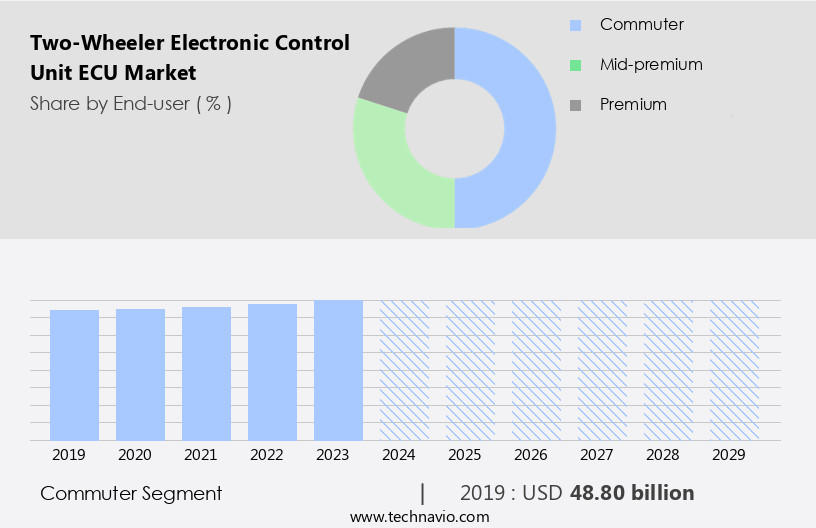
The Commuter segment was valued at USD 48.80 billion in 2019 and showed a gradual increase during the forecast period.
Regional Analysis
APAC is estimated to contribute 38% to the growth of the global market during the forecast period. Technavio's analysts have elaborately explained the regional trends and drivers that shape the market during the forecast period.
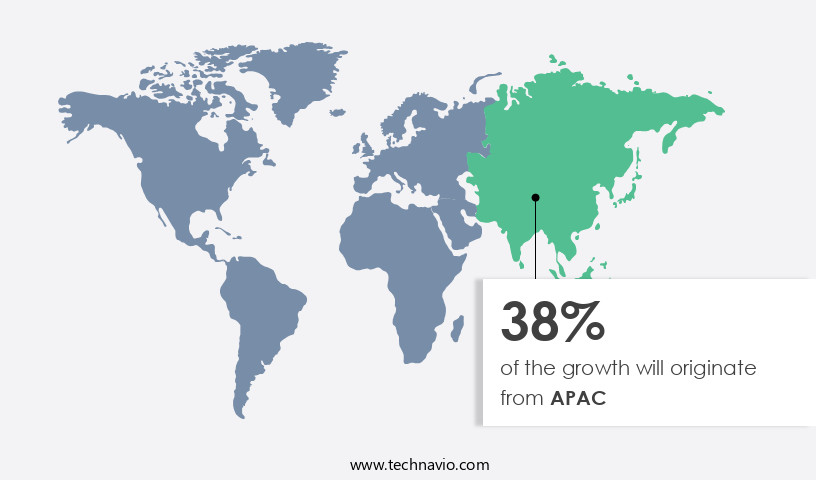
- The market in the region is experiencing significant growth due to the increasing adoption of two-wheelers, a growing awareness of operational efficiency, and technological advancements. Motorcycles and scooters, which are majorly used for commuting in APAC, are seen as personalized and cost-effective alternatives to public transportation and cars. The demand for two-wheelers is driven by factors such as increasing fuel prices, road congestion, and cost-sensitive buying behavior. Advanced diagnostics, sensor inputs, ignition timing, and optimizing engine functions are critical components of ECUs in two-wheelers. New technologies, such as Electric and Induction motors, are gaining popularity, leading to the development of Powertrain ECUs and Battery Management Systems (BMS).
- Motor control, fueling, and monitoring functionalities are essential for enhancing performance and efficiency. Major OEMs are investing in the development of advanced features, including engine management, emission standards, and telematics. Electric motorcycles and scooters are also gaining traction, expanding the customer base and increasing the demand for ECUs. The integration of Android Infotainment systems and AC motors in two-wheelers is further driving the market growth. The use of CAN networks and DC conversion in two-wheelers enables seamless data logging and communication between various vehicle systems. The integration of sensors for monitoring fuel consumption, engine parameters, and battery system health is essential for maintaining optimal performance and longevity. Stricter emission standards are pushing automotive engineers to innovate and develop efficient engine immobilizers and fuel injection systems.
Market Dynamics
Our researchers analyzed the data with 2024 as the base year, along with the key drivers, trends, and challenges. A holistic analysis of drivers will help companies refine their marketing strategies to gain a competitive advantage.
What are the Two-Wheeler Electronic Control Unit (ECU) market drivers leading to the rise in the adoption of Industry?
- The significant growth driver for the market is the increased electrification of mechanical components. This trend reflects the industry's shift towards more sustainable and efficient energy solutions, as well as advancements in technology that enable the integration of electricity into traditionally mechanical systems. The market has experienced significant growth in recent years due to the increasing demand for advanced technology in the motorcycle industry. As vehicles become more electronic, traditional mechanical components are being replaced by electronic systems. This trend is driven by several factors, including the need for reduced emissions, enhanced safety, energy efficiency, and improved driver information and assistance. The adoption of ECUs in two-wheelers is particularly noteworthy in the context of the growing popularity of electric motorcycles. These vehicles offer a more deep riding experience, as well as advanced features such as engine parameters monitoring and controlling, lamp load management, and idle speed regulation.
- Moreover, the integration of Android infotainment systems and telematics in motorcycles is further fueling the demand for ECUs. These systems provide real-time information to the rider, enabling them to optimize their ride and improve overall vehicle performance. Manufacturers are increasingly investing in research and development to create more efficient and sophisticated ECUs for two-wheelers. This trend is expected to continue as the market for electric motorcycles continues to expand and the demand for more advanced features grows. As technology continues to advance, these systems will become increasingly important in delivering a better riding experience and improving the overall efficiency and safety of motorcycles.
What are the Two-Wheeler Electronic Control Unit (ECU) market trends shaping the Industry?
- Two-wheeler diagnostics are increasingly adopting smartphone connectivity as the latest market trend. This innovation enables riders to monitor and analyze vehicle performance using their mobile devices. The market is witnessing significant growth due to the integration of advanced technologies. Bosch's Motronic ECU is a prime example, offering a smart, versatile, and scalable solution for two-wheelers. This ECU enables riders to connect their smartphones, providing an interface to access engine information such as speed, fuel consumption, and route distance. Furthermore, immobilizers can be activated via smartphones, cutting off the fuel supply to the engine for added security.
- Additionally, smartphones can function as diagnostic tools, allowing riders to identify malfunctions and view related data. These features enhance the riding experience and contribute to the market's expansion.
How does Two-Wheeler Electronic Control Unit (ECU) market faces challenges during its growth?
- The increasing accessibility of affordable vehicles poses a significant challenge to the industry's growth trajectory. The market is experiencing significant growth due to the increasing adoption of advanced technologies in the motorcycle industry. Major motorcycle manufacturers are integrating ECUs to optimize engine performance, monitor fuel consumption, and implement new features such as antitheft alarms and body control units. These devices collect sensor inputs to provide real-time diagnostics and ensure efficient engine functions. Advanced diagnostics offered by ECUs help in identifying potential issues before they become major problems, reducing downtime and maintenance costs. Induction motors and ignition timing are crucial engine functions that ECUs manage, ensuring optimal performance and compliance with stringent emission norms.
- New technologies like electric motorcycles are also adopting ECUs to manage battery management systems and motor control. Despite the benefits, the high cost of ECUs poses a challenge for manufacturers. As these devices incorporate advanced sensors and technologies, their prices are relatively high. This can lead to increased vehicle prices, potentially reducing demand and impacting sales. To remain competitive, manufacturers must balance the cost of implementing these technologies with the price of their products. Manufacturers must carefully consider these factors and price their products competitively to maintain their market position.
Exclusive Customer Landscape
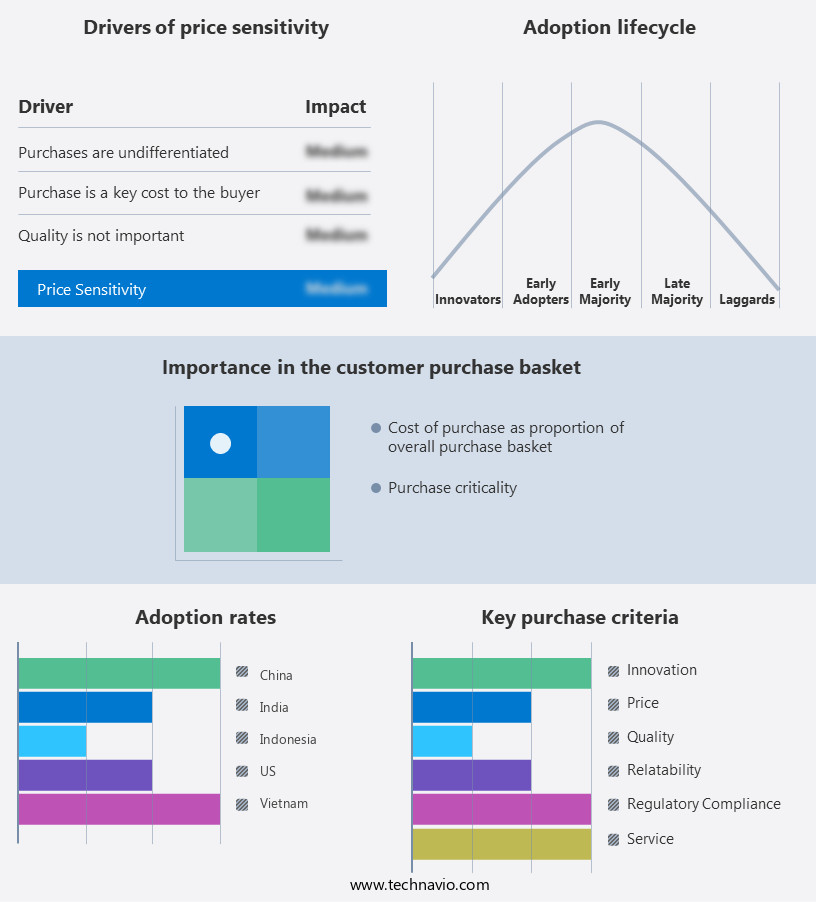
The two-wheeler electronic control unit (ECU) market forecasting report includes the adoption lifecycle of the market, covering from the innovator's stage to the laggard's stage. It focuses on adoption rates in different regions based on penetration. Furthermore, the two-wheeler electronic control unit (ECU) market report also includes key purchase criteria and drivers of price sensitivity to help companies evaluate and develop their market growth analysis strategies.
Customer Landscape
Key Companies & Market Insights
Companies are implementing various strategies, such as strategic alliances, two-wheeler electronic control unit (ECU) market forecast, partnerships, mergers and acquisitions, geographical expansion, and product/service launches, to enhance their presence in the industry.
Bajaj Auto Ltd. - The company specializes in advanced electronic control units (ECUs) for two-wheeler vehicles, including engine management systems.
The industry research and growth report includes detailed analyses of the competitive landscape of the market and information about key companies, including:
- Bajaj Auto Ltd.
- BorgWarner Inc.
- Continental AG
- DENSO Corp.
- dSPACE GmbH
- Honda Motor Co. Ltd.
- Infineon Technologies AG
- Kawasaki Heavy Industries Ltd.
- Marelli Holdings Co. Ltd.
- Mikuni Corp.
- Mitsubishi Electric Corp.
- Nikki Co. Ltd.
- NXP Semiconductors NV
- Robert Bosch GmbH
- S and S Cycle Inc.
- SEDEMAC Mechatronics Pvt. Ltd.
- Shindengen Electric Manufacturing Co. Ltd.
- Suzuki Motor Corp.
- Volkswagen AG
- ZF Friedrichshafen AG
Qualitative and quantitative analysis of companies has been conducted to help clients understand the wider business environment as well as the strengths and weaknesses of key industry players. Data is qualitatively analyzed to categorize companies as pure play, category-focused, industry-focused, and diversified; it is quantitatively analyzed to categorize companies as dominant, leading, strong, tentative, and weak.
Recent Development and News in Two-Wheeler Electronic Control Unit (ECU) Market
- In February 2023, Bosch, a leading global technology company, announced the launch of its new Motorcycle Stability Control (MSC) system, featuring an advanced Two-Wheeler Electronic Control Unit (ECU) for enhanced safety and riding experience (Bosch press release, 2023). This innovative system integrates various functions such as anti-lock braking, traction control, and electronic stability control, aiming to reduce accidents and improve rider confidence.
- In July 2024, Continental AG, a German automotive technology company, entered into a strategic partnership with Honda Motor Co. Ltd. to develop and supply ECUs for Honda's two-wheeler lineup (Continental AG press release, 2024). This collaboration is expected to strengthen Continental's presence in the two-wheeler ECU market and provide Honda with advanced technology solutions.
- In November 2024, Magneti Marelli, an Italian automotive components supplier, secured a significant investment of USD 170 million from KKR, a leading global investment firm, to expand its powertrain and electronic control systems business, including its two-wheeler ECU segment (Magneti Marelli press release, 2024). This investment will enable Magneti Marelli to accelerate its growth and innovation in the two-wheeler ECU market.
- In March 2025, the European Union announced new regulations mandating the installation of advanced safety systems, including ECUs, in all new two-wheeler models sold within the EU from 2027 onwards (European Commission press release, 2025). This regulatory initiative aims to improve road safety for two-wheeler riders and reduce accidents.
Research Analyst Overview
The market continues to evolve, with critical components such as antitheft alarms, advanced diagnostics, sensor inputs, ignition timing, induction motor, and optimizing engine functions becoming increasingly integrated into motorcycles. New technologies, including electric motorcycles and electric vehicles, are driving innovation in the electronic control sector. The powertrain ECU plays a crucial role in motorcycle manufacturing, managing engine functions, monitoring fuel consumption, and ensuring compatibility with various sensors and systems. DC conversion, data logging, fueling, motor control, and battery management are essential features of these advanced ECUs. Major motorcycle OEMs are investing in research and development to meet stricter emission standards and enhance vehicle performance.
The CAN network and body control unit enable seamless communication between various vehicle systems, while engine immobilizers and telematics offer advanced security and customer base engagement. The ongoing unfolding of market activities reveals a focus on efficiency, diagnostics, electronics, and supply chain optimization. Innovations in fuel injection, throttle position, idle speed, and battery management systems are shaping the future of the two-wheeler ECU market. In the realm of electric motorcycles and electric cars, AC motor control, battery system management, and performance optimization are critical areas of development. Android infotainment systems and advanced features, such as lamp load controlling and emission standards monitoring, are also gaining traction in the market. As automotive engineers continue to push the boundaries of vehicle technology, the two-wheeler ECU market will remain a dynamic and evolving landscape.
Dive into Technavio's strong research methodology, blending expert interviews, extensive data synthesis, and validated models for unparalleled Two-Wheeler Electronic Control Unit (ECU) Market insights. See full methodology.
|
Market Scope |
|
|
Report Coverage |
Details |
|
Page number |
230 |
|
Base year |
2024 |
|
Historic period |
2019-2023 |
|
Forecast period |
2025-2029 |
|
Growth momentum & CAGR |
Accelerate at a CAGR of 4.4% |
|
Market growth 2025-2029 |
USD 17.9 billion |
|
Market structure |
Fragmented |
|
YoY growth 2024-2025(%) |
4.2 |
|
Key countries |
US, China, Brazil, India, Indonesia, Argentina, Vietnam, Canada, Germany, and Thailand |
|
Competitive landscape |
Leading Companies, Market Positioning of Companies, Competitive Strategies, and Industry Risks |
What are the Key Data Covered in this Two-Wheeler Electronic Control Unit (ECU) Market Research and Growth Report?
- CAGR of the Two-Wheeler Electronic Control Unit (ECU) industry during the forecast period
- Detailed information on factors that will drive the growth and forecasting between 2025 and 2029
- Precise estimation of the size of the market and its contribution of the industry in focus to the parent market
- Accurate predictions about upcoming growth and trends and changes in consumer behaviour
- Growth of the market across APAC, South America, North America, Europe, and Middle East and Africa
- Thorough analysis of the market's competitive landscape and detailed information about companies
- Comprehensive analysis of factors that will challenge the two-wheeler electronic control unit (ECU) market growth of industry companies
We can help! Our analysts can customize this two-wheeler electronic control unit (ECU) market research report to meet your requirements.
 RIA -
RIA - 
