
UK Online Home Rental Services Market Size 2025-2029
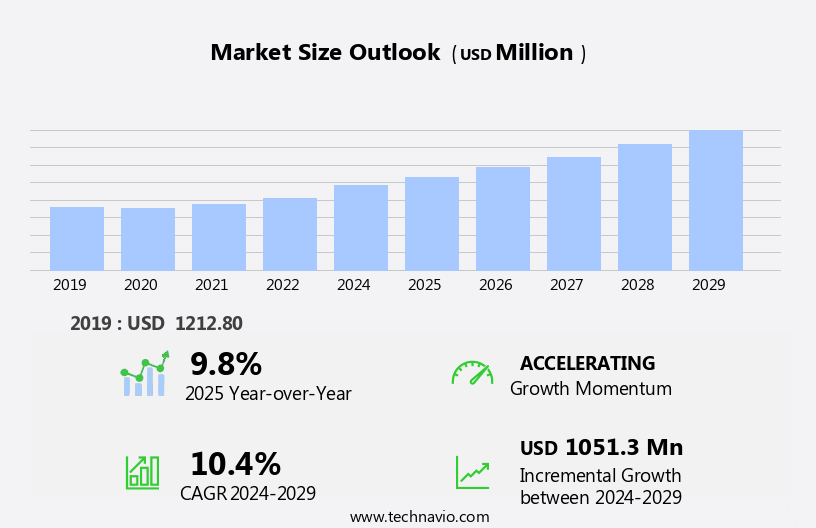
The UK online home rental services market size is forecast to increase by USD 1.05 billion at a CAGR of 10.4% between 2024 and 2029.
- The Online Home Rental Services Market is witnessing significant growth, driven by the ascendancy of hybrid and flexible rental models. These models offer increased convenience and flexibility to renters, allowing them to choose from a wide range of properties and lease durations. However, ensuring trust and security in online transactions remains a critical challenge. With the increasing prevalence of cyber threats and data breaches, renters demand robust security measures to protect their personal and financial information. Regulatory hurdles also impact adoption, as governments worldwide introduce new regulations to govern the online rental market. These regulations aim to protect consumers and ensure fair business practices, but they can add complexity and increase operational costs for rental service providers. Growth in demand for tiny home structures is the primary trend in the online home rental services market.
- To capitalize on market opportunities and navigate challenges effectively, companies must prioritize security and regulatory compliance while continuing to innovate and offer competitive pricing and flexible rental options. By addressing these challenges head-on, online home rental services can continue to disrupt traditional rental markets and meet the evolving needs of modern renters. The integration of Internet of Things (IoT) technology with building automation software is a key trend driving market expansion.
What will be the size of the UK Online Home Rental Services Market during the forecast period?
- In the dynamic online home rental services market, outdoor activities and travel itineraries continue to be popular trends among travelers. To cater to this demand, transportation services integration and travel safety features are increasingly prioritized by property management software. Travel trends indicate a shift towards environmental sustainability and community engagement, making property portfolio management an essential investment opportunity. Destination marketing, travel recommendations, and customer loyalty programs are key strategies for attracting renters. Smart home technology, including keyless entry, voice assistants, and home automation, enhances the rental experience.
- Rental yield analysis, pricing algorithms, and dynamic pricing help property owners maximize income. Travelers seek local attractions, shopping and entertainment, food and beverage options, and cultural experiences when choosing a rental property. Travel insurance, ethical travel practices, and guest feedback analysis are crucial components of responsible travel. Property value assessment and rental income tracking are essential for effective property management.
How is this market segmented?
The market research report provides comprehensive data (region-wise segment analysis), with forecasts and estimates in "USD million" for the period 2025-2029, as well as historical data from 2019-2023 for the following segments.
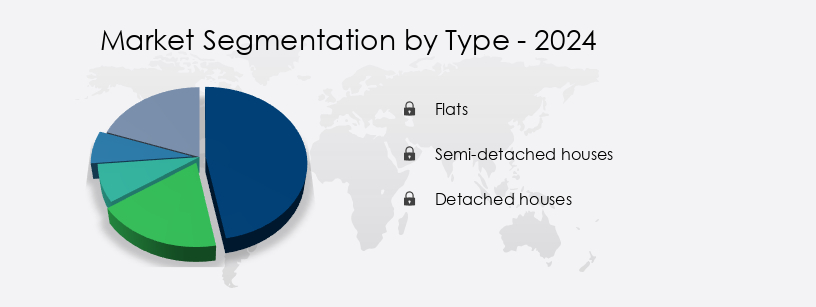
- Type
- Flats
- Semi-detached houses
- Detached houses
- Service
- Economy
- Mid-range
- Premium
- Rental Category
- Monthly
- Weekly
- Daily
- Yearly
- End-user
- Resident
- Tourist
- Geography
- Europe
- UK
- Europe
By Type Insights
The flats segment is estimated to witness significant growth during the forecast period. The online home rental services market in the US is characterized by its technological advancements and diverse offerings. Payment processing systems ensure secure transactions, while guest safety and insurance provide peace of mind for property owners. Business travelers and families seek user-friendly platforms for booking short-term and holiday rentals, with automated processes simplifying the rental agreement and calendar synchronization. Digital marketing strategies, including search engine optimization and social media marketing, expand market reach. Seasonal rentals cater to varying demand, and property amenities enhance the user experience. Property management systems offer data analytics and pricing optimization for rental income and property taxes. Renewable energy solutions and building information modeling are essential trends in the market, as businesses and organizations strive for sustainability and cost savings.
Get a glance at the market share of various segments Request Free Sample
The Flats segment was valued at USD 648.10 million in 2019 and showed a gradual increase during the forecast period. Artificial Intelligence (AI) and energy management systems work in tandem to optimize energy usage in smart buildings, reducing operational costs and enhancing overall sustainability. Artificial intelligence and machine learning facilitate predictive analytics and rental regulations compliance. Virtual tours and property photos showcase listings, and guest verification and fraud detection ensure trust. Customer support and communication tools foster positive guest reviews and relationships. Mobile apps and responsive design cater to on-the-go booking, while security features protect both property and guest information. Long-term and luxury rentals cater to different demographics, with property managers and host services offering additional support. Rental guarantee and property insurance safeguard property owners, and local laws and location features add convenience. Overall, the online home rental services market in the US continues to evolve, prioritizing user experience, security, and accessibility. This segment incorporates advanced technologies, including access control systems, video surveillance, and fire and life safety systems, which collaborate to establish a robust security infrastructure.
Market Dynamics
Our researchers analyzed the data with 2024 as the base year, along with the key drivers, trends, and challenges. A holistic analysis of drivers will help companies refine their marketing strategies to gain a competitive advantage.
What are the key market drivers leading to the rise in the adoption of Online Home Rental Services in UK Industry?
- The rise of hybrid and flexible rental models is the primary force shaping the market's current dynamics. These innovative rental solutions are gaining significant traction among consumers, offering greater flexibility and convenience. By providing more choices and customizable options, these models are transforming the rental industry landscape. The online home rental services market is experiencing significant evolution in the UK, driven by shifting tenant preferences and proactive service providers. A notable trend in this transformation is the emergence and advancement of hybrid and flexible rental models. These models bridge the gap between short-term vacation rentals and long-term leases, catering to an expanding demographic seeking accommodation for durations longer than typical holiday stays but shorter than traditional long-term commitments. This demand is fueled by factors such as the rise of remote work, project-based employment, relocation for assignments, and interim housing during life transitions like home renovations or permanent relocation.
- To address the unique needs of this market, service providers are integrating advanced features such as fraud detection, property photos, virtual tours, listing management, data analytics, payment security, guest reviews, security features, and host insurance. Additionally, guest verification processes and group travel accommodations are becoming increasingly important. These innovations enhance the user experience, foster trust, and ensure a secure and seamless rental process for both property owners and renters. Overall, the online home rental services market is poised for continued growth and innovation, driven by the evolving needs and preferences of its customer base.
What are the market trends shaping the Online Home Rental Services in UK Industry?
- Maintaining trust and ensuring secure online transactions is a critical market trend. Professionals in the digital sphere prioritize this priority to foster confidence in e-commerce platforms. The online home rental services market in the US is experiencing significant growth due to several key factors. With the increasing availability of high-speed internet and the rise of a tech-savvy population, more individuals are turning to digital platforms for their rental needs. This shift is driven by the convenience and efficiency offered by online platforms, which enable users to easily browse property listings, communicate with property managers, and complete transactions from the comfort of their homes. Artificial intelligence is also playing a role in the market's expansion, with advanced search algorithms and virtual assistants streamlining the rental process.
- Data privacy remains a priority, with responsive design and robust security measures ensuring that user information is protected. Social media marketing and customer relationship management are essential tools for property managers seeking to attract and retain renters. Pricing optimization is another critical factor, with rental income and property taxes influencing the competitive landscape. Vacation rentals, in particular, have seen strong growth, with mobile apps and search engine optimization enabling property managers to reach a wider audience. Overall, the online home rental services market is poised for continued expansion, with innovation and technology playing a key role in shaping the future of the industry.
What challenges does the Online Home Rental Services in UK Industry face during its growth?
- Ensuring trust and security in online transactions is a critical issue that significantly impacts the growth of the industry. With the increasing reliance on digital platforms for commerce, safeguarding sensitive information and maintaining customer confidence is essential. This challenge necessitates continuous innovation and implementation of advanced security measures, as well as strict adherence to regulatory compliance. Failure to address these concerns effectively can result in reputational damage and lost business opportunities. The online home rental services market has experienced significant growth in the UK, providing landlords and tenants with increased convenience. However, ensuring trust and security throughout the rental process is a persistent challenge. Critical aspects include identity verification, secure financial transactions, and fraud prevention. While digital platforms offer efficiency, they also introduce risks that traditional methods mitigate. For instance, verifying the authenticity of property listings and prospective tenants can be complex online. Property safety is another crucial concern. Host services, such as property management and rental guarantee, help mitigate risks for landlords. Mobile optimization and online advertising expand reach and accessibility.
- Rental regulations vary by local laws, necessitating compliance. Predictive analytics and machine learning technologies can streamline processes and improve guest communication. Property insurance is essential for risk management. Property managers play a vital role in ensuring compliance with regulations and maintaining property safety. Long-term rentals require additional considerations, such as tenant retention strategies and lease agreement terms. By addressing these challenges, online home rental services can provide a seamless, secure, and efficient experience for all parties involved.
Exclusive Customer Landscape
The online home rental services market in UK forecasting report includes the adoption lifecycle of the market, covering from the innovator's stage to the laggard's stage. It focuses on adoption rates in different regions based on penetration. Furthermore, the online home rental services market in UK report also includes key purchase criteria and drivers of price sensitivity to help companies evaluate and develop their market growth analysis strategies.
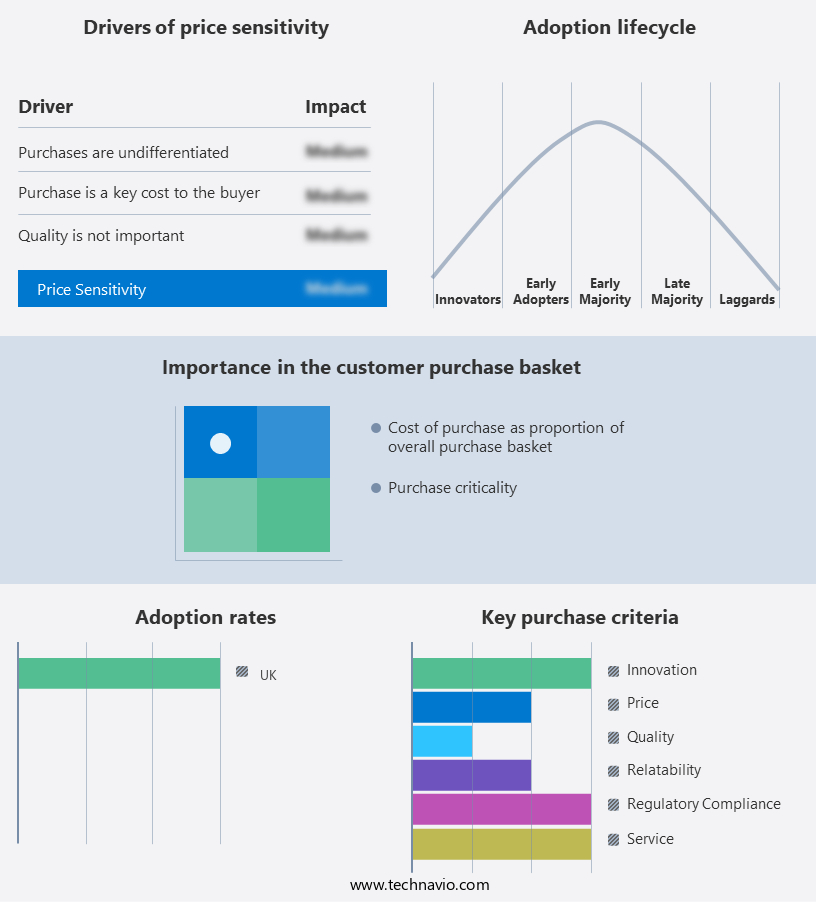
Customer Landscape
Key Companies & Market Insights
Companies are implementing various strategies, such as strategic alliances, online home rental services market in UK forecast, partnerships, mergers and acquisitions, geographical expansion, and product/service launches, to enhance their presence in the industry.
9flats.com PTE Ltd. - This company provides an online platform for home rentals, including apartments, houses, and unique stays, connecting travelers with hosts worldwide.
The industry research and growth report includes detailed analyses of the competitive landscape of the market and information about key companies, including:
- 9flats.com PTE Ltd.
- Airbnb Inc.
- Avail
- BoutiqueHomes
- CoStar Group
- Elite Destination Homes
- Expedia Group Inc.
- HomeToGo GmbH
- Lodgis
- LVH Global Inc.
- MakeMyTrip Ltd.
- NestAway Technologies Pvt Ltd.
- Oravel Stays Ltd.
- Rentberry Inc.
- Rentalo.com Inc.
- Upad Ltd.
- Wyndham Destinations Inc.
- Zillow Group Inc.
- Zumper Inc.
Qualitative and quantitative analysis of companies has been conducted to help clients understand the wider business environment as well as the strengths and weaknesses of key industry players. Data is qualitatively analyzed to categorize companies as pure play, category-focused, industry-focused, and diversified; it is quantitatively analyzed to categorize companies as dominant, leading, strong, tentative, and weak.
Recent Development and News in Online Home Rental Services Market In UK
- In February 2024, Airbnb, a leading player in the online home rental services market, announced the launch of its new service, Airbnb Plus, which offers guests a more consistent and high-quality stay experience, with properties undergoing an in-person inspection and verification process (Airbnb Press Release, 2024). This development signified a significant shift towards enhancing customer experience and differentiating offerings in a competitive market.
- In May 2025, Expedia Group's Vrbo platform entered into a strategic partnership with Marriott International, allowing Marriott's loyalty program members to earn and redeem points when booking properties on Vrbo (Expedia Group Press Release, 2025). This collaboration aimed to attract more customers and increase market share by leveraging the extensive reach and loyalty base of both companies.
- In October 2024, Zillow, a prominent real estate and rental marketplace, acquired ShowingTime, a leading scheduling and showing management platform, for approximately USD500 million (Zillow Press Release, 2024). This acquisition enabled Zillow to streamline the rental process for property managers and agents, offering a more efficient and integrated solution for the online home rental services market.
Research Analyst Overview
The online home rental services market continues to evolve, with dynamic market activities unfolding across various sectors. Property safety remains a top priority, with hosts offering guest insurance and implementing security features. Business travelers seek user-friendly booking platforms and seamless calendar synchronization. Digital marketing strategies, including search engine optimization and social media marketing, are essential for property owners to attract renters. Seasonal rentals and holiday lettings experience increased demand, necessitating automated processes for rental agreement generation and payment processing. Customer support and fraud detection are crucial for maintaining trust and ensuring a positive user experience. Property photos and virtual tours are increasingly important for showcasing property amenities and facilitating informed decision-making. The integration of Internet of Things (IoT) technology with building automation software is a key trend driving market expansion.
Predictive analytics and machine learning enable price optimization and effective property management. Rental regulations vary by location, necessitating adherence to local laws and regulations. Long-term rentals and luxury properties require specialized services, such as rental guarantee and property insurance. Renewable energy solutions and building information modeling are essential trends in the market, as businesses and organizations strive for sustainability and cost savings. Host services, guest communication, and property management solutions are integral to the success of online rental platforms. The market's continuous evolution encompasses ongoing advancements in payment security, guest reviews, and mobile optimization. Property taxes and pricing optimization are essential considerations for rental income generation. The integration of artificial intelligence and data privacy enhances the user experience and streamlines operations. Overall, the online home rental services market remains a vibrant and ever-changing landscape.
Dive into Technavio's robust research methodology, blending expert interviews, extensive data synthesis, and validated models for unparalleled Online Home Rental Services Market in UK insights. See full methodology.
|
Market Scope |
|
|
Report Coverage |
Details |
|
Page number |
192 |
|
Base year |
2024 |
|
Historic period |
2019-2023 |
|
Forecast period |
2025-2029 |
|
Growth momentum & CAGR |
Accelerate at a CAGR of 10.4% |
|
Market growth 2025-2029 |
USD 1.05 billion |
|
Market structure |
Fragmented |
|
YoY growth 2024-2025(%) |
9.8 |
|
Key countries |
UK |
|
Competitive landscape |
Leading Companies, Market Positioning of Companies, Competitive Strategies, and Industry Risks |
What are the Key Data Covered in this Online Home Rental Services Market in UK Research and Growth Report?
- CAGR of the Online Home Rental Services in UK industry during the forecast period
- Detailed information on factors that will drive the growth and forecasting between 2025 and 2029
- Precise estimation of the size of the market and its contribution of the industry in focus to the parent market
- Accurate predictions about upcoming growth and trends and changes in consumer behaviour
- Growth of the market across UK
- Thorough analysis of the market's competitive landscape and detailed information about companies
- Comprehensive analysis of factors that will challenge the online home rental services market in UK growth of industry companies
We can help! Our analysts can customize this online home rental services market in UK research report to meet your requirements.
 RIA -
RIA - 
