India Unified Payments Interface (UPI) Market Size 2026-2030
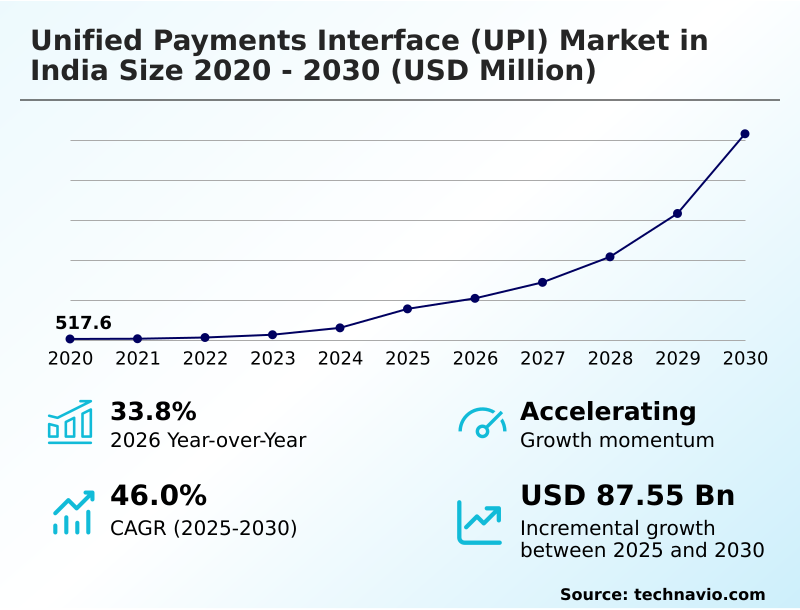
The india unified payments interface (upi) market size is valued to increase by USD 87.55 billion, at a CAGR of 46% from 2025 to 2030. Governmental push for digitization will drive the india unified payments interface (upi) market.
Major Market Trends & Insights
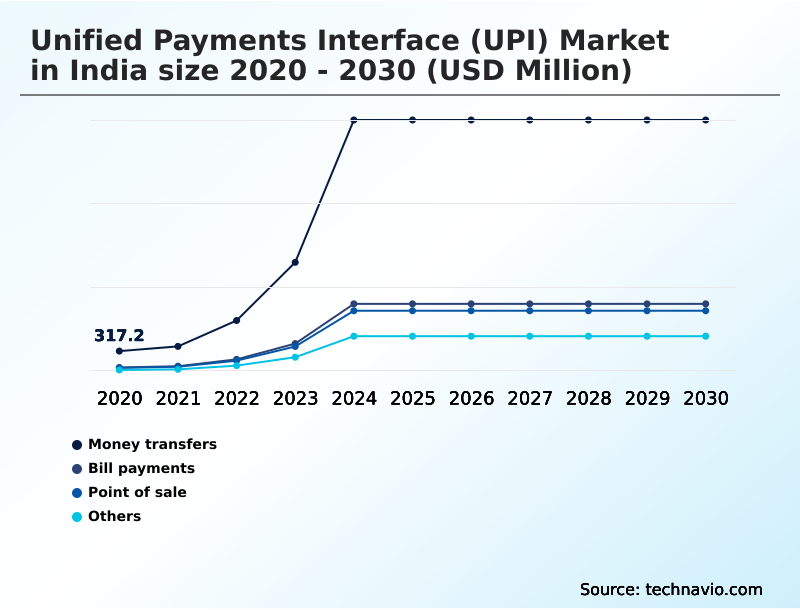
- By Application - Money transfers segment was valued at USD 3.65 billion in 2024
- By Type - P2P segment accounted for the largest market revenue share in 2024
Market Size & Forecast
- Market Opportunities: USD 102.60 billion
- Market Future Opportunities: USD 87.55 billion
- CAGR from 2025 to 2030 : 46%
Market Summary
- The unified payments interface (upi) market in india continues its robust expansion, evolving from a simple payment mechanism into a comprehensive digital financial infrastructure. This growth is propelled by a confluence of factors, including supportive government policies promoting digitization and the platform's inherent technological agility.
- Key trends such as the integration of credit facilities and cross-border payment capabilities are broadening its utility far beyond initial use cases. However, this rapid scaling introduces challenges related to infrastructure stability, cybersecurity, and ensuring equitable access across all demographic segments.
- For instance, businesses leveraging the platform for supply chain payments must navigate these operational risks while capitalizing on the efficiencies of instant settlement. The market's trajectory is defined by a continuous balancing act between fostering innovation, managing systemic risks, and driving deeper financial inclusion.
- This dynamic environment presents both significant opportunities for value creation and complex challenges for participants navigating the ecosystem of the unified payments interface (upi) market in india.
What will be the Size of the India Unified Payments Interface (UPI) Market during the forecast period?
Get Key Insights on Market Forecast (PDF) Get Free Sample
How is the India Unified Payments Interface (UPI) Market Segmented?
The india unified payments interface (upi) industry research report provides comprehensive data (region-wise segment analysis), with forecasts and estimates in "USD million" for the period 2026-2030, as well as historical data from 2020-2024 for the following segments.
- Application
- Money transfers
- Bill payments
- Point of sale
- Others
- Type
- P2P
- P2M
- Technology
- UPI version 1
- UPI version 2
- UPI lite
- UPI for feature phones
- Cross-border UPI
- Geography
- APAC
- India
- APAC
By Application Insights
The money transfers segment is estimated to witness significant growth during the forecast period.
The money transfers segment, initially driven by peer-to-peer convenience, is now characterized by the rapid scaling of person-to-merchant transactions. This real-time payment system, built on an open-loop ecosystem, facilitates frictionless inter-bank transactions and has created powerful network effects.
The deep integration of application programming interface sets has enabled a suite of value-added services beyond simple person-to-person transfers.
This evolution is evident in the system's growing use for low-value transactions, where the average ticket size for transfers declined by nearly 9% as the platform became embedded in daily micro-commerce.
This shift underscores the segment's maturation from a simple transfer utility to a foundational layer for broader digital commerce, driving the expansion of the unified payments interface (upi) market in india 2026-2030.
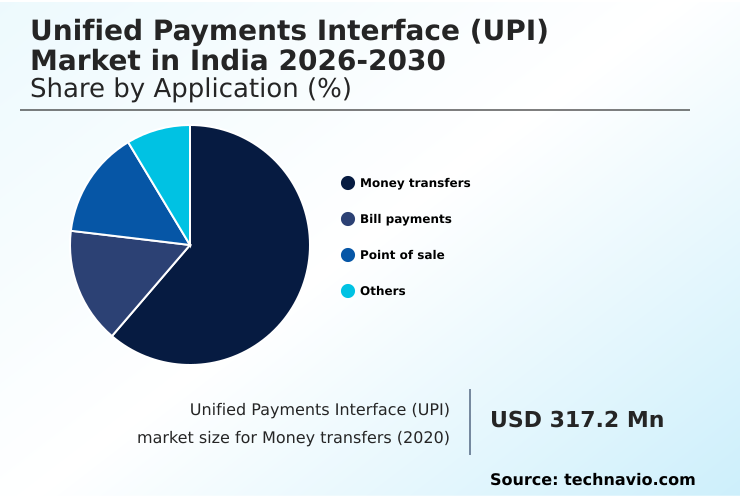
The Money transfers segment was valued at USD 3.65 billion in 2024 and showed a gradual increase during the forecast period.
Market Dynamics
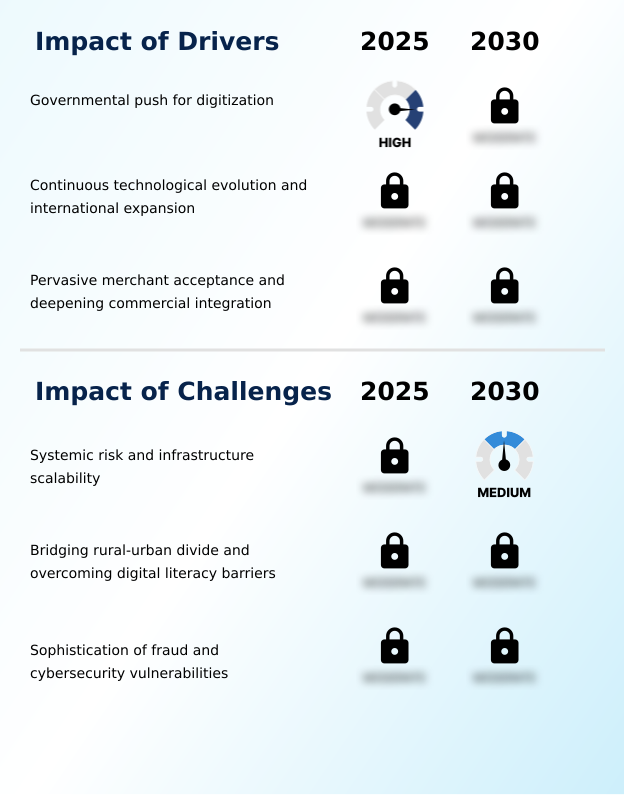
Our researchers analyzed the data with 2025 as the base year, along with the key drivers, trends, and challenges. A holistic analysis of drivers will help companies refine their marketing strategies to gain a competitive advantage.
- The strategic evolution of the unified payments interface (upi) market in india is deeply tied to addressing specific, high-value use cases and overcoming structural challenges. The push for upi for feature phones adoption is a critical initiative aimed at bridging the digital divide, though it faces hurdles related to user education and building trust in non-visual interfaces.
- Concurrently, the credit lines on upi integration represents a paradigm shift, embedding lending directly into the payment flow and challenging traditional credit models. A major focus is on reducing cross-border upi transaction costs, which involves complex interoperability with global payment systems to create seamless remittance corridors.
- For domestic commerce, upi lite for micro-transactions has been pivotal in driving cash displacement, with some merchant categories seeing a near 40% reduction in cash handling. Furthermore, qr code based merchant payments have become ubiquitous, forming the backbone of retail digital acceptance. The growing sophistication is also seen in upi mandates for recurring payments, which streamline subscriptions and regular bills.
- To maintain ecosystem integrity, real time fraud detection in upi is paramount, alongside managing systemic risk in payment networks. Looking ahead, successful upi integration in capital markets and ensuring regulatory compliance for upi tPAPs will define the next phase of growth and maturation.
What are the key market drivers leading to the rise in the adoption of India Unified Payments Interface (UPI) Industry?
- The unwavering support from the government and a forward-thinking regulatory environment are the most influential drivers creating a fertile ground for digital payments to flourish.
- The market's expansion is fundamentally driven by the pervasive adoption of its interoperable payment network, which is built upon a simple virtual payment address system.
- The proliferation of dynamic qr codes and sound-based payment devices has accelerated grassroots-level onboarding, extending digital financial inclusion to millions of small merchants.
- This asset-light infrastructure has led to instantaneous fund settlement, reducing operational overhead and improving cash flow management, which is a significant improvement over traditional cash-on-delivery collections.
- This deep integration is creating new revenue opportunities, such as enabling capital market investments with a simplified transaction flow.
- The platform's ability to digitize workflows is a core value proposition, demonstrated by a 40% reduction in payment processing times for certain enterprise use cases, cementing its role as an indispensable commercial utility in the unified payments interface (upi) market in india 2026-2030.
What are the market trends shaping the India Unified Payments Interface (UPI) Industry?
- A significant trend reshaping the market is the accelerating convergence of real-time payment rails with credit functionalities. This is transforming the platform into a versatile channel for delivering and managing credit at the point of transaction.
- Key trends are reshaping the unified payments interface (upi) market in india, primarily through the convergence of payments and credit. This is enabled by the one-time mandate and recurring mandate feature, which facilitate subscription-based services and automated debits, with some providers seeing a 25% increase in user retention after adoption.
- The emergence of credit-on-demand, leveraging real-time transaction data for dynamic credit underwriting models, is challenging traditional lending. This transforms payment service providers into broader financial platforms. The expansion of the merchant acceptance network, driven by asset-light infrastructure and a zero merchant discount rate policy, continues unabated.
- The market is evolving into a comprehensive commercial platform, moving far beyond its initial scope and fostering intense competition to offer the most compelling credit and value-added services through the unified payments interface (upi) market in india 2026-2030.
What challenges does the India Unified Payments Interface (UPI) Industry face during its growth?
- The immense and growing strain on the underlying financial and technological infrastructure introduces significant systemic risk, which is a primary challenge for the market.
- The unified payments interface (upi) market in india confronts significant challenges, most notably the systemic risk associated with immense transaction volumes straining the infrastructure scalability of legacy core banking system integration points. This can lead to a higher transaction failure rate, eroding user trust.
- Compounding this is the threat from sophisticated social engineering tactics and other cybersecurity vulnerabilities, which necessitate advanced fraud detection systems. While cross-border remittances present a growth opportunity, they also increase complexity. A small number of third-party application provider firms controlling a large market share adds to concentration risk.
- Successfully navigating these hurdles requires continuous investment in technology and user education, potentially through an assisted or agent-led model in less digitally-savvy regions, to maintain the integrity of the unified payments interface (upi) market in india 2026-2030.
Exclusive Technavio Analysis on Customer Landscape
The india unified payments interface (upi) market forecasting report includes the adoption lifecycle of the market, covering from the innovator’s stage to the laggard’s stage. It focuses on adoption rates in different regions based on penetration. Furthermore, the india unified payments interface (upi) market report also includes key purchase criteria and drivers of price sensitivity to help companies evaluate and develop their market growth analysis strategies.
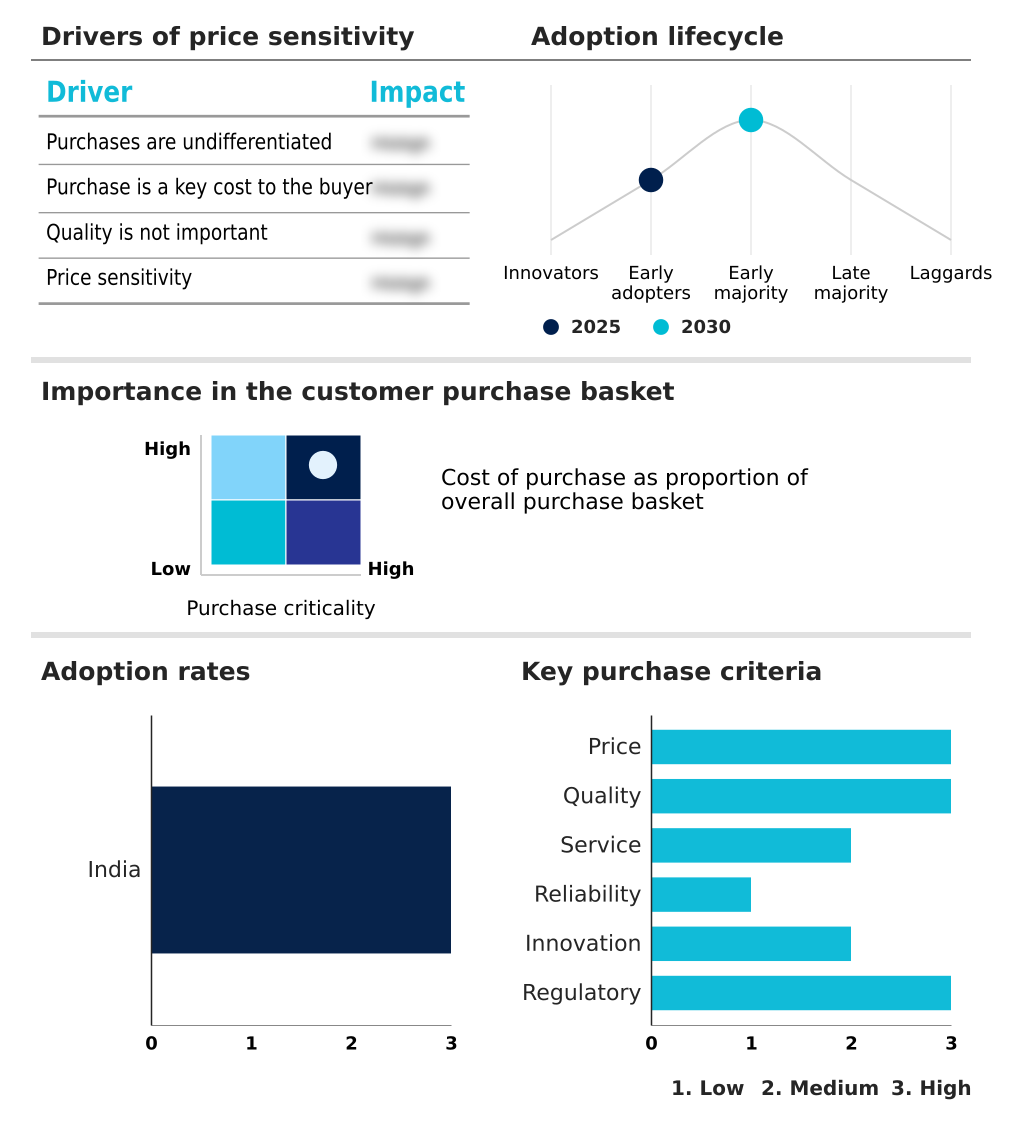
Customer Landscape of India Unified Payments Interface (UPI) Industry
Competitive Landscape
Companies are implementing various strategies, such as strategic alliances, india unified payments interface (upi) market forecast, partnerships, mergers and acquisitions, geographical expansion, and product/service launches, to enhance their presence in the industry.
Amazon.com Inc. - Offerings include a comprehensive digital ecosystem for payments, financial services, and merchant platforms, simplifying money flow and fostering digital inclusion through a unified interface.
The industry research and growth report includes detailed analyses of the competitive landscape of the market and information about key companies, including:
- Amazon.com Inc.
- Amica Financial Technologies
- Axis Bank Ltd.
- Dreamplug Technologies
- Google LLC
- HDFC Bank Ltd.
- ICICI Bank Ltd.
- Infibeam Avenues Ltd.
- Meta Platforms Inc.
- One MobiKwik System Pvt. Ltd.
- One97 Communications Ltd.
- Pay U
- PhonePe Pvt. Ltd.
- Razorpay Software Pvt. Ltd.
- State Bank of India
- Yes Bank Ltd.
Qualitative and quantitative analysis of companies has been conducted to help clients understand the wider business environment as well as the strengths and weaknesses of key industry players. Data is qualitatively analyzed to categorize companies as pure play, category-focused, industry-focused, and diversified; it is quantitatively analyzed to categorize companies as dominant, leading, strong, tentative, and weak.
Recent Development and News in India unified payments interface (upi) market
- In September 2024, NPCI International Payments Limited partnered with Nepal's Fonepay Payment Service to facilitate cross-border QR code-based UPI transactions for Indian consumers in Nepal.
- In November 2024, the Reserve Bank of India proposed a new framework to facilitate cash deposits at Cash Deposit Machines (CDMs) using UPI, aiming to enhance customer convenience and reduce cash-handling loads at bank branches.
- In January 2025, the National Payments Corporation of India implemented a mandate requiring all scheduled autopay and recurring UPI payments to be processed exclusively during designated non-peak hours to improve system stability.
- In April 2025, the Securities and Exchange Board of India moved to mandate a standardized and validated UPI payment mechanism for all registered intermediaries to enhance investor security and prevent fraud.
Dive into Technavio’s robust research methodology, blending expert interviews, extensive data synthesis, and validated models for unparalleled India Unified Payments Interface (UPI) Market insights. See full methodology.
| Market Scope | |
|---|---|
| Page number | 199 |
| Base year | 2025 |
| Historic period | 2020-2024 |
| Forecast period | 2026-2030 |
| Growth momentum & CAGR | Accelerate at a CAGR of 46% |
| Market growth 2026-2030 | USD 87546.5 million |
| Market structure | Fragmented |
| YoY growth 2025-2026(%) | 33.8% |
| Key countries | India |
| Competitive landscape | Leading Companies, Market Positioning of Companies, Competitive Strategies, and Industry Risks |
Research Analyst Overview
- The unified payments interface (upi) market in india is rapidly maturing into a multi-faceted digital public infrastructure, moving beyond simple inter-bank transactions. Its foundation on an interoperable payment network allows diverse payment service providers to innovate, driving features like the one-time mandate and recurring mandate feature which are crucial for the subscription economy.
- The core architecture, combining a virtual payment address with a push-and-pull payment mechanism, underpins the entire ecosystem. Technologically, the platform is expanding through specialized applications such as sound-based payment devices and dynamic qr codes for merchants, which enhance the efficiency of person-to-merchant transactions.
- For instance, the use of an on-device wallet for low-value transactions has measurably reduced transaction processing loads on core banking system integration points by over 25%. A key strategic pivot is the introduction of credit-on-demand, which integrates real-time transaction data into lending decisions, forcing a re-evaluation of product strategy at the boardroom level.
- However, this expansion brings challenges, including mitigating systemic risk and combating sophisticated social engineering tactics, which require constant vigilance from every third-party application provider.
What are the Key Data Covered in this India Unified Payments Interface (UPI) Market Research and Growth Report?
-
What is the expected growth of the India Unified Payments Interface (UPI) Market between 2026 and 2030?
-
USD 87.55 billion, at a CAGR of 46%
-
-
What segmentation does the market report cover?
-
The report is segmented by Application (Money transfers, Bill payments, Point of sale, and Others), Type (P2P, and P2M), Technology (UPI version 1, UPI version 2, UPI lite, UPI for feature phones, and Cross-border UPI) and Geography (APAC)
-
-
Which regions are analyzed in the report?
-
APAC
-
-
What are the key growth drivers and market challenges?
-
Governmental push for digitization, Systemic risk and infrastructure scalability
-
-
Who are the major players in the India Unified Payments Interface (UPI) Market?
-
Amazon.com Inc., Amica Financial Technologies, Axis Bank Ltd., Dreamplug Technologies, Google LLC, HDFC Bank Ltd., ICICI Bank Ltd., Infibeam Avenues Ltd., Meta Platforms Inc., One MobiKwik System Pvt. Ltd., One97 Communications Ltd., Pay U, PhonePe Pvt. Ltd., Razorpay Software Pvt. Ltd., State Bank of India and Yes Bank Ltd.
-
Market Research Insights
- The market's momentum is sustained by a potent combination of network effects and an expanding merchant acceptance network, which has been achieved through grassroots-level onboarding initiatives. This has fostered an environment where value-added services are becoming key differentiators.
- For example, payment providers utilizing a sophisticated credit underwriting model based on transaction data report a 15% lower default rate compared to traditional assessment methods. Furthermore, the focus on reducing operational overhead for businesses is evident, with some platforms demonstrating a 20% improvement in reconciliation times.
- While the zero merchant discount rate policy has accelerated adoption, the ecosystem's long-term commercial viability hinges on the successful rollout of these advanced services, including credit and capital market investments, which are critical for future monetization and sustained growth in the unified payments interface (upi) market in india 2026-2030.
We can help! Our analysts can customize this india unified payments interface (upi) market research report to meet your requirements.
 RIA -
RIA - 
