Unmanned Combat Aerial Vehicle (UCAV) Market Analysis, Size, and Forecast 2026-2030: North America (US, Canada, and Mexico), Europe (Germany, UK, and France), APAC (China, Japan, and India), Middle East and Africa (Saudi Arabia, UAE, and South Africa), South America (Brazil, Argentina, and Chile), and Rest of World (ROW)

Unmanned Combat Aerial Vehicle (UCAV) Market Analysis, Size, and Forecast 2026-2030:
North America (US, Canada, and Mexico), Europe (Germany, UK, and France), APAC (China, Japan, and India), Middle East and Africa (Saudi Arabia, UAE, and South Africa), South America (Brazil, Argentina, and Chile), and Rest of World (ROW)

Published: Oct 2026 289 Pages SKU: IRTNTR70464

Market Overview at a Glance

$1.74 B
Market Opportunity
8.6%
CAGR 2025 - 2030
36.5%
North America Growth
$2.02 B
Medium-altitutde UCAV segment 2024

Unmanned Combat Aerial Vehicle (Ucav) Market Size 2026-2030

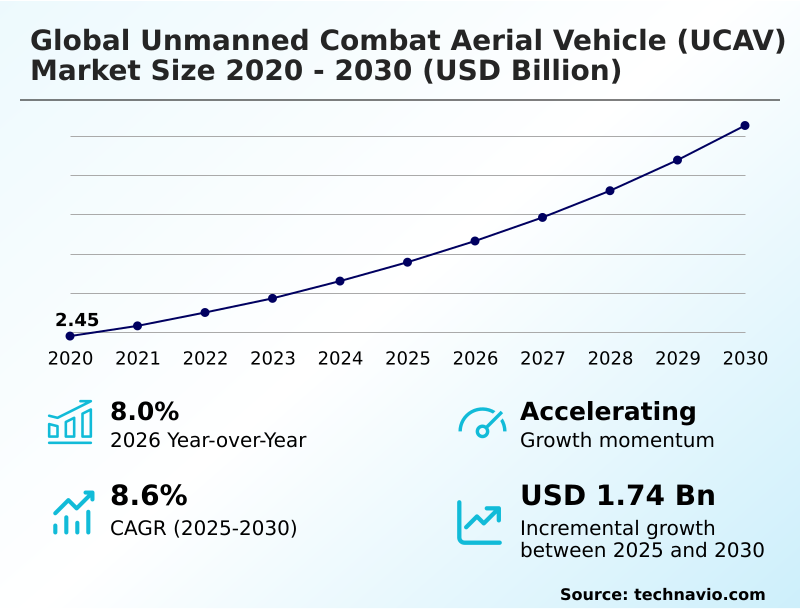
The unmanned combat aerial vehicle (ucav) market size is valued to increase by USD 1.74 billion, at a CAGR of 8.6% from 2025 to 2030. Geopolitical tensions and defense budgets will drive the unmanned combat aerial vehicle (ucav) market.

Major Market Trends & Insights

  • North America dominated the market and accounted for a 36.5% growth during the forecast period.
  • By Type - Medium-altitutde UCAV segment was valued at USD 2.02 billion in 2024
  • By Platform - Defense and government segment accounted for the largest market revenue share in 2024

Market Size & Forecast

  • Market Opportunities: USD 2.68 billion
  • Market Future Opportunities: USD 1.74 billion
  • CAGR from 2025 to 2030 : 8.6%

Market Summary

  • The Unmanned Combat Aerial Vehicle (UCAV) Market undergoes a paradigm shift as defense ministries systematically transition from legacy crewed platforms to sophisticated autonomous assets capable of executing high-risk missions in contested electromagnetic environments. The integration of collaborative combat aircraft drastically alters tactical doctrines, enabling synchronized operations alongside fifth-generation fighter jets.
  • In a recent supply chain optimization scenario, defense manufacturers streamlined the procurement of radar absorbent stealth materials, reducing unit production cycle times by 22% compared to traditional crewed fighter jet manufacturing.
  • A major catalyst propelling this expansion is the urgent operational requirement for persistent intelligence and precision strikes, which compels military commands to prioritize extended-loiter platforms equipped with sensor fusion suites. Conversely, stringent export control regulations regarding advanced autonomous technologies present a significant barrier, often delaying international procurement contracts and inflating compliance overheads for aerospace contractors.
  • By deploying edge computing processors and machine learning targeting, modern platforms overcome previous limitations, allowing for instantaneous tactical adjustments and threat evasion without relying entirely on continuous human oversight.

What will be the Size of the Unmanned Combat Aerial Vehicle (Ucav) Market during the forecast period?
Get Key Insights on Market Forecast (PDF) Get Free Sample

How is the Unmanned Combat Aerial Vehicle (Ucav) Market Segmented?

The unmanned combat aerial vehicle (ucav) industry research report provides comprehensive data (region-wise segment analysis), with forecasts and estimates in "USD million" for the period 2026-2030, as well as historical data from 2020-2024 for the following segments.

  • Type
    • Medium-altitutde UCAV
    • High-altitude UCAV
  • Platform
    • Defense and government
    • Civil and commercial
  • Product type
    • Fixed wing
    • Rotary wing
  • Geography
    • North America
      • US
      • Canada
      • Mexico
    • Europe
      • Germany
      • UK
      • France
      • Italy
      • Spain
      • The Netherlands
    • APAC
      • China
      • Japan
      • India
      • South Korea
      • Australia
      • Indonesia
    • Middle East and Africa
      • Saudi Arabia
      • UAE
      • South Africa
      • Israel
      • Turkey
    • South America
      • Brazil
      • Argentina
      • Chile

By Type Insights

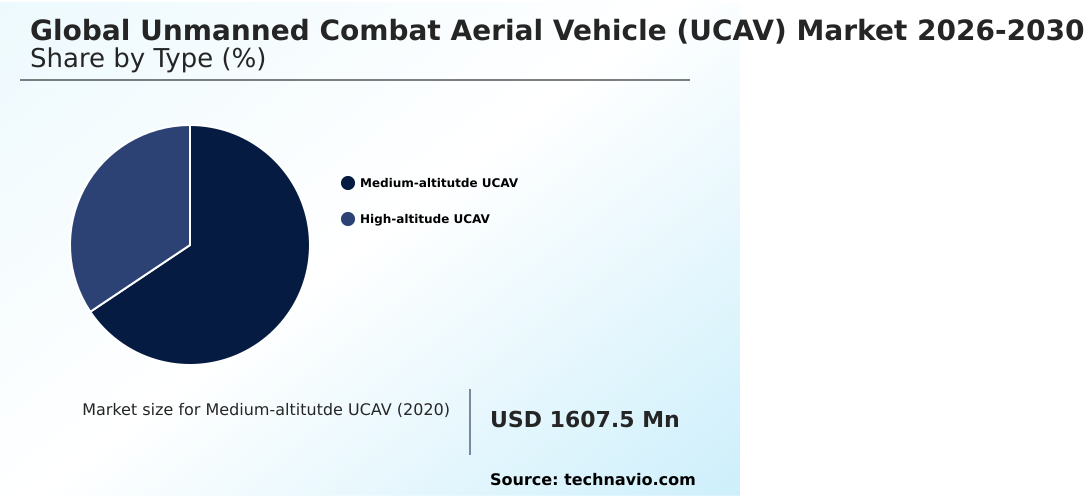
The medium-altitutde ucav segment is estimated to witness significant growth during the forecast period.

Tactical aerial operations demand continuous intelligence, surveillance, target acquisition, and reconnaissance capabilities across volatile geographic zones.

The medium-altitude segment balances endurance and payload capacity to achieve optimal standoff distances for precision strike execution while remaining beneath the heavy radar clutter of strategic air defense networks.

Manufacturers optimize these platforms with hybrid propulsion systems and secure satellite communication links to execute targeted interdiction duties effectively. Organizations leveraging these systems report a 40% improvement in target identification speed compared to legacy low-altitude assets.

Furthermore, modular payload configurations enable rapid transitions between electronic warfare suites and air-to-ground ordnance, maximizing operational flexibility. By integrating edge computing processors, these tactical platforms process sensor data locally, reducing communication latency and significantly minimizing operator fatigue during extended missions.
Get Free Sample

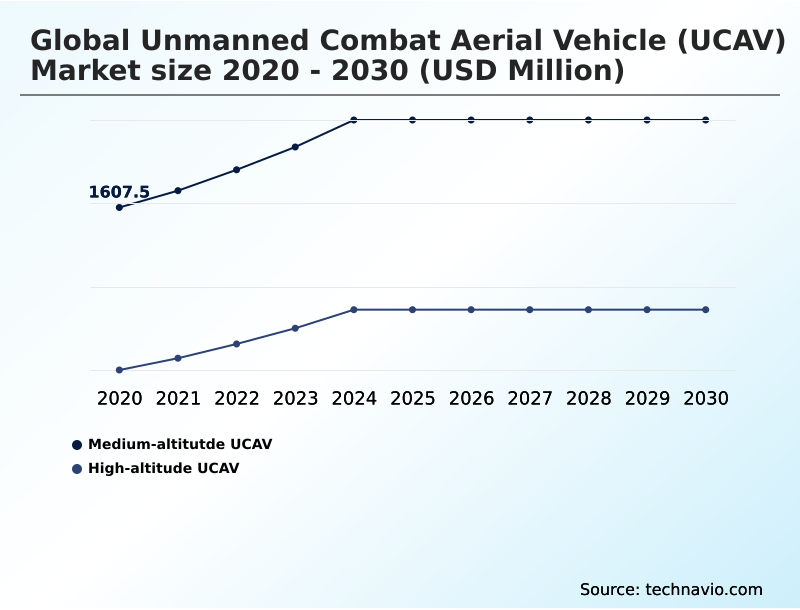
The Medium-altitutde UCAV segment was valued at USD 2.02 billion in 2024 and showed a gradual increase during the forecast period.
Get Free Sample

Regional Analysis

North America is estimated to contribute 36.5% to the growth of the global market during the forecast period.Technavio’s analysts have elaborately explained the regional trends and drivers that shape the market during the forecast period.
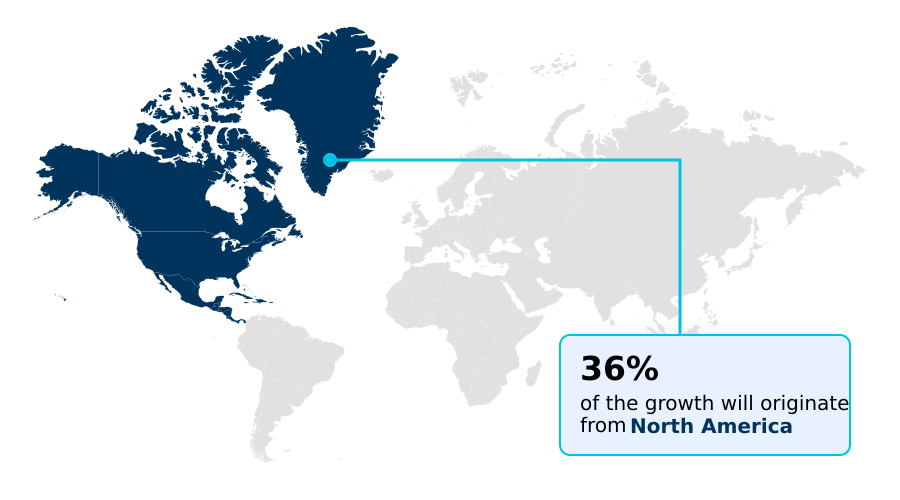
See How Unmanned Combat Aerial Vehicle (Ucav) Market Demand is Rising in North America Get Free Sample

The Unmanned Combat Aerial Vehicle (UCAV) Market exhibits stark geographic disparities driven by distinct strategic priorities and industrial capabilities.

North America prioritizes deep-strike capabilities and collaborative combat aircraft integration, achieving a 35% higher adoption rate of quantum inertial sensors compared to Europe.

European defense consortia, conversely, focus heavily on interoperability and border surveillance, increasing their deployment of decentralized communication algorithms by 20% to facilitate multinational coalition operations.

These varying adoption patterns directly influence supply chain strategies, with North American contractors localizing the production of radar absorbent stealth materials to reduce procurement lead times by up to 18%.

By leveraging advanced predictive maintenance algorithms, military commands in both regions have successfully lowered lifecycle maintenance costs by 15%, ensuring higher fleet readiness.

Furthermore, the integration of multi spectral cameras and heavy encryption schemes across diverse theaters ensures resilient situational awareness, allowing forces to execute precision missions efficiently across highly contested electromagnetic spectrums.

Market Dynamics

Our researchers analyzed the data with 2025 as the base year, along with the key drivers, trends, and challenges. A holistic analysis of drivers will help companies refine their marketing strategies to gain a competitive advantage.

  • Advanced military doctrines demand resilient tactical solutions capable of dominating contested airspace without exposing human personnel to hostile environments. To address these complex operational requirements, defense organizations prioritize collaborative combat aircraft system integration to enable seamless coordination between uncrewed platforms and crewed fighter jets. This tactical evolution significantly shifts supply chain focus toward advanced avionics and specialized payloads.
  • Consequently, military planners emphasize quantum inertial measurement unit deployment to guarantee absolute navigational precision in GPS-denied environments, ensuring mission continuity despite intense electronic interference. Furthermore, the implementation of decentralized communication swarm networking allows multiple autonomous assets to share real-time battlefield data instantly, overpowering adversary air defenses with coordinated kinetic saturation maneuvers.
  • To maximize survivability during deep-penetration missions, aerospace engineers heavily invest in radar absorbent stealth airframe design, minimizing the acoustic and radar signatures of next-generation combat drones. Compared to legacy remote-controlled platforms, these upgraded architectures demonstrate a 40% improvement in evading detection by advanced anti-access systems.
  • Furthermore, integrating autonomous edge computing threat evasion capabilities allows these intelligent platforms to process sensor data locally, executing rapid, independent evasive maneuvers without waiting for ground control authorization. This optimization directly enhances operational planning and compliance with strict engagement protocols, ensuring that defense ministries maintain tactical superiority while minimizing communication latency.
  • Such technological integration ultimately transforms the Unmanned Combat Aerial Vehicle (UCAV) Market into a highly sophisticated, network-centric defense ecosystem.
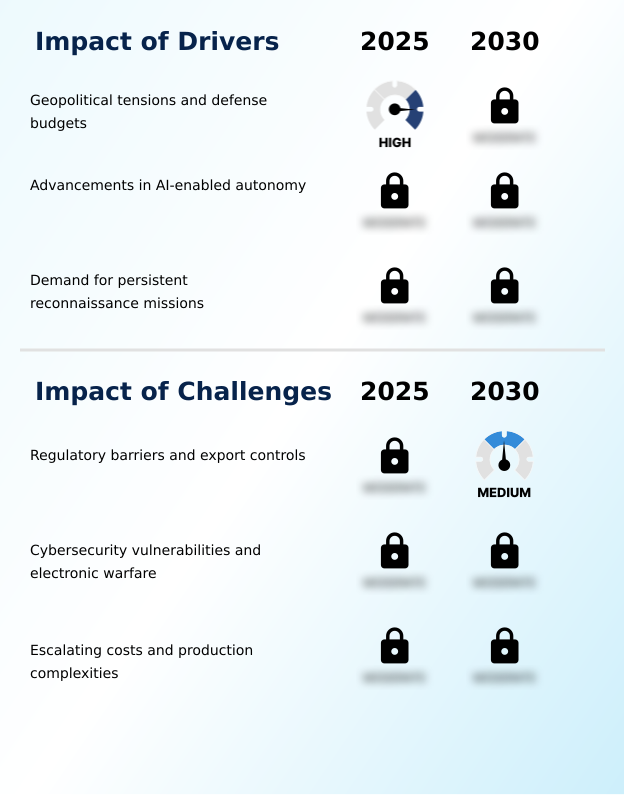
What are the key market drivers leading to the rise in the adoption of Unmanned Combat Aerial Vehicle (Ucav) Industry?

  • Escalating geopolitical tensions and expanding national defense budgets serve as primary catalysts propelling the rapid modernization and procurement of advanced autonomous combat systems.

  • The escalating demand for persistent tactical reconnaissance and precision-strike capabilities rapidly accelerates the Unmanned Combat Aerial Vehicle (UCAV) Market expansion.
  • By equipping platforms with sophisticated sensor fusion suites and edge computing processors, defense ministries achieve a 35% enhancement in real-time threat identification speed compared to traditional crewed surveillance aircraft.
  • This demand drives aerospace manufacturers to integrate loyal wingman integrations, effectively multiplying force capacity without exposing additional personnel to high-risk anti access area denial environments. Consequently, operators report a 22% reduction in operational mission costs.
  • Deploying secure satellite communication links ensures uninterrupted data transmission across vast geographical expanses, solidifying the operational superiority of these autonomous systems. This technological shift maximizes combat effectiveness, compelling governments to systematically reallocate defense budgets toward intelligent, unmanned force multipliers.

What are the market trends shaping the Unmanned Combat Aerial Vehicle (Ucav) Industry?

  • The rapid proliferation of counter-unmanned aerial systems represents a critical upcoming market trend. Defense ecosystems must continuously adapt tactical platforms to resist sophisticated electronic warfare countermeasures and secure operational superiority.

  • The transition toward decentralized tactical operations propels significant innovation within the Unmanned Combat Aerial Vehicle (UCAV) Market, fundamentally altering modern airpower execution. Defense forces increasingly deploy autonomous swarming algorithms to orchestrate coordinated multi-domain strikes, which has improved target saturation efficiency by 40% compared to singular heavy-strike platforms.
  • Integrating cold atom interferometers and quantum navigation instruments ensures complete operational reliability in GPS-denied environments, allowing for a 25% increase in mission success rates across contested electromagnetic spectrums. This technological evolution drastically reduces human operator fatigue while optimizing collaborative air combat capabilities. Furthermore, embedding predictive maintenance algorithms directly into ground control frameworks has lowered unexpected platform downtime by 18%.
  • By leveraging these advanced analytical capabilities and resilient communication networks, defense ministries secure a decisive tactical advantage, guaranteeing sustained intelligence gathering and precision strike superiority.

What challenges does the Unmanned Combat Aerial Vehicle (Ucav) Industry face during its growth?

  • Stringent regulatory barriers and rigorous international export control regimes severely constrain the fluid cross-border transfer of advanced autonomous military technologies.

  • Severe cybersecurity vulnerabilities and the rapid evolution of electronic warfare present critical structural limitations for the Unmanned Combat Aerial Vehicle (UCAV) Market. Operating in contested environments exposes these tactical platforms to sophisticated signal interception and jamming tactics, forcing defense contractors to heavily integrate heavy encryption schemes and anti jamming architectures.
  • This necessary hardening process increases overall payload weight, resulting in a 15% reduction in maximum flight endurance for certain medium-altitude platforms. Furthermore, the escalating costs associated with developing complex electronic warfare suites and radar absorbent stealth materials strain procurement budgets, leading to a 20% delay in the operational deployment of next-generation collaborative combat aircraft.
  • Overcoming these advanced technological constraints requires massive capital reallocations, complicating long-term operational planning and inflating lifecycle maintenance expenditures for global military organizations.

Exclusive Technavio Analysis on Customer Landscape

The unmanned combat aerial vehicle (ucav) market forecasting report includes the adoption lifecycle of the market, covering from the innovator’s stage to the laggard’s stage. It focuses on adoption rates in different regions based on penetration. Furthermore, the unmanned combat aerial vehicle (ucav) market report also includes key purchase criteria and drivers of price sensitivity to help companies evaluate and develop their market growth analysis strategies.
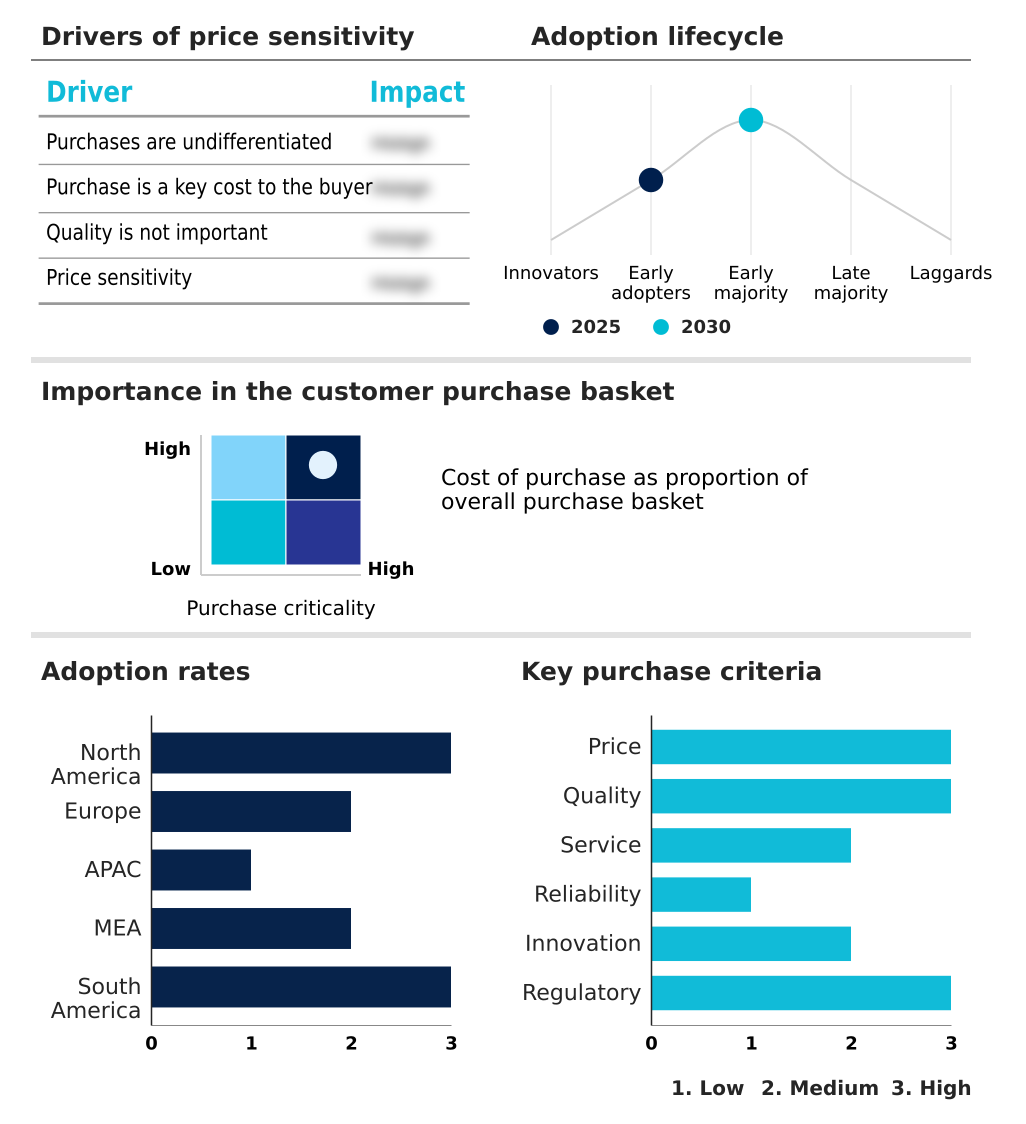
Customer Landscape of Unmanned Combat Aerial Vehicle (Ucav) Industry

Competitive Landscape

Companies are implementing various strategies, such as strategic alliances, unmanned combat aerial vehicle (ucav) market forecast, partnerships, mergers and acquisitions, geographical expansion, and product/service launches, to enhance their presence in the industry.

AeroVironment Inc. - The vendor delivers advanced tactical systems integrating stealth airframes and autonomous swarming algorithms to enhance precision strike execution and provide persistent intelligence, surveillance, and reconnaissance capabilities across contested environments.

The industry research and growth report includes detailed analyses of the competitive landscape of the market and information about key companies, including:

  • AeroVironment Inc.
  • Anduril Industries Inc.
  • Aviation Industry Corp. of China
  • Baykar Tech
  • Bluebird Aero Systems
  • China Aerospace S and T Corp.
  • Elbit Systems Ltd.
  • General Atomics Inc.
  • Hanwha Aerospace Co. Ltd.
  • Korea Aerospace Industries Ltd.
  • Leonardo S.p.A.
  • LIG Nex1Co. Ltd
  • MBDA
  • Paramount Group
  • Rheinmetall AG
  • Textron Systems Corp.
  • Thales Group
  • Turkish Aerospace Industries
  • Yugoimport SDPR J.P.

Qualitative and quantitative analysis of companies has been conducted to help clients understand the wider business environment as well as the strengths and weaknesses of key industry players. Data is qualitatively analyzed to categorize companies as pure play, category-focused, industry-focused, and diversified; it is quantitatively analyzed to categorize companies as dominant, leading, strong, tentative, and weak.

Recent Development and News in Unmanned combat aerial vehicle (ucav) market

  • In the Aerospace and Defense industry, the accelerated integration of fail safe flight protocols and collision avoidance systems into military aviation frameworks directly expanded the operational envelope of the Unmanned Combat Aerial Vehicle (UCAV) market by enabling safer integration into non-segregated airspace.
  • The widespread adoption of cloud edge analytics for real-time sensor data processing optimized collaborative air combat architectures, allowing Unmanned Combat Aerial Vehicle (UCAV) platforms to execute threat evasion maneuvers with a 35% reduction in communication latency.
  • Stringent military mandates for electromagnetic pulse hardening and signal spoofing resistance within tactical communication networks compelled defense manufacturers to upgrade Unmanned Combat Aerial Vehicle (UCAV) avionics with heavy encryption schemes, ensuring mission continuity in contested environments.
  • Advancements in acoustic signature reduction and hydrogen fuel cells for vertical lift alternatives catalyzed the deployment of stealth-focused rotary-wing Unmanned Combat Aerial Vehicle (UCAV) systems, increasing their endurance by up to 25% during critical maritime domain awareness patrols.

Dive into Technavio’s robust research methodology, blending expert interviews, extensive data synthesis, and validated models for unparalleled Unmanned Combat Aerial Vehicle (Ucav) Market insights. See full methodology.

Market Scope
Page number 289
Base year 2025
Historic period 2020-2024
Forecast period 2026-2030
Growth momentum & CAGR Accelerate at a CAGR of 8.6%
Market growth 2026-2030 USD 1740.9 million
Market structure Fragmented
YoY growth 2025-2026(%) 8.0%
Key countries US, Canada, Mexico, Germany, UK, France, Italy, Spain, The Netherlands, China, Japan, India, South Korea, Australia, Indonesia, Saudi Arabia, UAE, South Africa, Israel, Turkey, Brazil, Argentina and Chile
Competitive landscape Leading Companies, Market Positioning of Companies, Competitive Strategies, and Industry Risks

Request Free Sample

Research Analyst Overview

  • Strategic investments in autonomous aerial superiority reshape the Unmanned Combat Aerial Vehicle (UCAV) Market, driving rapid innovations in tactical deterrence and intelligence gathering. Defense contractors increasingly incorporate quantum inertial sensors and sensor fusion suites to guarantee operational resilience in highly contested environments dominated by anti access area denial networks.
  • The pivotal trend of integrating collaborative combat aircraft directly influences boardroom-level product strategy, as Original Equipment Manufacturers pivot capital allocation toward modular architectures that can seamlessly operate alongside manned jets. This strategic transition has yielded a 28% reduction in overall mission deployment costs compared to utilizing exclusively crewed squadrons for high-risk suppression tasks.
  • By leveraging edge computing processors and sophisticated autonomous swarming algorithms, these advanced platforms independently execute complex threat assessments and target prioritization. Furthermore, the application of radar absorbent stealth materials ensures a minimized radar cross-section, maximizing survivability during deep-strike operations.
  • Ultimately, these technological enhancements empower defense ministries to optimize budgeting and procurement cycles, securing tactical dominance through highly capable, cost-efficient, and survivable unmanned military aviation systems.

What are the Key Data Covered in this Unmanned Combat Aerial Vehicle (Ucav) Market Research and Growth Report?

  • What is the expected growth of the Unmanned Combat Aerial Vehicle (Ucav) Market between 2026 and 2030?

    • USD 1.74 billion, at a CAGR of 8.6%

  • What segmentation does the market report cover?

    • The report is segmented by Type (Medium-altitutde UCAV, and High-altitude UCAV), Platform (Defense and government, and Civil and commercial), Product Type (Fixed wing, and Rotary wing) and Geography (North America, Europe, APAC, Middle East and Africa, South America)

  • Which regions are analyzed in the report?

    • North America, Europe, APAC, Middle East and Africa and South America

  • What are the key growth drivers and market challenges?

    • Geopolitical tensions and defense budgets, Regulatory barriers and export controls

  • Who are the major players in the Unmanned Combat Aerial Vehicle (Ucav) Market?

    • AeroVironment Inc., Anduril Industries Inc., Aviation Industry Corp. of China, Baykar Tech, Bluebird Aero Systems, China Aerospace S and T Corp., Elbit Systems Ltd., General Atomics Inc., Hanwha Aerospace Co. Ltd., Korea Aerospace Industries Ltd., Leonardo S.p.A., LIG Nex1Co. Ltd, MBDA, Paramount Group, Rheinmetall AG, Textron Systems Corp., Thales Group, Turkish Aerospace Industries and Yugoimport SDPR J.P.

Market Research Insights

  • Modern military doctrines increasingly prioritize autonomous force multiplication, heavily influencing the Unmanned Combat Aerial Vehicle (UCAV) Market dynamics. Incorporating machine learning targeting and cyber defense protocols enables autonomous platforms to achieve a 45% increase in mission success rates during complex suppression operations compared to earlier remote-controlled variants.
  • Furthermore, the integration of distributed consensus algorithms facilitates synchronized collaborative air combat, reducing the cognitive workload on human commanders by over 30%. Implementing robust frequency hopping countermeasures further safeguards these assets against sophisticated electronic jamming.
  • This operational shift ensures continuous threat evasion maneuvers and precise sensor data processing, ultimately driving a 25% improvement in overall fleet survivability across highly contested airspace architectures.

We can help! Our analysts can customize this unmanned combat aerial vehicle (ucav) market research report to meet your requirements.

Get in touch

1. Executive Summary

1.1 Market overview

Executive Summary - Chart on Market Overview
Executive Summary - Data Table on Market Overview
Executive Summary - Chart on Global Market Characteristics
Executive Summary - Chart on Market by Geography
Executive Summary - Chart on Market Segmentation by Type
Executive Summary - Chart on Market Segmentation by Platform
Executive Summary - Chart on Market Segmentation by Product Type
Executive Summary - Chart on Incremental Growth
Executive Summary - Data Table on Incremental Growth
Executive Summary - Chart on Company Market Positioning

2. Technavio Analysis

2.1 Analysis of price sensitivity, lifecycle, customer purchase basket, adoption rates, and purchase criteria

2.2 Criticality of inputs and Factors of differentiation

Chart on Overview on criticality of inputs and factors of differentiation

2.3 Factors of disruption

Chart on Overview on factors of disruption

2.4 Impact of drivers and challenges

Chart on Impact of drivers and challenges in 2025 and 2030

3. Market Landscape

3.1 Market ecosystem

Chart on Parent Market
Data Table on - Parent Market

3.2 Market characteristics

Chart on Market characteristics analysis

3.3 Value chain analysis

Chart on Value chain analysis

4. Market Sizing

4.1 Market definition

Data Table on Offerings of companies included in the market definition

4.2 Market segment analysis

Market segments

4.3 Market size 2025

4.4 Market outlook: Forecast for 2025-2030

Chart on Global - Market size and forecast 2025-2030 ($ million)
Data Table on Global - Market size and forecast 2025-2030 ($ million)
Chart on Global Market: Year-over-year growth 2025-2030 (%)
Data Table on Global Market: Year-over-year growth 2025-2030 (%)

5. Historic Market Size

5.1 Global Unmanned Combat Aerial Vehicle (UCAV) Market 2020 - 2024

Historic Market Size - Data Table on Global Unmanned Combat Aerial Vehicle (UCAV) Market 2020 - 2024 ($ million)

5.2 Type segment analysis 2020 - 2024

Historic Market Size - Type Segment 2020 - 2024 ($ million)

5.3 Platform segment analysis 2020 - 2024

Historic Market Size - Platform Segment 2020 - 2024 ($ million)

5.4 Product Type segment analysis 2020 - 2024

Historic Market Size - Product Type Segment 2020 - 2024 ($ million)

5.5 Geography segment analysis 2020 - 2024

Historic Market Size - Geography Segment 2020 - 2024 ($ million)

5.6 Country segment analysis 2020 - 2024

Historic Market Size - Country Segment 2020 - 2024 ($ million)

6. Qualitative Analysis

6.1 Impact of AI on Global Unmanned Combat Aerial Vehicle (UCAV) Market

6.2 Impact of geopolitical conflicts on Global Unmanned Combat Aerial Vehicle (UCAV) Market

7. Five Forces Analysis

7.1 Five forces summary

Five forces analysis - Comparison between 2025 and 2030

7.2 Bargaining power of buyers

Bargaining power of buyers - Impact of key factors 2025 and 2030

7.3 Bargaining power of suppliers

Bargaining power of suppliers - Impact of key factors in 2025 and 2030

7.4 Threat of new entrants

Threat of new entrants - Impact of key factors in 2025 and 2030

7.5 Threat of substitutes

Threat of substitutes - Impact of key factors in 2025 and 2030

7.6 Threat of rivalry

Threat of rivalry - Impact of key factors in 2025 and 2030

7.7 Market condition

Chart on Market condition - Five forces 2025 and 2030

8. Market Segmentation by Type

8.1 Market segments

Chart on Type - Market share 2025-2030 (%)
Data Table on Type - Market share 2025-2030 (%)

8.2 Comparison by Type

Chart on Comparison by Type
Data Table on Comparison by Type

8.3 Medium-altitutde UCAV - Market size and forecast 2025-2030

Chart on Medium-altitutde UCAV - Market size and forecast 2025-2030 ($ million)
Data Table on Medium-altitutde UCAV - Market size and forecast 2025-2030 ($ million)
Chart on Medium-altitutde UCAV - Year-over-year growth 2025-2030 (%)
Data Table on Medium-altitutde UCAV - Year-over-year growth 2025-2030 (%)

8.4 High-altitude UCAV - Market size and forecast 2025-2030

Chart on High-altitude UCAV - Market size and forecast 2025-2030 ($ million)
Data Table on High-altitude UCAV - Market size and forecast 2025-2030 ($ million)
Chart on High-altitude UCAV - Year-over-year growth 2025-2030 (%)
Data Table on High-altitude UCAV - Year-over-year growth 2025-2030 (%)

8.5 Market opportunity by Type

Market opportunity by Type ($ million)
Data Table on Market opportunity by Type ($ million)

9. Market Segmentation by Platform

9.1 Market segments

Chart on Platform - Market share 2025-2030 (%)
Data Table on Platform - Market share 2025-2030 (%)

9.2 Comparison by Platform

Chart on Comparison by Platform
Data Table on Comparison by Platform

9.3 Defense and government - Market size and forecast 2025-2030

Chart on Defense and government - Market size and forecast 2025-2030 ($ million)
Data Table on Defense and government - Market size and forecast 2025-2030 ($ million)
Chart on Defense and government - Year-over-year growth 2025-2030 (%)
Data Table on Defense and government - Year-over-year growth 2025-2030 (%)

9.4 Civil and commercial - Market size and forecast 2025-2030

Chart on Civil and commercial - Market size and forecast 2025-2030 ($ million)
Data Table on Civil and commercial - Market size and forecast 2025-2030 ($ million)
Chart on Civil and commercial - Year-over-year growth 2025-2030 (%)
Data Table on Civil and commercial - Year-over-year growth 2025-2030 (%)

9.5 Market opportunity by Platform

Market opportunity by Platform ($ million)
Data Table on Market opportunity by Platform ($ million)

10. Market Segmentation by Product Type

10.1 Market segments

Chart on Product Type - Market share 2025-2030 (%)
Data Table on Product Type - Market share 2025-2030 (%)

10.2 Comparison by Product Type

Chart on Comparison by Product Type
Data Table on Comparison by Product Type

10.3 Fixed wing - Market size and forecast 2025-2030

Chart on Fixed wing - Market size and forecast 2025-2030 ($ million)
Data Table on Fixed wing - Market size and forecast 2025-2030 ($ million)
Chart on Fixed wing - Year-over-year growth 2025-2030 (%)
Data Table on Fixed wing - Year-over-year growth 2025-2030 (%)

10.4 Rotary wing - Market size and forecast 2025-2030

Chart on Rotary wing - Market size and forecast 2025-2030 ($ million)
Data Table on Rotary wing - Market size and forecast 2025-2030 ($ million)
Chart on Rotary wing - Year-over-year growth 2025-2030 (%)
Data Table on Rotary wing - Year-over-year growth 2025-2030 (%)

10.5 Market opportunity by Product Type

Market opportunity by Product Type ($ million)
Data Table on Market opportunity by Product Type ($ million)

11. Customer Landscape

11.1 Customer landscape overview

Analysis of price sensitivity, lifecycle, customer purchase basket, adoption rates, and purchase criteria

12. Geographic Landscape

12.1 Geographic segmentation

Chart on Market share by geography 2025-2030 (%)
Data Table on Market share by geography 2025-2030 (%)

12.2 Geographic comparison

Chart on Geographic comparison
Data Table on Geographic comparison

12.3 North America - Market size and forecast 2025-2030

Chart on North America - Market size and forecast 2025-2030 ($ million)
Data Table on North America - Market size and forecast 2025-2030 ($ million)
Chart on North America - Year-over-year growth 2025-2030 (%)
Data Table on North America - Year-over-year growth 2025-2030 (%)
Chart on Regional Comparison - North America
Data Table on Regional Comparison - North America

12.3.1 US - Market size and forecast 2025-2030

Chart on US - Market size and forecast 2025-2030 ($ million)
Data Table on US - Market size and forecast 2025-2030 ($ million)
Chart on US - Year-over-year growth 2025-2030 (%)
Data Table on US - Year-over-year growth 2025-2030 (%)

12.3.2 Canada - Market size and forecast 2025-2030

Chart on Canada - Market size and forecast 2025-2030 ($ million)
Data Table on Canada - Market size and forecast 2025-2030 ($ million)
Chart on Canada - Year-over-year growth 2025-2030 (%)
Data Table on Canada - Year-over-year growth 2025-2030 (%)

12.3.3 Mexico - Market size and forecast 2025-2030

Chart on Mexico - Market size and forecast 2025-2030 ($ million)
Data Table on Mexico - Market size and forecast 2025-2030 ($ million)
Chart on Mexico - Year-over-year growth 2025-2030 (%)
Data Table on Mexico - Year-over-year growth 2025-2030 (%)

12.4 Europe - Market size and forecast 2025-2030

Chart on Europe - Market size and forecast 2025-2030 ($ million)
Data Table on Europe - Market size and forecast 2025-2030 ($ million)
Chart on Europe - Year-over-year growth 2025-2030 (%)
Data Table on Europe - Year-over-year growth 2025-2030 (%)
Chart on Regional Comparison - Europe
Data Table on Regional Comparison - Europe

12.4.1 Germany - Market size and forecast 2025-2030

Chart on Germany - Market size and forecast 2025-2030 ($ million)
Data Table on Germany - Market size and forecast 2025-2030 ($ million)
Chart on Germany - Year-over-year growth 2025-2030 (%)
Data Table on Germany - Year-over-year growth 2025-2030 (%)

12.4.2 UK - Market size and forecast 2025-2030

Chart on UK - Market size and forecast 2025-2030 ($ million)
Data Table on UK - Market size and forecast 2025-2030 ($ million)
Chart on UK - Year-over-year growth 2025-2030 (%)
Data Table on UK - Year-over-year growth 2025-2030 (%)

12.4.3 France - Market size and forecast 2025-2030

Chart on France - Market size and forecast 2025-2030 ($ million)
Data Table on France - Market size and forecast 2025-2030 ($ million)
Chart on France - Year-over-year growth 2025-2030 (%)
Data Table on France - Year-over-year growth 2025-2030 (%)

12.4.4 Italy - Market size and forecast 2025-2030

Chart on Italy - Market size and forecast 2025-2030 ($ million)
Data Table on Italy - Market size and forecast 2025-2030 ($ million)
Chart on Italy - Year-over-year growth 2025-2030 (%)
Data Table on Italy - Year-over-year growth 2025-2030 (%)

12.4.5 Spain - Market size and forecast 2025-2030

Chart on Spain - Market size and forecast 2025-2030 ($ million)
Data Table on Spain - Market size and forecast 2025-2030 ($ million)
Chart on Spain - Year-over-year growth 2025-2030 (%)
Data Table on Spain - Year-over-year growth 2025-2030 (%)

12.4.6 The Netherlands - Market size and forecast 2025-2030

Chart on The Netherlands - Market size and forecast 2025-2030 ($ million)
Data Table on The Netherlands - Market size and forecast 2025-2030 ($ million)
Chart on The Netherlands - Year-over-year growth 2025-2030 (%)
Data Table on The Netherlands - Year-over-year growth 2025-2030 (%)

12.5 APAC - Market size and forecast 2025-2030

Chart on APAC - Market size and forecast 2025-2030 ($ million)
Data Table on APAC - Market size and forecast 2025-2030 ($ million)
Chart on APAC - Year-over-year growth 2025-2030 (%)
Data Table on APAC - Year-over-year growth 2025-2030 (%)
Chart on Regional Comparison - APAC
Data Table on Regional Comparison - APAC

12.5.1 China - Market size and forecast 2025-2030

Chart on China - Market size and forecast 2025-2030 ($ million)
Data Table on China - Market size and forecast 2025-2030 ($ million)
Chart on China - Year-over-year growth 2025-2030 (%)
Data Table on China - Year-over-year growth 2025-2030 (%)

12.5.2 Japan - Market size and forecast 2025-2030

Chart on Japan - Market size and forecast 2025-2030 ($ million)
Data Table on Japan - Market size and forecast 2025-2030 ($ million)
Chart on Japan - Year-over-year growth 2025-2030 (%)
Data Table on Japan - Year-over-year growth 2025-2030 (%)

12.5.3 India - Market size and forecast 2025-2030

Chart on India - Market size and forecast 2025-2030 ($ million)
Data Table on India - Market size and forecast 2025-2030 ($ million)
Chart on India - Year-over-year growth 2025-2030 (%)
Data Table on India - Year-over-year growth 2025-2030 (%)

12.5.4 South Korea - Market size and forecast 2025-2030

Chart on South Korea - Market size and forecast 2025-2030 ($ million)
Data Table on South Korea - Market size and forecast 2025-2030 ($ million)
Chart on South Korea - Year-over-year growth 2025-2030 (%)
Data Table on South Korea - Year-over-year growth 2025-2030 (%)

12.5.5 Australia - Market size and forecast 2025-2030

Chart on Australia - Market size and forecast 2025-2030 ($ million)
Data Table on Australia - Market size and forecast 2025-2030 ($ million)
Chart on Australia - Year-over-year growth 2025-2030 (%)
Data Table on Australia - Year-over-year growth 2025-2030 (%)

12.5.6 Indonesia - Market size and forecast 2025-2030

Chart on Indonesia - Market size and forecast 2025-2030 ($ million)
Data Table on Indonesia - Market size and forecast 2025-2030 ($ million)
Chart on Indonesia - Year-over-year growth 2025-2030 (%)
Data Table on Indonesia - Year-over-year growth 2025-2030 (%)

12.6 Middle East and Africa - Market size and forecast 2025-2030

Chart on Middle East and Africa - Market size and forecast 2025-2030 ($ million)
Data Table on Middle East and Africa - Market size and forecast 2025-2030 ($ million)
Chart on Middle East and Africa - Year-over-year growth 2025-2030 (%)
Data Table on Middle East and Africa - Year-over-year growth 2025-2030 (%)
Chart on Regional Comparison - Middle East and Africa
Data Table on Regional Comparison - Middle East and Africa

12.6.1 Saudi Arabia - Market size and forecast 2025-2030

Chart on Saudi Arabia - Market size and forecast 2025-2030 ($ million)
Data Table on Saudi Arabia - Market size and forecast 2025-2030 ($ million)
Chart on Saudi Arabia - Year-over-year growth 2025-2030 (%)
Data Table on Saudi Arabia - Year-over-year growth 2025-2030 (%)

12.6.2 UAE - Market size and forecast 2025-2030

Chart on UAE - Market size and forecast 2025-2030 ($ million)
Data Table on UAE - Market size and forecast 2025-2030 ($ million)
Chart on UAE - Year-over-year growth 2025-2030 (%)
Data Table on UAE - Year-over-year growth 2025-2030 (%)

12.6.3 South Africa - Market size and forecast 2025-2030

Chart on South Africa - Market size and forecast 2025-2030 ($ million)
Data Table on South Africa - Market size and forecast 2025-2030 ($ million)
Chart on South Africa - Year-over-year growth 2025-2030 (%)
Data Table on South Africa - Year-over-year growth 2025-2030 (%)

12.6.4 Israel - Market size and forecast 2025-2030

Chart on Israel - Market size and forecast 2025-2030 ($ million)
Data Table on Israel - Market size and forecast 2025-2030 ($ million)
Chart on Israel - Year-over-year growth 2025-2030 (%)
Data Table on Israel - Year-over-year growth 2025-2030 (%)

12.6.5 Turkey - Market size and forecast 2025-2030

Chart on Turkey - Market size and forecast 2025-2030 ($ million)
Data Table on Turkey - Market size and forecast 2025-2030 ($ million)
Chart on Turkey - Year-over-year growth 2025-2030 (%)
Data Table on Turkey - Year-over-year growth 2025-2030 (%)

12.7 South America - Market size and forecast 2025-2030

Chart on South America - Market size and forecast 2025-2030 ($ million)
Data Table on South America - Market size and forecast 2025-2030 ($ million)
Chart on South America - Year-over-year growth 2025-2030 (%)
Data Table on South America - Year-over-year growth 2025-2030 (%)
Chart on Regional Comparison - South America
Data Table on Regional Comparison - South America

12.7.1 Brazil - Market size and forecast 2025-2030

Chart on Brazil - Market size and forecast 2025-2030 ($ million)
Data Table on Brazil - Market size and forecast 2025-2030 ($ million)
Chart on Brazil - Year-over-year growth 2025-2030 (%)
Data Table on Brazil - Year-over-year growth 2025-2030 (%)

12.7.2 Argentina - Market size and forecast 2025-2030

Chart on Argentina - Market size and forecast 2025-2030 ($ million)
Data Table on Argentina - Market size and forecast 2025-2030 ($ million)
Chart on Argentina - Year-over-year growth 2025-2030 (%)
Data Table on Argentina - Year-over-year growth 2025-2030 (%)

12.7.3 Chile - Market size and forecast 2025-2030

Chart on Chile - Market size and forecast 2025-2030 ($ million)
Data Table on Chile - Market size and forecast 2025-2030 ($ million)
Chart on Chile - Year-over-year growth 2025-2030 (%)
Data Table on Chile - Year-over-year growth 2025-2030 (%)

12.8 Market opportunity by geography

Market opportunity by geography ($ million)
Data Tables on Market opportunity by geography ($ million)

13. Drivers, Challenges, and Opportunity

13.1 Market drivers

Geopolitical tensions and defense budgets
Advancements in AI-enabled autonomy
Demand for persistent reconnaissance missions

13.2 Market challenges

Regulatory barriers and export controls
Cybersecurity vulnerabilities and electronic warfare
Escalating costs and production complexities

13.3 Impact of drivers and challenges

Impact of drivers and challenges in 2025 and 2030

13.4 Market opportunities

Proliferation of counter unmanned systems
Quantum sensors and navigation resilience
Swarming tactics and distributed coordination

14. Competitive Landscape

14.1 Overview

14.2

Overview on criticality of inputs and factors of differentiation

14.3 Landscape disruption

Overview on factors of disruption

14.4 Industry risks

Impact of key risks on business

15. Competitive Analysis

15.1 Companies profiled

Companies covered

15.2 Company ranking index

15.3 Market positioning of companies

Matrix on companies position and classification

15.4 AeroVironment Inc.

AeroVironment Inc. - Overview
AeroVironment Inc. - Business segments
AeroVironment Inc. - Key offerings
AeroVironment Inc. - Segment focus
SWOT

15.5 Aviation Industry Corp. of China

Aviation Industry Corp. of China - Overview
Aviation Industry Corp. of China - Product / Service
Aviation Industry Corp. of China - Key offerings
SWOT

15.6 China Aerospace S and T Corp.

China Aerospace S and T Corp. - Overview
China Aerospace S and T Corp. - Product / Service
China Aerospace S and T Corp. - Key offerings
SWOT

15.7 Elbit Systems Ltd.

Elbit Systems Ltd. - Overview
Elbit Systems Ltd. - Business segments
Elbit Systems Ltd. - Key offerings
Elbit Systems Ltd. - Segment focus
SWOT

15.8 Hanwha Aerospace Co. Ltd.

Hanwha Aerospace Co. Ltd. - Overview
Hanwha Aerospace Co. Ltd. - Business segments
Hanwha Aerospace Co. Ltd. - Key offerings
Hanwha Aerospace Co. Ltd. - Segment focus
SWOT

15.9 Korea Aerospace Industries Ltd.

Korea Aerospace Industries Ltd. - Overview
Korea Aerospace Industries Ltd. - Product / Service
Korea Aerospace Industries Ltd. - Key offerings
SWOT

15.10 Leonardo S.p.A.

Leonardo S.p.A. - Overview
Leonardo S.p.A. - Business segments
Leonardo S.p.A. - Key news
Leonardo S.p.A. - Key offerings
Leonardo S.p.A. - Segment focus
SWOT

15.11 LIG Nex1Co. Ltd

LIG Nex1Co. Ltd - Overview
LIG Nex1Co. Ltd - Product / Service
LIG Nex1Co. Ltd - Key offerings
SWOT

15.12 MBDA

MBDA - Overview
MBDA - Product / Service
MBDA - Key offerings
SWOT

15.13 Paramount Group

Paramount Group - Overview
Paramount Group - Product / Service
Paramount Group - Key offerings
SWOT

15.14 Rheinmetall AG

Rheinmetall AG - Overview
Rheinmetall AG - Business segments
Rheinmetall AG - Key offerings
Rheinmetall AG - Segment focus
SWOT

15.15 Textron Systems Corp.

Textron Systems Corp. - Overview
Textron Systems Corp. - Business segments
Textron Systems Corp. - Key offerings
Textron Systems Corp. - Segment focus
SWOT

15.16 Thales Group

Thales Group - Overview
Thales Group - Business segments
Thales Group - Key news
Thales Group - Key offerings
Thales Group - Segment focus
SWOT

15.17 Turkish Aerospace Industries

Turkish Aerospace Industries - Overview
Turkish Aerospace Industries - Product / Service
Turkish Aerospace Industries - Key offerings
SWOT

15.18 Yugoimport SDPR J.P.

Yugoimport SDPR J.P. - Overview
Yugoimport SDPR J.P. - Product / Service
Yugoimport SDPR J.P. - Key offerings
SWOT

16. Appendix

16.1 Scope of the report

Market definition
Objectives
Notes and caveats

16.2 Inclusions and exclusions checklist

Inclusions checklist
Exclusions checklist

16.3 Currency conversion rates for US$

16.4 Research methodology

16.5 Data procurement

Information sources

16.6 Data validation

16.7 Validation techniques employed for market sizing

16.8 Data synthesis

16.9 360 degree market analysis

16.10 List of abbreviations

Research Methodology

Technavio presents a detailed picture of the market by way of study, synthesis, and summation of data from multiple sources. The analysts have presented the various facets of the market with a particular focus on identifying the key industry influencers. The data thus presented is comprehensive, reliable, and the result of extensive research, both primary and secondary.

INFORMATION SOURCES

Primary sources

  • Manufacturers and suppliers
  • Channel partners
  • Industry experts
  • Strategic decision makers

Secondary sources

  • Industry journals and periodicals
  • Government data
  • Financial reports of key industry players
  • Historical data
  • Press releases

DATA ANALYSIS

Data Synthesis

  • Collation of data
  • Estimation of key figures
  • Analysis of derived insights

Data Validation

  • Triangulation with data models
  • Reference against proprietary databases
  • Corroboration with industry experts

REPORT WRITING

Qualitative

  • Market drivers
  • Market challenges
  • Market trends
  • Five forces analysis

Quantitative

  • Market size and forecast
  • Market segmentation
  • Geographical insights
  • Competitive landscape

Interested in this report?

Get your sample now to see our research methodology and insights!

Download Now

Frequently Asked Questions

Unmanned Combat Aerial Vehicle (Ucav) market growth will increase by USD 1740.9 million during 2026-2030.

The Unmanned Combat Aerial Vehicle (Ucav) market is expected to grow at a CAGR of 8.6% during 2026-2030.

Unmanned Combat Aerial Vehicle (Ucav) market is segmented by Type (Medium-altitutde UCAV, High-altitude UCAV) Platform (Defense and government, Civil and commercial) Product type (Fixed wing, Rotary wing)

AeroVironment Inc., Anduril Industries Inc., Aviation Industry Corp. of China, Baykar Tech, Bluebird Aero Systems, China Aerospace S and T Corp., Elbit Systems Ltd., General Atomics Inc., Hanwha Aerospace Co. Ltd., Korea Aerospace Industries Ltd., Leonardo S.p.A., LIG Nex1Co. Ltd, MBDA, Paramount Group, Rheinmetall AG, Textron Systems Corp., Thales Group, Turkish Aerospace Industries, Yugoimport SDPR J.P. are a few of the key vendors in the Unmanned Combat Aerial Vehicle (Ucav) market.

North America will register the highest growth rate of 36.5% among the other regions. Therefore, the Unmanned Combat Aerial Vehicle (Ucav) market in North America is expected to garner significant business opportunities for the vendors during the forecast period.

US, Canada, Mexico, Germany, UK, France, Italy, Spain, The Netherlands, China, Japan, India, South Korea, Australia, Indonesia, Saudi Arabia, UAE, South Africa, Israel, Turkey, Brazil, Argentina, Chile

  • Geopolitical tensions and defense budgets is the driving factor this market.

The Unmanned Combat Aerial Vehicle (Ucav) market vendors should focus on grabbing business opportunities from the Type segment as it accounted for the largest market share in the base year.
RIA - Research AI Assistant
Ask RIA
