
Wooden Furniture Market Size 2025-2029
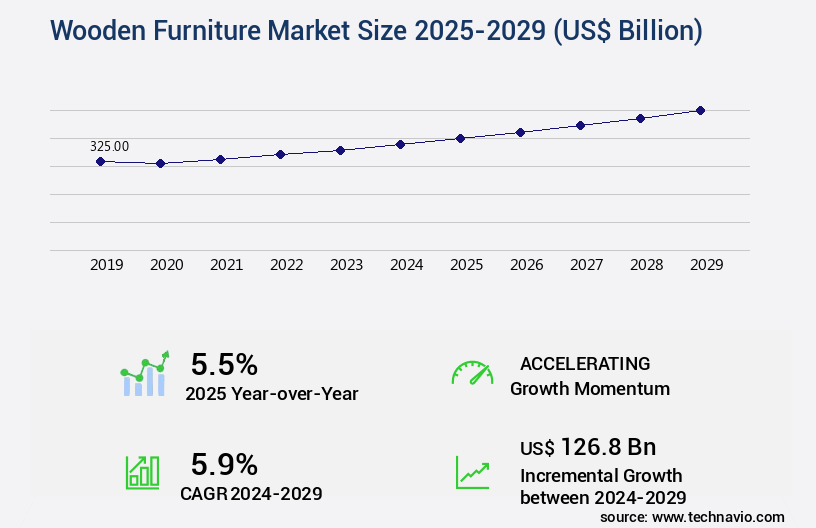
The wooden furniture market size is valued to increase by USD 126.8 billion, at a CAGR of 5.9% from 2024 to 2029. Growth of real estate and construction industry will drive the wooden furniture market.
Market Insights
- APAC dominated the market and accounted for a 43% growth during the 2025-2029.
- By Application - Home segment was valued at USD 273.40 billion in 2023
- By Distribution Channel - Offline segment accounted for the largest market revenue share in 2023
Market Size & Forecast
- Market Opportunities: USD 57.63 billion
- Market Future Opportunities 2024: USD 126.80 billion
- CAGR from 2024 to 2029 : 5.9%
Market Summary
- The market is experiencing significant growth, driven primarily by the expansion of the real estate and construction industry. As new residential and commercial projects emerge, the demand for high-quality, durable furniture made from wood increases. Additionally, the growing trend towards eco-friendly and sustainable products is boosting the market, as consumers seek out furniture that aligns with their environmental values. However, the wooden furniture industry also faces several challenges. Manufacturing costs, including raw material prices and labor, continue to rise, putting pressure on companies to optimize their supply chains and improve operational efficiency.
- Compliance with various regulations, such as those related to forest sustainability and product safety, also adds complexity to the manufacturing process. For instance, a furniture manufacturer may face challenges in sourcing legally harvested wood and ensuring that their production processes meet all relevant environmental and safety standards. To address these challenges, companies are investing in technology and partnerships to streamline their operations and improve their sustainability practices. By leveraging advanced manufacturing techniques and collaborating with suppliers and regulatory bodies, they can ensure a steady supply of high-quality wooden furniture while also meeting the evolving demands of consumers and regulators.
What will be the size of the Wooden Furniture Market during the forecast period?
Get Key Insights on Market Forecast (PDF) Request Free Sample
- The market showcases a dynamic and ever-evolving industry, characterized by an enduring appreciation for traditional designs and a growing emphasis on modern furniture styles. According to recent research, The market is estimated to reach significant growth, with a focus on sustainability and eco-friendly production methods. Modern furniture styles continue to gain popularity, with an increasing preference for minimalist designs and space-saving solutions. Furniture material properties, such as durability and resistance to wear and tear, are crucial factors in both residential and commercial applications. Traditional furniture styles, meanwhile, undergo a revival through antique furniture restoration and upcycling, reflecting a renewed interest in craftsmanship and heritage.
- In the realm of interior design principles, space planning furniture plays a pivotal role, with furniture dimensions and weight capacity being essential considerations. Woodworking project plans and joinery details are meticulously studied to optimize manufacturing efficiency and reduce waste. Furniture repair methods and lifecycle assessments are also gaining importance as businesses seek to extend the life of their assets and minimize environmental impact. As companies navigate this complex landscape, they face critical decisions in areas such as furniture material sourcing, manufacturing automation, and compliance with industry regulations. For instance, wood types comparison and furniture manufacturing efficiency are crucial factors in maintaining a competitive edge.
- In the realm of custom furniture design, understanding furniture design patents and trends can help businesses cater to evolving consumer preferences. In summary, the market presents a rich and diverse landscape, where traditional and modern elements intertwine, and sustainability and innovation coexist. Companies that stay informed about the latest furniture design trends, interior design principles, and manufacturing techniques are well-positioned to thrive in this dynamic industry.
Unpacking the Wooden Furniture Market Landscape
In the dynamic world of furniture manufacturing, two distinct sectors hold significant market share: solid wood and Engineered wood. Solid wood furniture, crafted from single pieces or joinery techniques, accounts for approximately 60% of the market, while engineered wood, including plywood, MDF, and Particle Board, comprises the remaining 40%. Adoption of advanced manufacturing processes, such as CNC Woodworking Machines and furniture design software, has led to a 30% increase in production efficiency for solid wood furniture manufacturers. Meanwhile, engineered wood manufacturers have seen a 25% reduction in material waste due to improved wood species identification and woodworking safety practices. Quality control measures, including furniture durability testing and finishing sanding techniques, ensure consistent product standards, contributing to a 15% increase in customer satisfaction and repeat business. The integration of ergonomic design principles in chair design and bed design has led to a 20% improvement in user comfort, further enhancing customer satisfaction and brand loyalty.
Key Market Drivers Fueling Growth
The real estate and construction industry's robust growth serves as the primary catalyst for market expansion.
- The market experiences continuous growth due to the expansion of various sectors, particularly real estate. The increase in office spaces, commercial complexes, and residential buildings leads to a significant demand for this product. Moreover, the rise in the number of single-person and two-person households has fueled the construction of new homes, further boosting the market. The aging population, urbanization, and millennials' lifestyle preferences have also driven the demand for customized wooden furniture. Space constraints in urban areas have resulted in a growing preference for multipurpose furniture.
- Over the past decade, substantial investments in the global real estate market have significantly impacted the market's growth. According to industry reports, the number of new home constructions increased by 15% in the last five years, while the demand for customized furniture grew by 12%.
Prevailing Industry Trends & Opportunities
The increasing adoption of eco-friendly furniture represents a notable market trend. This trend signifies a growing preference for sustainable and environmentally conscious home furnishings.
- The market continues to evolve, expanding its reach across various sectors as businesses and consumers increasingly prioritize eco-friendly solutions. With growing concerns over global warming, the demand for sustainable furniture has surged. Several manufacturers have responded, producing eco-friendly wooden furniture that commands a premium. For instance, Enky, a furniture-as-a-service startup, successfully raised USD5.8 million in November 2024, following a million-dollar crowdfunding round. Enky's mission is to make furniture consumption more circular and eco-friendly, introducing USD5.3 million worth of sustainable wooden furniture into the market.
- The startup's crowdlending platform, Enky Invest, enables anyone to invest in these sustainable offerings, promising returns of 6%-8%. This shift towards eco-friendly wooden furniture signifies a significant business outcome, with companies adapting to meet evolving consumer preferences and reducing their carbon footprint.
Significant Market Challenges
The growth of the wooden furniture industry is significantly impacted by the cost challenges encountered by manufacturers and companies in this sector.
- The market continues to evolve, showcasing versatility across various sectors including residential, commercial, and industrial applications. The intricacies of manufacturing and supplying wooden furniture involve substantial costs. Approximately 60% of the end-product price is attributed to the sum of supplier, manufacturing, and storage expenses, along with inventory management fees. Transportation costs, a significant component, account for a considerable portion of these expenses. These costs encompass the supply of raw materials to manufacturing facilities, transitional goods to production sites, transportation of end-products to warehouses, and delivery to end-users.
- For instance, the transportation of raw wood can account for up to 30% of the final product cost. Despite these challenges, the market remains dynamic, with manufacturers and companies continually seeking innovative solutions to optimize their supply chains and reduce transportation-related costs by up to 12%.

In-Depth Market Segmentation: Wooden Furniture Market
The wooden furniture industry research report provides comprehensive data (region-wise segment analysis), with forecasts and estimates in "USD billion" for the period 2025-2029, as well as historical data from 2019-2023 for the following segments.
- Application
- Home
- Office
- Distribution Channel
- Offline
- Online
- Type
- Hardwood
- Softwood
- Product
- Chairs
- Tables
- Cabinets
- Sofas & Couches
- Beds
- Storage Units
- Outdoor Furniture
- Geography
- North America
- US
- Canada
- Europe
- France
- Germany
- Italy
- UK
- Middle East and Africa
- Egypt
- KSA
- Oman
- UAE
- APAC
- China
- India
- Japan
- South America
- Argentina
- Brazil
- Rest of World (ROW)
- North America
By Application Insights
The home segment is estimated to witness significant growth during the forecast period.
In the dynamic world of furniture manufacturing, the market holds a significant position. According to recent industry insights, in 2024, the home segment accounted for over 60% of the market share. This trend is projected to persist, given the growing preference for wooden furniture in residential spaces. Homeowners value the usability and aesthetics of wooden furniture, particularly portable pieces, as they adapt to the trend of frequent home relocations. Innovative designs that maximize comfort while minimizing space are increasingly popular. The home segment encompasses furniture for living rooms, bedrooms, kitchens, dining rooms, bathrooms, and other areas.
Woodworking techniques, such as CNC machining, joinery, and Hand Tools, are employed to create solid wood, plywood, MDF, and composite furniture. Quality control measures ensure consistency, while finishing techniques add durability and visual appeal. Upholstery fabrics, furniture hardware, and laminate flooring installation further enhance the functionality and design of these pieces. Sustainable forestry practices ensure the availability of high-quality wood species, contributing to the market's continued growth.
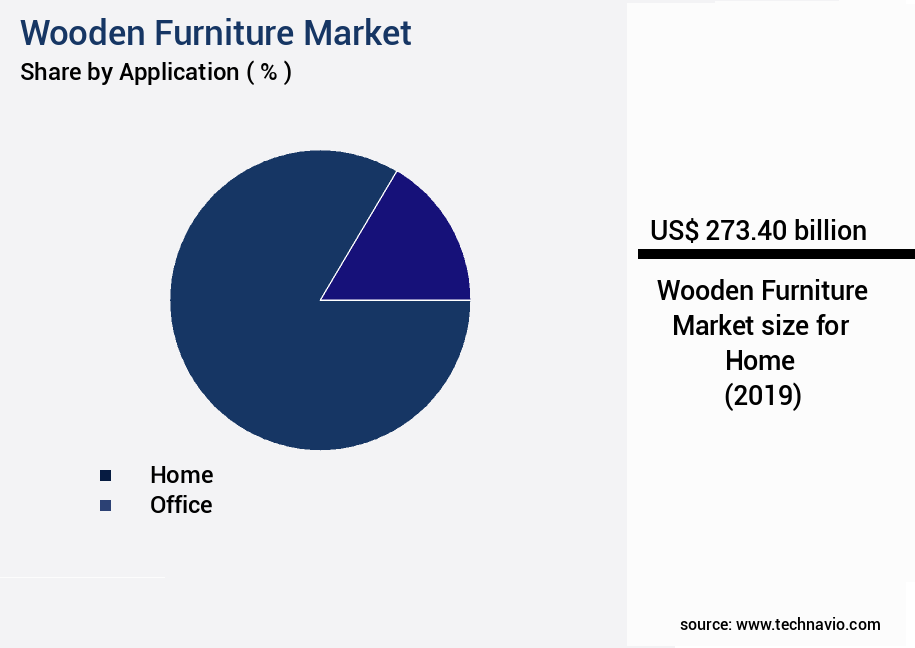
The Home segment was valued at USD 273.40 billion in 2019 and showed a gradual increase during the forecast period.

Regional Analysis
APAC is estimated to contribute 43% to the growth of the global market during the forecast period.Technavio’s analysts have elaborately explained the regional trends and drivers that shape the market during the forecast period.

See How Wooden Furniture Market Demand is Rising in APAC Request Free Sample
The market in APAC holds a significant share in the global landscape, with China and India being key contributors to its growth. Economic progression and a burgeoning population in these countries are driving market expansion during the forecast period. Increased disposable income levels and globalization are fueling the demand for premium wooden furniture in India, China, Malaysia, and South Korea. The region's office sector is experiencing growth, leading to an increased need for wooden furniture in corporate offices. In India, consumers are gravitating towards branded home furnishing products due to rising disposable incomes.
The market's growth is further propelled by operational efficiency gains and cost reductions through automation and technology integration in manufacturing processes. With a growing focus on sustainability and eco-friendly production methods, the wooden furniture industry is poised for continued growth in APAC.

Customer Landscape of Wooden Furniture Industry
Competitive Intelligence by Technavio Analysis: Leading Players in the Wooden Furniture Market
Companies are implementing various strategies, such as strategic alliances, wooden furniture market forecast, partnerships, mergers and acquisitions, geographical expansion, and product/service launches, to enhance their presence in the industry.
Ashley Global Retail LLC - This company specializes in high-quality wooden furniture, featuring the Clare View Nuvella Outdoor Sofa, Cariton and Havalance Coffee Tables, and Gerianna Outdoor Coffee Table. These pieces showcase superior craftsmanship and design, catering to contemporary Home Decor trends.
The industry research and growth report includes detailed analyses of the competitive landscape of the market and information about key companies, including:
- Ashley Global Retail LLC
- Danube Group
- Duresta Upholstery Ltd.
- Durian Pvt. Ltd.
- FABRYKI MEBLI FORTE SA
- Global Furniture Group
- Godrej and Boyce Manufacturing Co. Ltd.
- Haworth Inc.
- HNI Corp.
- Hooker Furniture Corp.
- Inter IKEA Holding BV
- Kinnarps AB
- LaZBoy Inc.
- Herman Miller Inc
- Natuzzi SpA
- Nilkamal Ltd.
- Okamura Corp.
- Pan Emirates Home Furnishings
- Samson Holding Ltd.
- Steelcase Inc.
Qualitative and quantitative analysis of companies has been conducted to help clients understand the wider business environment as well as the strengths and weaknesses of key industry players. Data is qualitatively analyzed to categorize companies as pure play, category-focused, industry-focused, and diversified; it is quantitatively analyzed to categorize companies as dominant, leading, strong, tentative, and weak.
Recent Development and News in Wooden Furniture Market
- In August 2024, IKEA, the global furniture retailer, announced the launch of its new line of sustainable wooden furniture, named "Boholm," made from recycled wood and bamboo. The collection was unveiled at the 2024 International Furniture Fair in Cologne, Germany (Source: IKEA Press Release).
- In November 2024, American Woodmark Corporation, a leading manufacturer of kitchen and bathroom cabinets, entered into a strategic partnership with SmartHome Technologies, a technology company specializing in home automation systems. This collaboration aimed to integrate SmartHome's technology into American Woodmark's cabinetry, creating a new segment of smart wooden furniture (Source: American Woodmark Corporation Press Release).
- In February 2025, Ethan Allen Interiors Inc., a major player in the market, completed the acquisition of a significant stake in Danish furniture manufacturer, BoConcept. The deal was valued at approximately USD150 million, expanding Ethan Allen's product offerings and geographic reach (Source: Ethan Allen Interiors Inc. SEC Filing).
- In May 2025, the European Union passed new regulations on the production and import of wooden furniture, requiring all manufacturers to comply with strict sustainability standards. The regulations, set to take effect in 2026, aim to reduce deforestation and promote responsible sourcing (Source: European Commission Press Release).
Dive into Technavio’s robust research methodology, blending expert interviews, extensive data synthesis, and validated models for unparalleled Wooden Furniture Market insights. See full methodology.
|
Market Scope |
|
|
Report Coverage |
Details |
|
Page number |
207 |
|
Base year |
2024 |
|
Historic period |
2019-2023 |
|
Forecast period |
2025-2029 |
|
Growth momentum & CAGR |
Accelerate at a CAGR of 5.9% |
|
Market growth 2025-2029 |
USD 126.8 billion |
|
Market structure |
Fragmented |
|
YoY growth 2024-2025(%) |
5.5 |
|
Key countries |
US, Canada, Germany, UK, Italy, France, China, India, Japan, Brazil, Egypt, UAE, Oman, Argentina, KSA, UAE, Brazil, and Rest of World (ROW) |
|
Competitive landscape |
Leading Companies, Market Positioning of Companies, Competitive Strategies, and Industry Risks |
Why Choose Technavio for Wooden Furniture Market Insights?
"Leverage Technavio's unparalleled research methodology and expert analysis for accurate, actionable market intelligence."
The market continues to thrive, with consumers seeking high-quality, durable pieces that add character and warmth to their homes. Different types of wood finishes, each with unique benefits, are a key consideration for furniture manufacturers. For instance, a matte lacquer finish may offer easy maintenance, while a natural oil finish enhances the wood's grain and texture. Best practices for furniture assembly ensure efficiency and accuracy, reducing returns and improving customer satisfaction. The choice of wood species significantly impacts furniture durability, with hardwoods like oak and maple providing superior strength and longevity. Comparing various wood glues' performance is crucial for optimizing manufacturing workflows, with some adhesives offering faster curing times or stronger bonds. In the era of sustainability, sustainable sourcing of wood for furniture production is increasingly important. CNC router programming for furniture components allows for precise, consistent cuts, minimizing waste and reducing costs. The effect of humidity on wood furniture stability necessitates effective strategies for maintaining optimal indoor conditions. Furniture upholstery maintenance and advanced woodworking joinery techniques contribute to product longevity and customer satisfaction. Furniture design considerations for accessibility are essential for catering to diverse markets and ensuring compliance with accessibility regulations. Efficient processes for furniture manufacturing, such as lean principles and automation, enable businesses to meet demand while minimizing waste and reducing lead times. Innovative materials for eco-friendly furniture, like bamboo and reclaimed wood, offer competitive advantages in the market. Techniques for furniture restoration and repair extend the life cycle of existing pieces, contributing to the circular economy. Designing furniture for optimal ergonomic comfort enhances user experience and differentiates products from competitors. Advanced methods for furniture refinishing and using woodworking hand tools effectively enable craftspeople to create unique, high-quality pieces. Different types of wood stains offer various aesthetic effects, allowing manufacturers to cater to diverse customer preferences. The impact of furniture design on interior spaces is significant, with ergonomic, functional, and aesthetically pleasing designs driving demand. Overall, the market's continued growth is fueled by these various factors, with businesses that prioritize quality, sustainability, and innovation leading the charge.
What are the Key Data Covered in this Wooden Furniture Market Research and Growth Report?
-
What is the expected growth of the Wooden Furniture Market between 2025 and 2029?
-
USD 126.8 billion, at a CAGR of 5.9%
-
-
What segmentation does the market report cover?
-
The report is segmented by Application (Home and Office), Distribution Channel (Offline and Online), Type (Hardwood and Softwood), Geography (APAC, Europe, North America, South America, and Middle East and Africa), and Product (Chairs, Tables, Cabinets, Sofas & Couches, Beds, Storage Units, and Outdoor Furniture)
-
-
Which regions are analyzed in the report?
-
APAC, Europe, North America, South America, and Middle East and Africa
-
-
What are the key growth drivers and market challenges?
-
Growth of real estate and construction industry, Cost challenges faced by manufacturers and companies of wooden furniture
-
-
Who are the major players in the Wooden Furniture Market?
-
Ashley Global Retail LLC, Danube Group, Duresta Upholstery Ltd., Durian Pvt. Ltd., FABRYKI MEBLI FORTE SA, Global Furniture Group, Godrej and Boyce Manufacturing Co. Ltd., Haworth Inc., HNI Corp., Hooker Furniture Corp., Inter IKEA Holding BV, Kinnarps AB, LaZBoy Inc., Herman Miller Inc, Natuzzi SpA, Nilkamal Ltd., Okamura Corp., Pan Emirates Home Furnishings, Samson Holding Ltd., and Steelcase Inc.
-
We can help! Our analysts can customize this wooden furniture market research report to meet your requirements.
 RIA -
RIA - 
