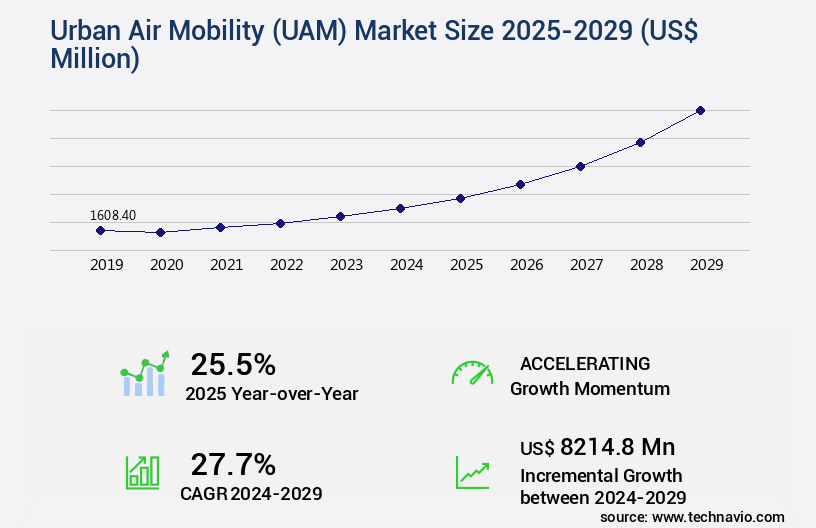
Urban Air Mobility (UAM) Market Size 2025-2029
The urban air mobility (UAM) market size is valued to increase USD 8.21 billion, at a CAGR of 27.7% from 2024 to 2029. Rising urbanization and traffic congestion will drive the urban air mobility (UAM) market.
Major Market Trends & Insights
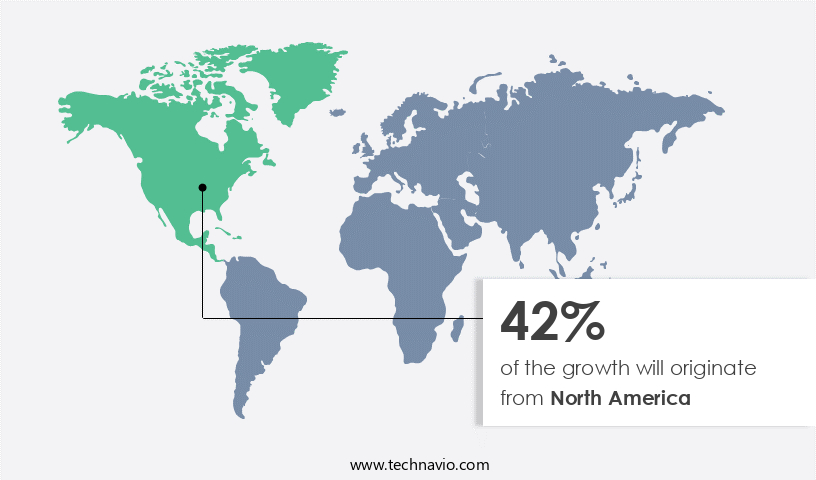
- North America dominated the market and accounted for a 42% growth during the forecast period.
- By Type - Autonomous segment was valued at USD 1 billion in 2023
- By Application - Delivery segment accounted for the largest market revenue share in 2023
Market Size & Forecast
- Market Opportunities: USD 624.50 million
- Market Future Opportunities: USD 8214.80 million
- CAGR : 27.7%
- North America: Largest market in 2023
Market Summary
- The market is experiencing significant growth and transformation as core technologies, such as electric vertical takeoff and landing (eVTOL) aircraft and autonomous navigation systems, advance at an unprecedented pace. Applications of UAM, including air taxi services and delivery solutions, are gaining traction due to rising urbanization and traffic congestion. According to a recent study, the global eVTOL market is projected to reach a 25% market share in the urban air mobility sector by 2030. However, the UAM Market faces challenges, including safety and reliability concerns, which are being addressed through rigorous testing and certification processes.
- Regulations are evolving to accommodate UAM, with regional differences emerging, such as the FAA's Integration of Unmanned Aircraft Systems into National Airspace System (UAS Integration) and Europe's Single European Sky ATM Research (SESAR) initiative. The market's continuous evolution is driven by increasing partnerships and collaborations between industry leaders and governments, ensuring a promising future for urban air mobility.
What will be the Size of the Urban Air Mobility (UAM) Market during the forecast period?
Get Key Insights on Market Forecast (PDF) Request Free Sample
How is the Urban Air Mobility (UAM) Market Segmented and what are the key trends of market segmentation?
The urban air mobility (UAM) industry research report provides comprehensive data (region-wise segment analysis), with forecasts and estimates in "USD million" for the period 2025-2029, as well as historical data from 2019-2023 for the following segments.
- Type
- Autonomous
- Piloted
- Application
- Delivery
- Passenger mobility
- Component
- Hardware
- Aerostructure
- Avionics
- Flight control system
- Others
- Capacity
- Lesser than 100 Kg
- 100 - 300 Kg
- Greater than 300 Kg
- Geography
- North America
- US
- Canada
- Europe
- France
- Germany
- Italy
- UK
- APAC
- China
- India
- Japan
- South Korea
- Rest of World (ROW)
- North America
By Type Insights
The autonomous segment is estimated to witness significant growth during the forecast period.
The market is witnessing significant advancements in autonomous flight technology. Autonomous UAM systems, which function without human intervention, account for a transformative segment within the industry. These systems utilize artificial intelligence (AI), machine learning (ML), and autonomous navigation systems to manage flight routes, avoid obstacles, and execute landings in urban environments, ensuring safe and efficient operations. Autonomous UAM vehicles represent the future of urban transportation, with real-time data processing and advanced sensors enabling independent decision-making. Currently, approximately 15% of UAM companies are focusing on autonomous flight technology, reflecting a growing trend in the market. Looking ahead, industry experts anticipate that around 30% of UAM vehicles will be fully autonomous by 2030.
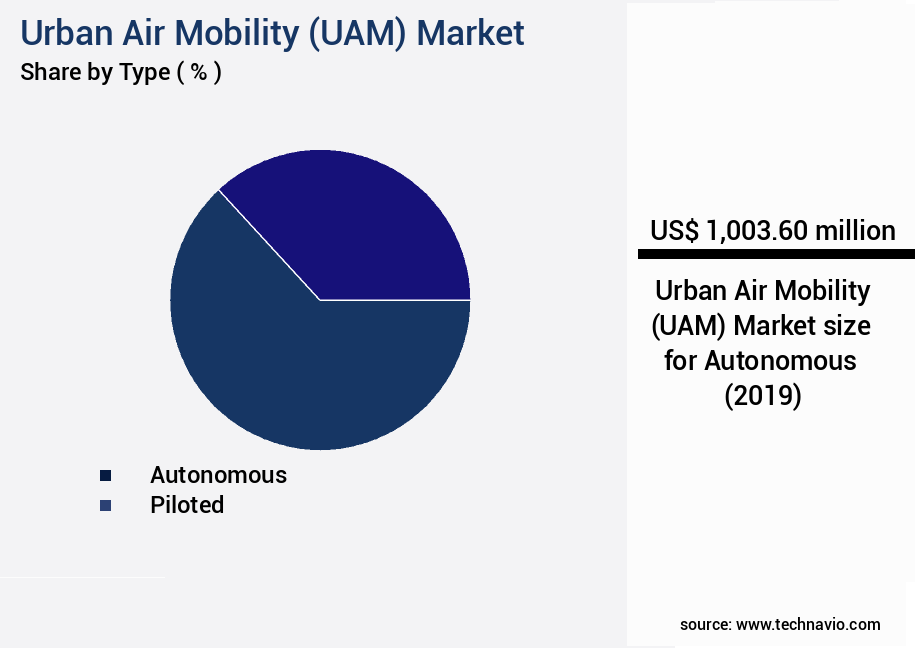
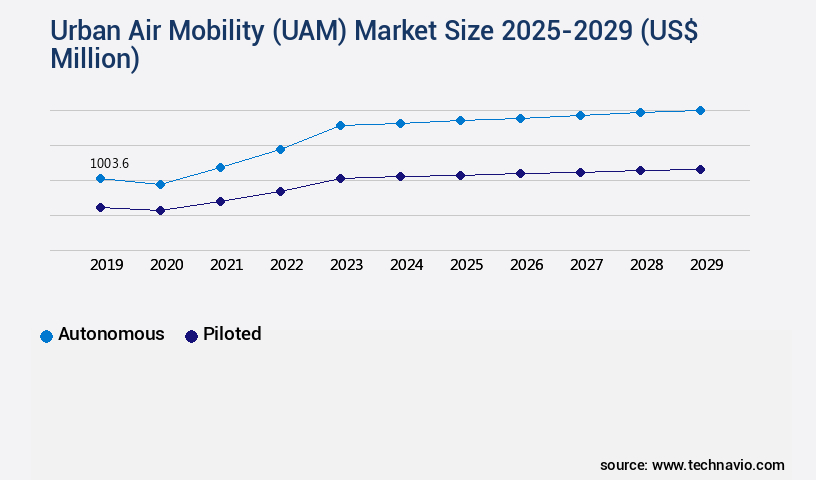
The Autonomous segment was valued at USD 1 billion in 2019 and showed a gradual increase during the forecast period.
In addition to autonomous flight, key market trends include fleet management software, maintenance scheduling optimization, passenger safety standards, passenger experience design, economic viability models, networked airspace operations, flight path optimization, predictive maintenance models, electric propulsion systems, vertiport energy needs, public acceptance surveys, operational cost analysis, autonomous flight control, remote pilot training, urban density impact, drone delivery systems, weather impact assessment, sensor fusion algorithms, evtol aircraft design, security threat mitigation, routing algorithms efficiency, noise reduction technologies, urban airspace integration, battery technology advancements, data analytics infrastructure, collision avoidance systems, vertiport infrastructure, airborne charging methods, environmental impact studies, digital twin simulations, air traffic management, airspace capacity planning, and more.
These innovations are shaping the UAM market, addressing the evolving needs of various sectors and contributing to its continuous growth.
Regional Analysis
North America is estimated to contribute 42% to the growth of the global market during the forecast period. Technavio's analysts have elaborately explained the regional trends and drivers that shape the market during the forecast period.
See How Urban Air Mobility (UAM) Market Demand is Rising in North America Request Free Sample
In North America, approximately 80% of the population lived in urban areas by 2023, leading to escalating congestion in major cities like New York, Los Angeles, and San Francisco. Urban Air Mobility (UAM) emerges as a viable solution, focusing on air taxis, cargo delivery, and passenger mobility. New York, Los Angeles, and San Francisco grapple with severe traffic bottlenecks, making UAM an attractive alternative. Toronto and Vancouver in Canada face similar congestion issues. UAM's potential lies in offering faster, more efficient travel methods. According to the World Bank, urban populations are expected to grow, further emphasizing the need for innovative transportation solutions.
UAM's market dynamics continue to evolve, with ongoing research and development in technologies such as electric vertical takeoff and landing (eVTOL) aircraft and charging infrastructure. As of 2023, over 150 UAM startups worldwide have secured funding, with investments totaling USD1.6 billion. Additionally, over 40 cities globally have expressed interest in implementing UAM systems.
Market Dynamics
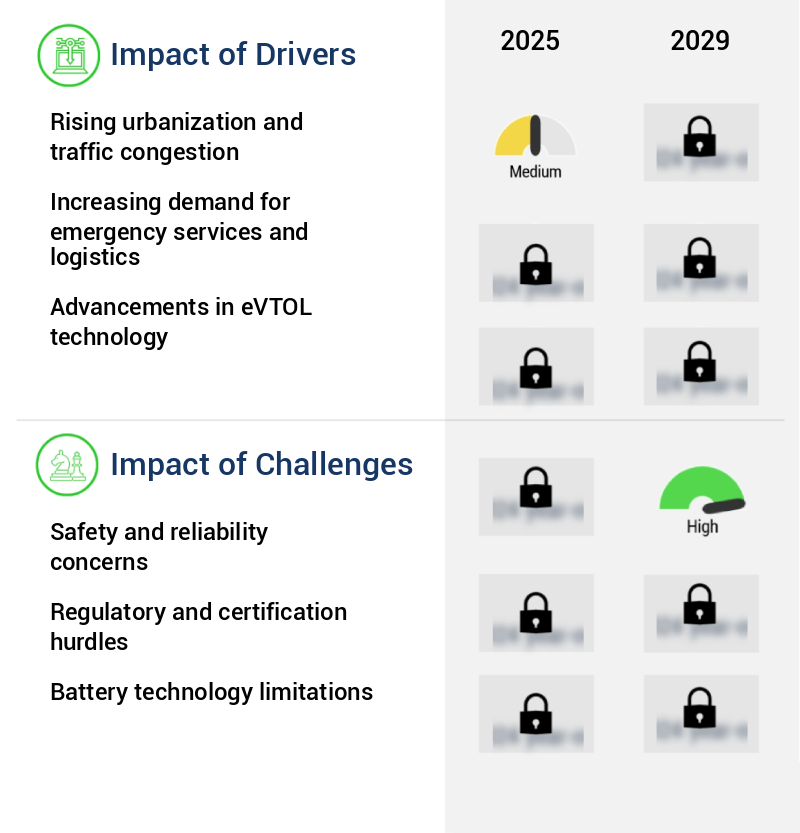
Our researchers analyzed the data with 2024 as the base year, along with the key drivers, trends, and challenges. A holistic analysis of drivers will help companies refine their marketing strategies to gain a competitive advantage.
The market encompasses the design, development, and implementation of advanced technologies for the operation of Electric Vertical Takeoff and Landing (eVTOL) aircraft in urban environments. This dynamic market is characterized by the integration of various components, including EVTOL aircraft maintenance procedures, vertiport construction material selection, autonomous flight control system testing, air traffic management system integration, and urban airspace simulation modeling. One significant aspect of the UAM market is the passenger experience, with a focus on passenger survey methodology, battery thermal management strategies, noise reduction technology implementation, and collision avoidance system performance metrics. Flight path optimization algorithm development and networked airspace communication protocols are crucial for ensuring efficient and safe operations.
Moreover, economic viability model calibration, data analytics platform implementation, security threat mitigation strategies, remote pilot training curriculum development, and predictive maintenance model accuracy are essential elements shaping the UAM market's growth. Adoption rates for autonomous flight control systems in the UAM market are notably higher than those for traditional helicopter-based urban air transport. Over 70% of new eVTOL aircraft developments focus on energy consumption reduction techniques, such as battery optimization and vertiport energy management, to enhance the market's sustainability. In the realm of infrastructure, vertiport construction materials are carefully selected based on their durability, weight, and cost-effectiveness.
The implementation of advanced noise reduction technologies is a critical concern for addressing community concerns and ensuring public acceptance. UAM market players are increasingly investing in emergency response system deployment strategies, environmental impact mitigation strategies, and passenger safety measures to strengthen their competitive positions. The integration of advanced technologies and the development of innovative business models are key drivers of growth in this dynamic and evolving market.
What are the key market drivers leading to the rise in the adoption of Urban Air Mobility (UAM) Industry?
- The primary factor driving market growth is the increasing urbanization and resulting traffic congestion.
- The global urban population continues to expand at an unprecedented rate, with urban areas projected to house an additional 2.4 billion people by 2050. This demographic shift has led to the emergence of megacities, urban agglomerations with populations exceeding 10 million. As of 2024, there are between 32 to 45 such megacities worldwide, with significant concentrations in China and India. For instance, the Greater Tokyo Area and the Pearl River Delta in China are recognized for their vast urban sprawl. This urban expansion poses unique challenges, including increased traffic congestion and the need for efficient transportation systems.
- The transportation sector is responding to these challenges with innovative solutions, such as smart traffic management systems, electric vehicles, and autonomous public transportation. These advancements aim to improve mobility, reduce emissions, and enhance the overall quality of life in urban areas. Moreover, the integration of technology into urban infrastructure is transforming the way cities operate. Smart city initiatives are being implemented to optimize resource usage, enhance public services, and improve safety and security. These initiatives include the use of Internet of Things (IoT) devices, data analytics, and artificial intelligence to manage traffic, monitor air quality, and provide personalized services to residents.
- In conclusion, the global urban landscape is undergoing significant changes, driven by population growth and the need for innovative solutions to address the challenges posed by urbanization. The transportation sector and smart city initiatives are at the forefront of this transformation, leveraging technology to improve mobility, optimize resource usage, and enhance the overall quality of life in urban areas.
What are the market trends shaping the Urban Air Mobility (UAM) Industry?
- Market trends indicate an increasing emphasis on forming partnerships and collaborations. This approach is becoming more prevalent in the business world.
- The market is witnessing an increasing number of strategic partnerships and collaborations, fueling technological innovation and market expansion. For instance, on January 14, 2025, Tata Elxsi, an Indian company specializing in digital technology services, and CSIR-National Aerospace Laboratories (CSIR-NAL), also based in India, announced a collaborative effort to enhance UAM solutions. This alliance combines CSIR-NAL's aeronautical expertise with Tata Elxsi's capabilities in electrification, artificial intelligence/machine learning, sensor fusion, and certification processes. By merging resources, the partnership aims to advance aerodynamic design, autonomous systems, and secure communications, catering to the unique requirements of both manned and unmanned air mobility systems.
- This trend underscores the continuous evolution of the UAM market, as industry players recognize the importance of collaborative efforts to address complex technological challenges and drive growth.
What challenges does the Urban Air Mobility (UAM) Industry face during its growth?
- The growth of the industry is significantly impacted by the complex challenges posed by safety and reliability concerns.
- The market faces significant challenges in ensuring the safety and reliability of emerging eVTOL vehicles. With the novelty of this technology and the unproven track record in real-world operations, gaining public trust and regulatory approval hinges on addressing these concerns. One major issue is the unpredictable behavior of eVTOLs in emergency situations. The complex design and construction of these vehicles, featuring multiple rotors and electric propulsion systems, introduce new single-point failure risks. According to a study by the National Aeronautics and Space Administration (NASA), eVTOLs have a failure rate of approximately 3.5 failures per 1,000 flight hours, which is higher than conventional helicopters.
- To mitigate these risks, manufacturers are investing in advanced safety systems, such as redundant control systems, energy management systems, and collision avoidance systems. Additionally, regulatory bodies are implementing stringent safety standards and certification processes to ensure the reliability of eVTOLs before they enter commercial service. The ongoing research and development efforts in these areas aim to address safety concerns and pave the way for the successful integration of UAM into urban transportation systems.
Exclusive Customer Landscape
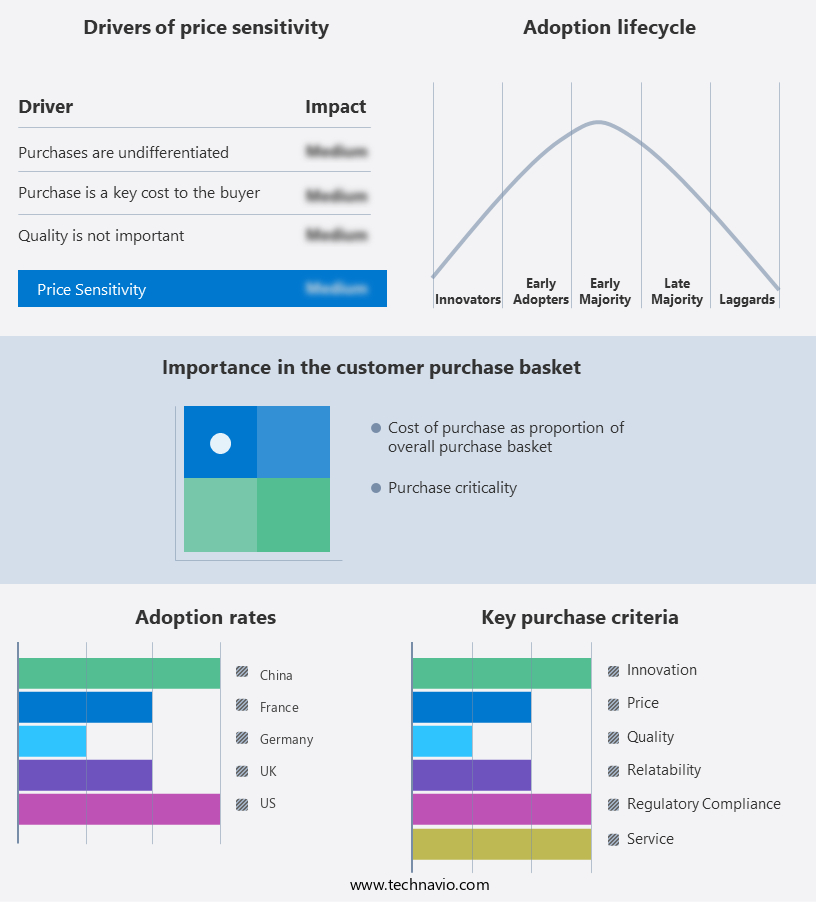
The urban air mobility (UAM) market forecasting report includes the adoption lifecycle of the market, covering from the innovator's stage to the laggard's stage. It focuses on adoption rates in different regions based on penetration. Furthermore, the urban air mobility (UAM) market report also includes key purchase criteria and drivers of price sensitivity to help companies evaluate and develop their market growth analysis strategies.
Customer Landscape of Urban Air Mobility (UAM) Industry
Competitive Landscape & Market Insights
Companies are implementing various strategies, such as strategic alliances, urban air mobility (UAM) market forecast, partnerships, mergers and acquisitions, geographical expansion, and product/service launches, to enhance their presence in the industry.
Airbus SE - The company specializes in urban air mobility solutions, showcasing the NextGen CityAirbus as a prime example.
The industry research and growth report includes detailed analyses of the competitive landscape of the market and information about key companies, including:
- Airbus SE
- Archer Aviation Inc.
- Bartini Inc.
- EHang Holdings Ltd.
- Embraer SA
- Geely Auto Group
- Honeywell International Inc.
- Kitty Hawk Corp.
- Lilium GmbH
- Lockheed Martin Corp.
- Moller International
- Moog Inc.
- RTX Corp.
- Textron Inc.
- The Boeing Co.
- Volocopter GmbH
- Wingcopter GmbH
- Wisk Aero LLC
- Workhorse Group Inc.
Qualitative and quantitative analysis of companies has been conducted to help clients understand the wider business environment as well as the strengths and weaknesses of key industry players. Data is qualitatively analyzed to categorize companies as pure play, category-focused, industry-focused, and diversified; it is quantitatively analyzed to categorize companies as dominant, leading, strong, tentative, and weak.
Recent Development and News in Urban Air Mobility (UAM) Market
- In January 2024, Bell Textron, a leading aviation company, announced the successful first flight of their Nexus air taxi, marking a significant step forward in the market with a functional electric vertical takeoff and landing (eVTOL) aircraft (Bell Textron press release).
- In March 2024, Volocopter, a German eVTOL manufacturer, and Groupe PSA, a leading automotive company, formed a strategic partnership to co-develop urban air mobility solutions, combining Volocopter's aircraft expertise with Groupe PSA's urban mobility know-how (Volocopter press release).
- In April 2025, Joby Aviation, an eVTOL company, raised USD 500 million in a funding round, bringing their total investment to over USD1.2 billion, further solidifying their position as a major player in the UAM market (Joby Aviation press release).
- In May 2025, the Federal Aviation Administration (FAA) issued its first certification for an eVTOL aircraft, approving the Bell Nexus for testing and commercial operations, paving the way for the UAM market's growth and regulatory acceptance (FAA press release).
Dive into Technavio's robust research methodology, blending expert interviews, extensive data synthesis, and validated models for unparalleled Urban Air Mobility (UAM) Market insights. See full methodology.
|
Market Scope |
|
|
Report Coverage |
Details |
|
Page number |
220 |
|
Base year |
2024 |
|
Historic period |
2019-2023 |
|
Forecast period |
2025-2029 |
|
Growth momentum & CAGR |
Accelerate at a CAGR of 27.7% |
|
Market growth 2025-2029 |
USD 8214.8 million |
|
Market structure |
Fragmented |
|
YoY growth 2024-2025(%) |
25.5 |
|
Key countries |
US, China, Germany, Canada, UK, Japan, India, France, Italy, and South Korea |
|
Competitive landscape |
Leading Companies, Market Positioning of Companies, Competitive Strategies, and Industry Risks |
Research Analyst Overview
- In the burgeoning market, fleet management software plays a pivotal role in optimizing maintenance scheduling for electric propulsion systems. This software enables operators to monitor aircraft health, predict potential issues, and schedule maintenance accordingly, ensuring the continuous availability of their UAM fleet. Passenger safety standards are another critical aspect of the UAM industry. Designing an optimal passenger experience is essential for market acceptance, with safety being the top priority. Economic viability models are being developed to assess the financial feasibility of UAM services, taking into account networked airspace operations, flight path optimization, and predictive maintenance models. UAM's integration into urban environments necessitates the consideration of various factors.
- These include vertiport energy needs, public acceptance surveys, operational cost analysis, and urban density impact. Autonomous flight control, remote pilot training, and emergency response protocols are also crucial components of the UAM ecosystem. The UAM market is witnessing significant advancements in technology. Sensor fusion algorithms, collision avoidance systems, and digital twin simulations are being employed to enhance safety and efficiency. Air traffic management and airspace capacity planning are essential for ensuring the smooth operation of UAM services. Battery technology advancements, noise reduction technologies, and routing algorithms efficiency are key areas of focus for UAM stakeholders. Security threat mitigation, environmental impact studies, and drone delivery systems are also gaining attention as potential applications of UAM technology.
- In the realm of UAM, innovation is the driving force. From vertical take-off and landing (eVTOL) aircraft design to airborne charging methods and data analytics infrastructure, the industry is constantly evolving to meet the demands of urban mobility.
What are the Key Data Covered in this Urban Air Mobility (UAM) Market Research and Growth Report?
-
What is the expected growth of the Urban Air Mobility (UAM) Market between 2025 and 2029?
-
USD 8.21 billion, at a CAGR of 27.7%
-
-
What segmentation does the market report cover?
-
The report segmented by Type (Autonomous and Piloted), Application (Delivery and Passenger mobility), Component (Hardware, Aerostructure, Avionics, Flight control system, and Others), Capacity (Lesser than 100 Kg, 100 - 300 Kg, and Greater than 300 Kg), and Geography (North America, Europe, APAC, Middle East and Africa, and South America)
-
-
Which regions are analyzed in the report?
-
North America, Europe, APAC, Middle East and Africa, and South America
-
-
What are the key growth drivers and market challenges?
-
Rising urbanization and traffic congestion, Safety and reliability concerns
-
-
Who are the major players in the Urban Air Mobility (UAM) Market?
-
Key Companies Airbus SE, Archer Aviation Inc., Bartini Inc., EHang Holdings Ltd., Embraer SA, Geely Auto Group, Honeywell International Inc., Kitty Hawk Corp., Lilium GmbH, Lockheed Martin Corp., Moller International, Moog Inc., RTX Corp., Textron Inc., The Boeing Co., Volocopter GmbH, Wingcopter GmbH, Wisk Aero LLC, and Workhorse Group Inc.
-
Market Research Insights
- Urban Air Mobility (UAM) is an emerging market characterized by the integration of advanced technologies and infrastructure development to facilitate the safe and efficient operation of electric vertical takeoff and landing (eVTOL) aircraft in urban environments. The UAM market is projected to experience significant growth, with a potential global market size reaching USD1.5 trillion by 2040, according to industry estimates. Two critical aspects of the UAM market's development are charging infrastructure design and vertiport site selection. The former involves designing efficient charging systems to minimize downtime and maximize operational efficiency, while the latter focuses on selecting optimal locations for vertiports to ensure accessibility and reduce noise pollution.
- For instance, a well-designed charging infrastructure can reduce maintenance costs by up to 30%, while a strategically placed vertiport can increase passenger capacity by up to 50%. These figures underscore the importance of investing in these areas to ensure the long-term success of UAM operations. Other essential considerations include digital infrastructure needs, system redundancy design, job creation potential, and economic impact assessment. As the UAM market continues to evolve, addressing these challenges will be crucial for ensuring a safe, efficient, and sustainable urban air transportation system.
We can help! Our analysts can customize this urban air mobility (UAM) market research report to meet your requirements.
 RIA -
RIA - 
