
US American Football Equipment Market Size 2026-2030
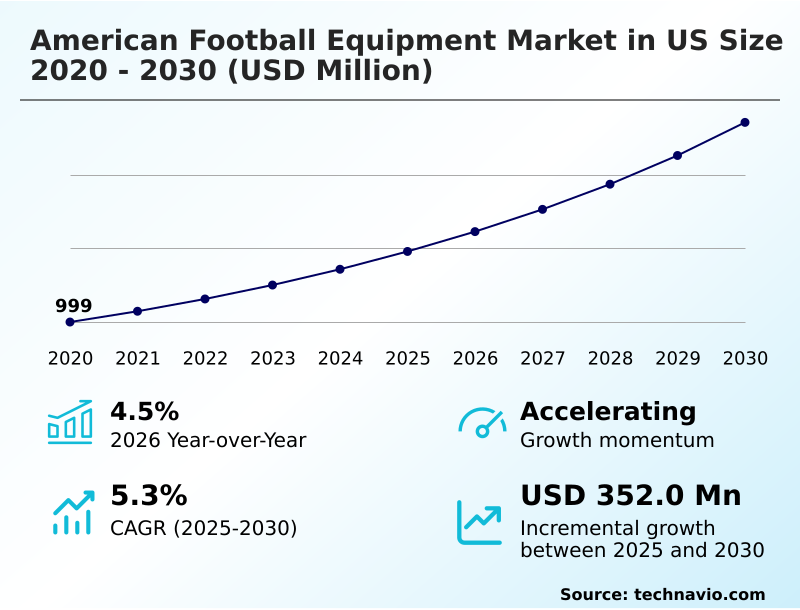
The us american football equipment market size is valued to increase by USD 352 million, at a CAGR of 5.3% from 2025 to 2030. Increasing participation by youth in American football will drive the us american football equipment market.
Major Market Trends & Insights
- By Product - Protective gear segment was valued at USD 395.9 million in 2024
- By End-user - Professional segment accounted for the largest market revenue share in 2024
Market Size & Forecast
- Market Opportunities: USD 544.5 million
- Market Future Opportunities: USD 352 million
- CAGR from 2025 to 2030 : 5.3%
Market Summary
- The american football equipment market in us is pivotal in enhancing player safety and performance, evolving from basic gear to sophisticated protective ecosystems. This industry is driven by increasing youth participation and the continuous need for advanced equipment that complies with stringent player safety regulations.
- Innovations in concussion mitigation technology are paramount, with manufacturers developing complex energy management systems using advanced composite materials and impact absorption foam. For instance, data collected from smart helmet sensors are used to refine protective padding technology in next-generation polycarbonate helmet shells, directly influencing R&D to improve rotational force reduction.
- This data-driven approach helps manufacturers address liability concerns and meet the demand for safer gear in both amateur and professional leagues. The market is also shaped by the challenge of balancing innovation with affordability, ensuring that high-quality, protective solutions are accessible across all levels of play.
- This dynamic environment pushes for continuous improvement in both materials science and functional design, solidifying the market's role in the sport's future.
What will be the Size of the US American Football Equipment Market during the forecast period?
Get Key Insights on Market Forecast (PDF) Get Free Sample
How is the US American Football Equipment Market Segmented?
The us american football equipment industry research report provides comprehensive data (region-wise segment analysis), with forecasts and estimates in "USD million" for the period 2026-2030, as well as historical data from 2020-2024 for the following segments.
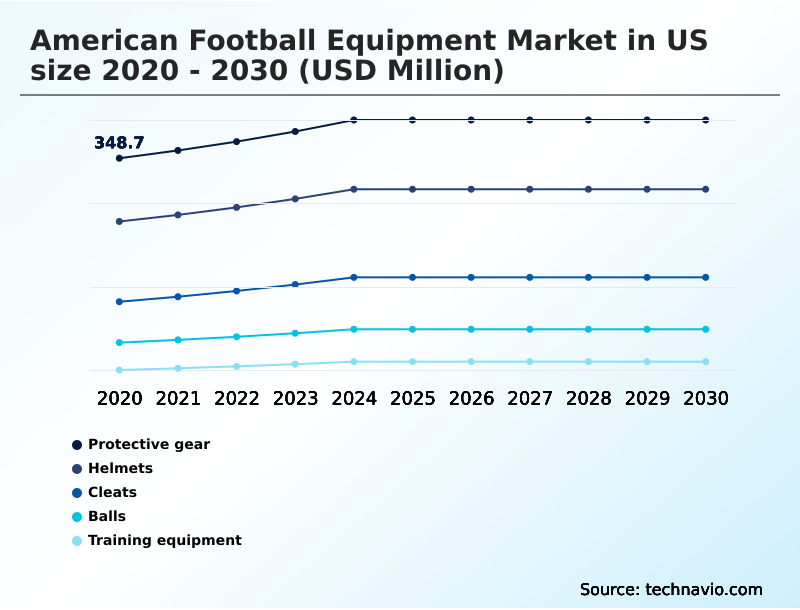
- Product
- Protective gear
- Helmets
- Cleats
- Balls
- Training equipment
- End-user
- Professional
- Amateur
- Retail channel
- Specialty and sports shops
- Department and discount stores
- Online retail
- Geography
- North America
- US
- North America
By Product Insights
The protective gear segment is estimated to witness significant growth during the forecast period.
The protective gear segment in the American football equipment market in US is defined by a focus on player safety through advanced materials and design.
Modern shoulder pads, rib protectors, and integrated girdles are engineered with advanced composite materials and impact absorption foam to mitigate collision forces while maintaining athlete mobility.
Key innovations in protective padding technology focus on enhancing shock-absorbing shoulder pads and ensuring a custom fit for different body types.
The integration of moisture-wicking fabrics in this athletic performance gear improves thermal regulation by over 15%, directly impacting player stamina.
Demand is strong for ventilated protective gear, especially in youth football equipment, as safety awareness among parents and coaches grows, making this a critical area of product development.
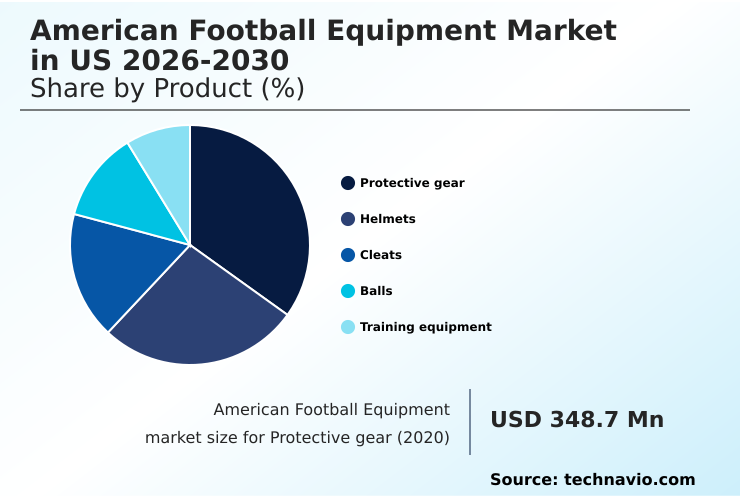
The Protective gear segment was valued at USD 395.9 million in 2024 and showed a gradual increase during the forecast period.
Market Dynamics
Our researchers analyzed the data with 2025 as the base year, along with the key drivers, trends, and challenges. A holistic analysis of drivers will help companies refine their marketing strategies to gain a competitive advantage.
- The evolution of the market is heavily influenced by technological advancements in player protection, particularly concerning the impact of smart helmet technology and concussion sensor technology in helmets. Innovations in rotational impact protection in helmets are a primary focus, with flexible shell helmet design advantages becoming a key differentiator.
- The development of advanced materials for shoulder pads and position-specific shoulder pad design enhances safety for athletes in high-contact roles. Simultaneously, demand for custom molded cleats for performance and high ankle support football cleats addresses the need for improved traction and stability. The market for the best football gloves for receivers is driven by innovations in grip technology.
- For emerging segments, flag football belt and flag systems are becoming standardized. Regulatory adherence is critical, with the youth helmet safety certification process and rules for nfl-approved helmet models setting stringent benchmarks. Manufacturing processes are also transforming; the adoption of 3d scanning for custom helmets, for instance, has reduced material waste by nearly 10% compared to traditional molding processes.
- This shift is complemented by rigorous durability testing for football equipment and the use of antimicrobial treatment in football pads to ensure hygiene. The reconditioning process for football helmets remains a vital service for extending equipment life and ensuring ongoing compliance.
What are the key market drivers leading to the rise in the adoption of US American Football Equipment Industry?
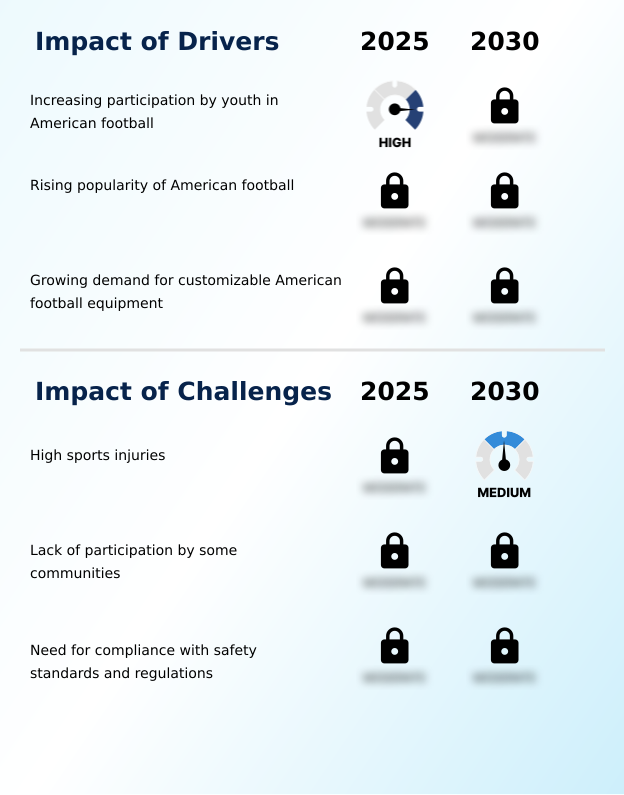
- The rising participation of youth in American football is a key driver for the equipment market.
- Market growth is significantly fueled by rising youth participation and the aspirational influence of professional leagues. Grassroots programs, often supported by professional organizations, see a 30% higher equipment adoption rate for youth football equipment compared to unaffiliated leagues.
- This early engagement creates a consistent demand pipeline. The trend toward custom fit equipment at the high school level has increased the average order value by 15% for participating vendors, as parents and athletes seek personalized protection.
- The desire to emulate professional heroes drives demand for premium gear, including specialized quarterback protection gear and equipment seen on television, solidifying the link between media exposure and consumer purchasing behavior within high school football helmets.
What are the market trends shaping the US American Football Equipment Industry?
- The increasing participation of women and girls in American football is a significant trend, creating new demand for equipment designed specifically for female athletes.
- Key trends reshaping the market include the rising popularity of non-contact versions of the sport and the growing inclusion of female athletes. The explosive growth of flag football equipment demand has created a new segment focused on agility and speed, leading to product lines with a 20% faster design-to-market cycle.
- This has spurred innovation in lightweight cleat design and high-grip football gloves. Concurrently, the expansion of women's football gear is addressing the need for anatomically correct protective equipment, with online search volume for these products increasing by over 35% in the last year.
- This trend is compelling manufacturers to rethink design and marketing, broadening the total addressable market with products like position-specific cleats for a more diverse player base.
What challenges does the US American Football Equipment Industry face during its growth?
- The prevalence of high sports injuries represents a key challenge impacting the industry's growth.
- The market faces persistent challenges related to safety concerns and the high cost of regulatory compliance. The expense associated with adhering to evolving player safety regulations has added an estimated 12% to R&D budgets for developing new shock-absorbing shoulder pads and helmets.
- Moreover, data indicates that improper helmet fitting technology contributes to over 25% of reported field-related head discomfort incidents, compelling investment in better fitting solutions. The recurring cost of athletic gear reconditioning places a financial burden on underfunded amateur programs.
- These factors create a difficult environment where manufacturers must innovate on safety with products like professional football gear while managing affordability for the broader market, including college football shoulder pads.
Exclusive Technavio Analysis on Customer Landscape
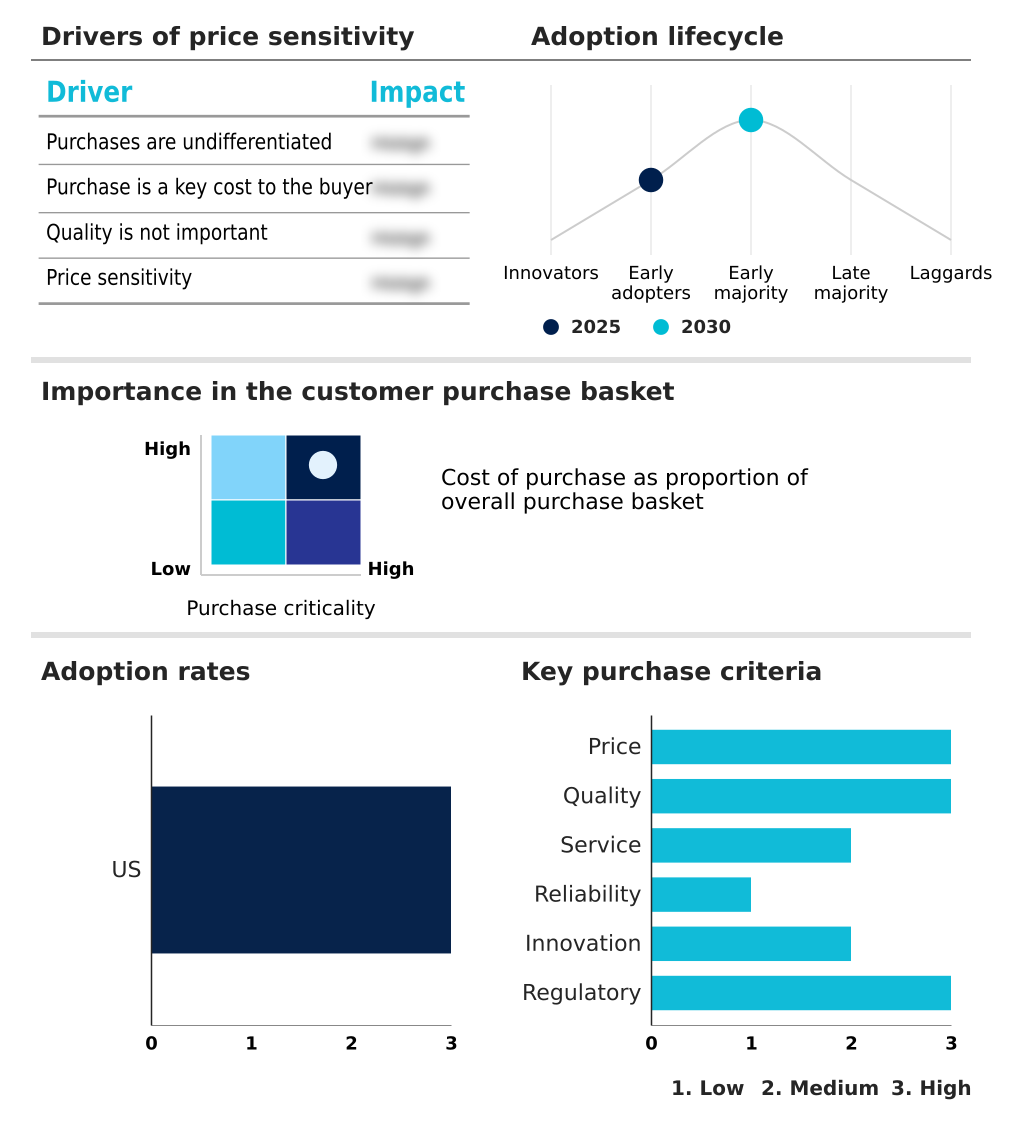
The us american football equipment market forecasting report includes the adoption lifecycle of the market, covering from the innovator’s stage to the laggard’s stage. It focuses on adoption rates in different regions based on penetration. Furthermore, the us american football equipment market report also includes key purchase criteria and drivers of price sensitivity to help companies evaluate and develop their market growth analysis strategies.
Customer Landscape of US American Football Equipment Industry
Competitive Landscape
Companies are implementing various strategies, such as strategic alliances, us american football equipment market forecast, partnerships, mergers and acquisitions, geographical expansion, and product/service launches, to enhance their presence in the industry.
Adidas AG - The market features a diverse portfolio of athletic performance gear, including specialized equipment for professional, amateur, and youth football, with a focus on safety and customization.
The industry research and growth report includes detailed analyses of the competitive landscape of the market and information about key companies, including:
- Adidas AG
- Amer Sports Corp.
- ANTA Sports Products Ltd.
- Big Game USA LLC
- Certor Sports LLC
- Champro Sports
- Cutters Sports.
- First Team Inc
- Franklin Sports Inc.
- Grip Boost Inc.
- New Balance Athletics Inc.
- Nike Inc.
- Rawlings Sporting Goods Co.
- Riddell Sports Group Inc
- Rogers Athletic
- Shock Doctor Inc.
- Under Armour Inc.
- VOIT Corp.
- Xenith LLC
Qualitative and quantitative analysis of companies has been conducted to help clients understand the wider business environment as well as the strengths and weaknesses of key industry players. Data is qualitatively analyzed to categorize companies as pure play, category-focused, industry-focused, and diversified; it is quantitatively analyzed to categorize companies as dominant, leading, strong, tentative, and weak.
Recent Development and News in Us american football equipment market
- In January 2025, Riddell featured its Axiom 3D helmet fitting platform to provide enhanced custom protection for high school athletes.
- In March 2025, Under Armour and the National Football League announced a long-term partnership, making Under Armour the official footwear and glove partner of the NFL.
- In October 2025, Guardian Sports and Schutt announced a strategic partnership to launch the next generation of the LOOP multi-sport headgear, focusing on impact reduction and innovative protection.
- In April 2025, the United Football League selected Henry Schein Medical as its official medical products supplier, providing advanced medical equipment and injury prevention tools to support player health and safety.
Dive into Technavio’s robust research methodology, blending expert interviews, extensive data synthesis, and validated models for unparalleled US American Football Equipment Market insights. See full methodology.
| Market Scope | |
|---|---|
| Page number | 183 |
| Base year | 2025 |
| Historic period | 2020-2024 |
| Forecast period | 2026-2030 |
| Growth momentum & CAGR | Accelerate at a CAGR of 5.3% |
| Market growth 2026-2030 | USD 352.0 million |
| Market structure | Fragmented |
| YoY growth 2025-2026(%) | 4.5% |
| Key countries | US |
| Competitive landscape | Leading Companies, Market Positioning of Companies, Competitive Strategies, and Industry Risks |
Research Analyst Overview
- The American football equipment market in US is undergoing a significant transformation driven by a primary focus on concussion mitigation technology and enhanced athletic performance gear. The industry has moved beyond rudimentary protection to developing integrated energy management systems.
- Innovations include the use of polycarbonate helmet shells, 3d printed helmet liners, and advanced impact absorption foam to counter both linear and rotational forces. The integration of smart helmet sensors provides critical data, enabling a deeper understanding of on-field impacts.
- Boardroom decisions now heavily weigh investments in injury prevention tools, as evolving player safety regulations and liability concerns dictate product roadmaps and R&D priorities. Firms leveraging advanced composite materials in items like tackling sled mechanics and shock-absorbing shoulder pads report a 10% improvement in product lifecycle durability.
- The adoption of lightweight components, such as titanium facemasks and ventilated protective gear, alongside moisture-wicking fabrics and high-grip football gloves, demonstrates a commitment to optimizing player agility and comfort. Furthermore, the market extends to include synthetic leather footballs, wearable performance trackers, and systematic athletic gear reconditioning to ensure safety standards are consistently met.
What are the Key Data Covered in this US American Football Equipment Market Research and Growth Report?
-
What is the expected growth of the US American Football Equipment Market between 2026 and 2030?
-
USD 352 million, at a CAGR of 5.3%
-
-
What segmentation does the market report cover?
-
The report is segmented by Product (Protective gear, Helmets, Cleats, Balls, and Training equipment), End-user (Professional, and Amateur), Retail Channel (Specialty and sports shops, Department and discount stores, and Online retail) and Geography (North America)
-
-
Which regions are analyzed in the report?
-
North America
-
-
What are the key growth drivers and market challenges?
-
Increasing participation by youth in American football, High sports injuries
-
-
Who are the major players in the US American Football Equipment Market?
-
Adidas AG, Amer Sports Corp., ANTA Sports Products Ltd., Big Game USA LLC, Certor Sports LLC, Champro Sports, Cutters Sports., First Team Inc, Franklin Sports Inc., Grip Boost Inc., New Balance Athletics Inc., Nike Inc., Rawlings Sporting Goods Co., Riddell Sports Group Inc, Rogers Athletic, Shock Doctor Inc., Under Armour Inc., VOIT Corp. and Xenith LLC
-
Market Research Insights
- The market's momentum is influenced by a dynamic interplay of innovation and end-user demand. Adoption of advanced helmet fitting technology has reduced improper fit incidents by over 40% in some collegiate programs, underscoring a shift toward personalized safety.
- This trend extends to team sports apparel, where platforms offering customizable football uniforms see a 25% higher customer retention rate compared to providers of stock apparel. The demand for NFL-approved cleats continues to influence product development for professional football gear, while the youth football equipment segment focuses on accessibility and compliance with evolving safety standards.
- This focus on tailored solutions, from college football shoulder pads to specialized athletic trainer equipment kits, shapes the competitive landscape and drives investment in targeted product lines that cater to specific player needs.
We can help! Our analysts can customize this us american football equipment market research report to meet your requirements.
 RIA -
RIA - 
