US Amusement and Theme Park Market by Type, Revenue and Gender - Forecast and Analysis 2024-2028

US Amusement and Theme Park Market by Type, Revenue and Gender - Forecast and Analysis 2024-2028

Published: Jun 2024 139 Pages SKU: IRTNTR77759

Market Overview at a Glance

$4.02 B
Market Opportunity
3.88%
CAGR
3.26
YoY growth 2023-2024(%)

US Amusement and Theme Park Market Size 2024-2028 

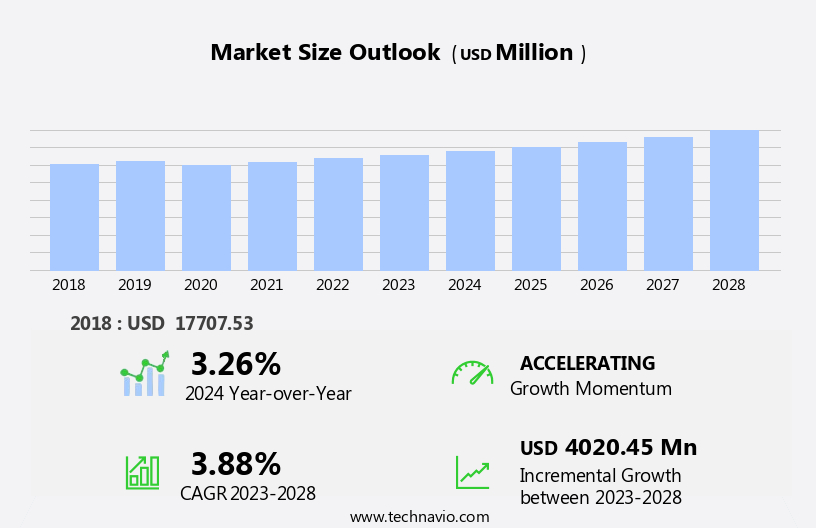
The US amusement and theme park market size is forecast to increase by USD 4.02 billion at a CAGR of 3.88% between 2023 and 2028. The amusement and theme park market in the US is witnessing significant growth, driven by increasing investments in high-thrill attractions and innovative creations. Indoor entertainment centers are gaining popularity due to their consistency in operation, mitigating seasonal variability and weather conditions. Eco-friendly practices, such as energy-efficient operations, waste reduction, and recycling systems, are becoming essential for amusement park to reduce their carbon footprint and protect the planet. Secondly, the increasing number of baby-boomer visitors contributes to higher attendance rates and spending in the leisure and entertainment and amusement sectors. Additionally, the adoption of blockchain technology and virtual assistants helps mitigate labor shortages by optimizing operational efficiencies and enhancing guest services. Renewable energy sources, environmental management systems, eco-conscious construction, and landscaping are some of the strategies parks are adopting to minimize their impact on the environment. Extreme weather events pose a risk to the industry, necessitating strong contingency plans. Cutting-edge technology is also playing a crucial role in enhancing the visitor experience and ensuring safety. The market is expected to continue its growth trajectory, driven by these trends and the industry's commitment to climate change mitigation and sustainability.

What will be the Size of the Market During the Forecast Period?

Amusement and Theme Park Market in US Size

 Request Free Sample

The amusement and theme park industry in the US is a significant contributor to the country's tourism sector. These recreational facilities offer a wide range of entertainment options, including rides, mechanical and water, for both adults and children. The market caters to diverse demographics, attracting millions of domestic and international visitors every year. Theme parks and water parks are popular choices for families, offering a mix of thrilling rides, food and beverage outlets, accommodation facilities, retail stores, and shows based on various themes and fictional characters. Indoor attractions ensure visitor interest, even amid extreme weather events, as the industry focuses on planet protection and environmental management systems. Social media engagements and experiential entertainment further drive growth.

Additionally, amusement arcades games, indoor entertainment centers, and urban leisure parks provide additional options for visitors seeking fun and relaxation. Seasonal variability and weather conditions play a crucial role in the amusement and theme park market. Park owners employ various strategies to mitigate the impact of these factors on their businesses. For instance, they may offer seasonal packages, discounts, and promotions to attract visitors during off-peak seasons. The market for amusement and theme parks in the US is driven by several factors. International tourism and global travel ecosystems continue to be significant contributors to the industry's growth. The increasing popularity of urban leisure and the need for entertainment options beyond traditional dining and shopping experiences further boost the market.

Further, food and beverage outlets, retail outlets, and restaurants within amusement and theme parks contribute significantly to the overall revenue. Park owners leverage IoT technology to optimize operations, enhance the visitor experience, and improve safety and security. The amusement and theme park market in the US is diverse and dynamic. It offers numerous opportunities for innovation and growth, with new attractions, technologies, and partnerships continually emerging. The market is expected to remain a key player in the US travel and tourism sector, providing unique experiences and memories for millions of visitors every year.

In conclusion, the amusement and theme park market in the US is a vibrant and ever-evolving industry that caters to various demographics and preferences. It offers a range of entertainment options, from thrilling rides and water attractions to immersive experiences based on popular themes and fictional characters. The market's continued growth is driven by factors such as international tourism, urban leisure, and the need for innovative and memorable experiences.

Market Segmentation

The market research report provides comprehensive data (region-wise segment analysis), with forecasts and estimates in "USD billion" for the period 2024-2028, as well as historical data from 2018-2022 for the following segments.

  • Type
    • Mechanical rides
    • Water rides
    • Other rides
  • Revenue
    • Tickets
    • Hospitality
    • Merchandising
    • Others
  • Gender
    • Male
    • Female
  • Geography
    • US

By Type Insights

The mechanical rides segment is estimated to witness significant growth during the forecast period.The amusement and theme park industry in the United States is marked by mega-projects that transform destinations into entertainment hubs. These sites go beyond traditional offerings, hosting expos, conferences, and sporting tournaments to engage communities and attract international tourists. Mechanical rides, a significant segment of these parks, continue to captivate visitors with their intricate engineering and advanced technology. Roller coasters, water rides, dark rides, and simulators are just a few examples of the thrilling experiences these attractions provide.

Additionally, the competition is fierce, and parks differentiate themselves through sophisticated attractions, themed resorts, hotels, and targeted promotions. Loyalty programs and community engagement initiatives further enhance the visitor experience. Accommodation facilities, retail outlets, and restaurants are integral components, catering to both adults and children. The amusement and theme park market in the US continues to evolve, offering unique experiences that blend entertainment and technology.

Amusement and Theme Park Market in US Size

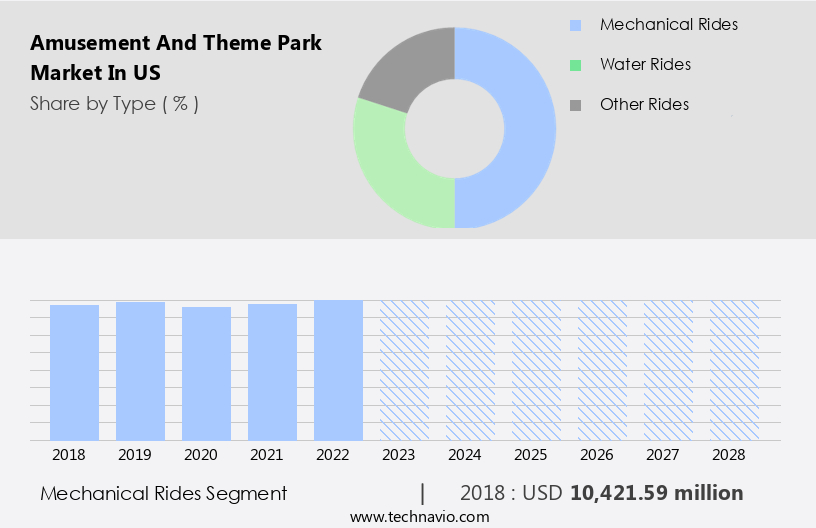
Get a glance at the market share of various segments Request Free Sample

The mechanical rides segment was valued at USD 10.42 billion in 2018 and showed a gradual increase during the forecast period.

Our market researchers analyzed the data with 2023 as the base year, along with the key drivers, trends, and challenges. A holistic analysis of drivers will help companies refine their marketing strategies to gain a competitive advantage.

US Amusement and Theme Park Market Driver

The rising investments in high-thrill roller coasters is the key driver of the market. Amusement parks in the US have seen significant advancements in recreational offerings, with roller coasters being a prime example. Traditional roller coasters, originally constructed from wood, were limited in design, featuring only straight tracks and gentle curves. However, the advent of technology and innovation has transformed roller coasters into thrilling and exciting experiences. Steel roller coasters now dominate the scene, allowing for intricate designs that include loops, drops, and over-banked turns. Two primary revenue drivers in the amusement park industry are supersized roller coasters and innovative smaller rides. Supersized coasters demand substantial capital investments but offer impressive heights, speeds, and thrills.

For instance, the Alabama Rampage, a 120-foot-tall wooden roller coaster, boasts a 102-foot drop and reaches a top speed of 56 mph. On the other hand, smaller, creative coasters do not necessitate significant capital investments and cater to a broader audience. These rides provide unique experiences, often incorporating innovative designs and themes. The amusement park market in the US continues to grow, with these two categories contributing significantly to its success. 

US Amusement and Theme Park Market Trends

The growing innovation and creativity in amusement parks is the upcoming trend in the market. Amusement parks and family entertainment centers in the US continue to captivate visitors with their innovative offerings, setting new standards in theme entertainment. Traditional amusement parks now feature high-tech rides, immersive experiences, and themed environments that cater to both families and tourists. The popularity of these venues is driven by their ability to provide variety and excitement, making them integral components of the travel ecosystem. Walt Disney, a leader in creativity and innovation, has revolutionized the industry with advancements such as pneumatic tower rides, interactive dark and 4D rides, hydraulic launch coasters, and giant rides.

Additionally, Disney's commitment to innovation is further demonstrated through initiatives like Disney Innovation Day, where startups showcase their product lines. Beyond Disney, other theme parks offer unique experiences through augmented reality video games, broadcast programming with robotic pixels, and 3D representation of shows. Urban leisure has evolved significantly, offering visitors a world of immersive experiences that cater to diverse interests and preferences. These innovations have attracted an increasing number of domestic and international tourists, making amusement parks and family entertainment centers essential components of the global tourism landscape.

US Amusement and Theme Park Market Challenge

Risks associated with amusement parks is a key challenge affecting the market growth. Amusement and theme parks in the United States encounter various hurdles that can impact their functionality and profitability. Safety is a significant concern, as there is a potential for accidents, injuries, or fatalities on rides due to mechanical issues, operator mistakes, or visitor misconduct. Compliance with regulations is essential, as parks must adhere to stringent federal, state, and local guidelines regarding ride safety, accessibility, and health requirements. Economic elements, such as decreases in consumer spending on discretionary items and increasing operational expenses, pose additional risks. Natural disasters and adverse weather conditions, including storms and hurricanes, can lead to ride closures, property damage, and reduced attendance. To mitigate these challenges, theme parks invest in advanced safety technologies, maintain strong emergency response plans, and collaborate with regulatory bodies to ensure ongoing compliance.

Additionally, they focus on diversifying their offerings, such as water parks, amusement arcades, hotels or resorts, entertainment venues, and themed areas, to attract a broader audience and provide a range of recreational experiences. Food and beverage offerings and shows are also essential components of the park experience, providing guests with memorable moments and additional revenue streams. Amenities, such as restrooms, locker rentals, and parking facilities, contribute to overall guest satisfaction and repeat business. By addressing these challenges and continuously improving their offerings, theme parks in the US can maintain their position as popular destinations for thrilling rides, themed areas, and immersive experiences.

Exclusive Customer Landscape

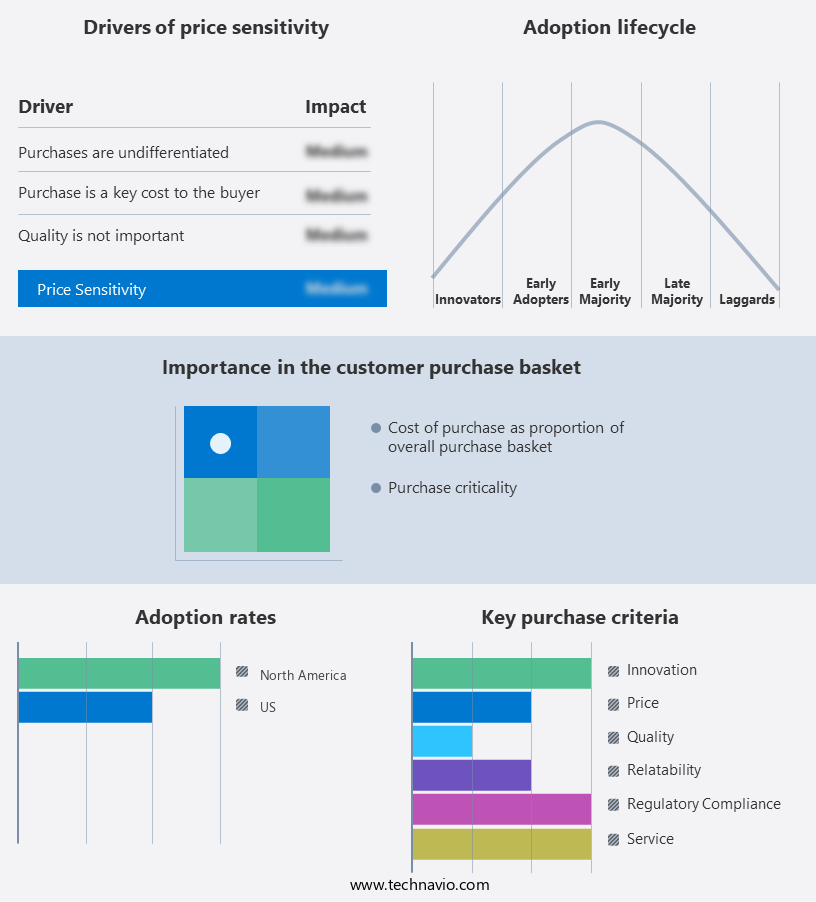
The market forecasting report includes the adoption lifecycle of the market, covering from the innovator's stage to the laggard's stage. It focuses on adoption rates in different regions based on penetration. Furthermore, the report also includes key purchase criteria and drivers of price sensitivity to help companies evaluate and develop their market growth analysis strategies.

Amusement and Theme Park Market in US Share by Geography

 Customer Landscape

Key Companies & Market Insights

Companies are implementing various strategies, such as strategic alliances, partnerships, mergers and acquisitions, geographical expansion, and product/service launches, to enhance their presence in the market.

American Dream - The company offers amusement and theme park such as Nickelodeon Universe Theme Park, DreamWorks Water Park and Nickelodeon Universe.

The market research and growth report includes detailed analyses of the competitive landscape of the market and information about key companies, including:

  • AMUSEMENTS OF AMERICA
  • Atlantic Beach Park
  • Belmont Park
  • CEDAR FAIR LP
  • Comcast Corp.
  • Diggerland USA
  • Dollywood
  • Experience Kissimmee
  • Fun Plex Waterpark and Rides
  • Funland
  • Glenwood Caverns Adventure Park
  • Hershey Entertainment and Resorts Co.
  • ICON PARK
  • Knoebels Amusement Resort
  • Motion JVco Ltd.
  • PARQUES REUNIDOS SERVICIOS CENTRALES SA
  • SeaWorld Parks and Entertainment Inc.
  • Six Flags Entertainment Corp.
  • The Walt Disney Co.

Qualitative and quantitative analysis of companies has been conducted to help clients understand the wider business environment as well as the strengths and weaknesses of key market players. Data is qualitatively analyzed to categorize companies as pure play, category-focused, industry-focused, and diversified; it is quantitatively analyzed to categorize companies as dominant, leading, strong, tentative, and weak.

Research Analyst Overview

Amusement and theme parks offer visitors thrilling rides, immersive experiences, and a variety of entertainment options. From mechanical rides and water rides to shows and themed areas, these recreational places cater to both male and female tourists, locals, and international visitors. The popularity of theme parks and water parks continues to grow, driven by the desire for adrenaline-pumping experiences and family-friendly nature. Theme entertainment provides visitors with cutting-edge technology, such as VR, and themed environments that transport them to different worlds. Seasonal variability and weather conditions do not deter visitors, as many parks offer indoor attractions and eco-friendly practices, including energy-efficient operations, waste reduction, recycling systems, renewable energy, and environmental management systems.

Additionally, traditional amusement parks and family entertainment centers provide nostalgia and classic rides, while mega-projects and themed resorts offer sophisticated attractions and accommodations. Aggressive marketing campaigns, loyalty programs, and targeted promotions draw in visitors, while community engagement and international tourist destinations attract a diverse demographic, including adults, children, and young adults. Food & beverage segment and retail outlets, including dining facilities, souvenir stores, and golf courses, contribute significantly to the revenue of these entertainment destinations.

In summary, park owners invest in IoT technology and themed elements, featuring fictional characters from movies like Disney and Marvel, to enhance the overall visitor experience. Urban leisure and indoor entertainment centers provide alternatives to outdoor recreational places during extreme weather events. Theme parks and entertainment venues remain integral parts of the travel ecosystem, attracting domestic and international tourists, and offering a range of accommodation facilities and entertainment options.

Market Scope

Report Coverage

Details

Page number

139

Base year

2023

Historic period

2018-2022

Forecast period

2024-2028

Growth momentum & CAGR

Accelerate at a CAGR of 3.88%

Market growth 2024-2028

USD 4.02 billion

Market structure

Fragmented

YoY growth 2023-2024(%)

3.26

Key companies profiled

American Dream, AMUSEMENTS OF AMERICA, Atlantic Beach Park, Belmont Park, CEDAR FAIR LP, Comcast Corp., Diggerland USA, Dollywood, Experience Kissimmee, Fun Plex Waterpark and Rides, Funland, Glenwood Caverns Adventure Park, Hershey Entertainment and Resorts Co., ICON PARK, Knoebels Amusement Resort, Motion JVco Ltd., PARQUES REUNIDOS SERVICIOS CENTRALES SA, SeaWorld Parks and Entertainment Inc., Six Flags Entertainment Corp., and The Walt Disney Co.

Market dynamics

Parent market analysis, market growth inducers and obstacles,market forecast , fast-growing and slow-growing segment analysis, COVID-19 impact and recovery analysis and future consumer dynamics, market condition analysis for the forecast period

Customization purview

If our market report has not included the data that you are looking for, you can reach out to our analysts and get segments customized.

Competitive landscape

Leading Companies, Market Positioning of Companies, Competitive Strategies, and Industry Risks

Request Free Sample

What are the Key Data Covered in this Market Research Report?

  • CAGR of the market during the forecast period
  • Detailed information on factors that will drive the market growth and forecasting between 2024 and 2028
  • Precise estimation of the size of the market  and its contribution of the market in focus to the parent market
  • Accurate predictions about upcoming market growth and trends and changes in consumer behaviour
  • Growth of the market across US
  • Thorough analysis of the market's competitive landscape and detailed information about companies
  • Comprehensive analysis of factors that will challenge the growth of market companies

We can help! Our analysts can customize this market research report to meet your requirements Get in touch

1 Executive Summary

  • 1.1 Market overview
    • Exhibit 01: Executive Summary – Chart on Market Overview
    • Exhibit 02: Executive Summary – Data Table on Market Overview
    • Exhibit 03: Executive Summary – Chart on Country Market Characteristics
    • Exhibit 04: Executive Summary – Chart on Market Segmentation by Type
    • Exhibit 05: Executive Summary – Chart on Market Segmentation by Revenue
    • Exhibit 06: Executive Summary – Chart on Market Segmentation by Gender
    • Exhibit 07: Executive Summary – Chart on Vendor Market Positioning

2 Market Landscape

  • 2.1 Market ecosystem
    • Exhibit 08: Parent market
    • Exhibit 09: Market Characteristics

3 Market Sizing

  • 3.1 Market definition
    • Exhibit 10: Offerings of vendors included in the market definition
  • 3.2 Market segment analysis
    • Exhibit 11: Market segments
  • 3.3 Market size 2023
    • 3.4 Market outlook: Forecast for 2023-2028
      • Exhibit 12: Chart on US - Market size and forecast 2023-2028 ($ million)
      • Exhibit 13: Data Table on US - Market size and forecast 2023-2028 ($ million)
      • Exhibit 14: Chart on US: Year-over-year growth 2023-2028 (%)
      • Exhibit 15: Data Table on US: Year-over-year growth 2023-2028 (%)

    4 Historic Market Size

    • 4.1 Amusement and theme park market in US 2018 - 2022
      • Exhibit 16: Historic Market Size – Data Table on amusement and theme park market in US 2018 - 2022 ($ million)
    • 4.2 Type Segment Analysis 2018 - 2022
      • Exhibit 17: Historic Market Size – Type Segment 2018 - 2022 ($ million)
    • 4.3 Revenue Segment Analysis 2018 - 2022
      • Exhibit 18: Historic Market Size – Revenue Segment 2018 - 2022 ($ million)
    • 4.4 Gender Segment Analysis 2018 - 2022
      • Exhibit 19: Historic Market Size – Gender Segment 2018 - 2022 ($ million)

    5 Five Forces Analysis

    • 5.1 Five forces summary
      • Exhibit 20: Five forces analysis - Comparison between 2023 and 2028
    • 5.2 Bargaining power of buyers
      • Exhibit 21: Chart on Bargaining power of buyers – Impact of key factors 2023 and 2028
    • 5.3 Bargaining power of suppliers
      • Exhibit 22: Bargaining power of suppliers – Impact of key factors in 2023 and 2028
    • 5.4 Threat of new entrants
      • Exhibit 23: Threat of new entrants – Impact of key factors in 2023 and 2028
    • 5.5 Threat of substitutes
      • Exhibit 24: Threat of substitutes – Impact of key factors in 2023 and 2028
    • 5.6 Threat of rivalry
      • Exhibit 25: Threat of rivalry – Impact of key factors in 2023 and 2028
    • 5.7 Market condition
      • Exhibit 26: Chart on Market condition - Five forces 2023 and 2028

    6 Market Segmentation by Type

    • 6.1 Market segments
      • Exhibit 27: Chart on Type - Market share 2023-2028 (%)
      • Exhibit 28: Data Table on Type - Market share 2023-2028 (%)
    • 6.2 Comparison by Type
      • Exhibit 29: Chart on Comparison by Type
      • Exhibit 30: Data Table on Comparison by Type
    • 6.3 Mechanical rides - Market size and forecast 2023-2028
      • Exhibit 31: Chart on Mechanical rides - Market size and forecast 2023-2028 ($ million)
      • Exhibit 32: Data Table on Mechanical rides - Market size and forecast 2023-2028 ($ million)
      • Exhibit 33: Chart on Mechanical rides - Year-over-year growth 2023-2028 (%)
      • Exhibit 34: Data Table on Mechanical rides - Year-over-year growth 2023-2028 (%)
    • 6.4 Water rides - Market size and forecast 2023-2028
      • Exhibit 35: Chart on Water rides - Market size and forecast 2023-2028 ($ million)
      • Exhibit 36: Data Table on Water rides - Market size and forecast 2023-2028 ($ million)
      • Exhibit 37: Chart on Water rides - Year-over-year growth 2023-2028 (%)
      • Exhibit 38: Data Table on Water rides - Year-over-year growth 2023-2028 (%)
    • 6.5 Other rides - Market size and forecast 2023-2028
      • Exhibit 39: Chart on Other rides - Market size and forecast 2023-2028 ($ million)
      • Exhibit 40: Data Table on Other rides - Market size and forecast 2023-2028 ($ million)
      • Exhibit 41: Chart on Other rides - Year-over-year growth 2023-2028 (%)
      • Exhibit 42: Data Table on Other rides - Year-over-year growth 2023-2028 (%)
    • 6.6 Market opportunity by Type
      • Exhibit 43: Market opportunity by Type ($ million)
      • Exhibit 44: Data Table on Market opportunity by Type ($ million)

    7 Market Segmentation by Revenue

    • 7.1 Market segments
      • Exhibit 45: Chart on Revenue - Market share 2023-2028 (%)
      • Exhibit 46: Data Table on Revenue - Market share 2023-2028 (%)
    • 7.2 Comparison by Revenue
      • Exhibit 47: Chart on Comparison by Revenue
      • Exhibit 48: Data Table on Comparison by Revenue
    • 7.3 Tickets - Market size and forecast 2023-2028
      • Exhibit 49: Chart on Tickets - Market size and forecast 2023-2028 ($ million)
      • Exhibit 50: Data Table on Tickets - Market size and forecast 2023-2028 ($ million)
      • Exhibit 51: Chart on Tickets - Year-over-year growth 2023-2028 (%)
      • Exhibit 52: Data Table on Tickets - Year-over-year growth 2023-2028 (%)
    • 7.4 Hospitality - Market size and forecast 2023-2028
      • Exhibit 53: Chart on Hospitality - Market size and forecast 2023-2028 ($ million)
      • Exhibit 54: Data Table on Hospitality - Market size and forecast 2023-2028 ($ million)
      • Exhibit 55: Chart on Hospitality - Year-over-year growth 2023-2028 (%)
      • Exhibit 56: Data Table on Hospitality - Year-over-year growth 2023-2028 (%)
    • 7.5 Merchandising - Market size and forecast 2023-2028
      • Exhibit 57: Chart on Merchandising - Market size and forecast 2023-2028 ($ million)
      • Exhibit 58: Data Table on Merchandising - Market size and forecast 2023-2028 ($ million)
      • Exhibit 59: Chart on Merchandising - Year-over-year growth 2023-2028 (%)
      • Exhibit 60: Data Table on Merchandising - Year-over-year growth 2023-2028 (%)
    • 7.6 Others - Market size and forecast 2023-2028
      • Exhibit 61: Chart on Others - Market size and forecast 2023-2028 ($ million)
      • Exhibit 62: Data Table on Others - Market size and forecast 2023-2028 ($ million)
      • Exhibit 63: Chart on Others - Year-over-year growth 2023-2028 (%)
      • Exhibit 64: Data Table on Others - Year-over-year growth 2023-2028 (%)
    • 7.7 Market opportunity by Revenue
      • Exhibit 65: Market opportunity by Revenue ($ million)
      • Exhibit 66: Data Table on Market opportunity by Revenue ($ million)

    8 Market Segmentation by Gender

    • 8.1 Market segments
      • Exhibit 67: Chart on Gender - Market share 2023-2028 (%)
      • Exhibit 68: Data Table on Gender - Market share 2023-2028 (%)
    • 8.2 Comparison by Gender
      • Exhibit 69: Chart on Comparison by Gender
      • Exhibit 70: Data Table on Comparison by Gender
    • 8.3 Male - Market size and forecast 2023-2028
      • Exhibit 71: Chart on Male - Market size and forecast 2023-2028 ($ million)
      • Exhibit 72: Data Table on Male - Market size and forecast 2023-2028 ($ million)
      • Exhibit 73: Chart on Male - Year-over-year growth 2023-2028 (%)
      • Exhibit 74: Data Table on Male - Year-over-year growth 2023-2028 (%)
    • 8.4 Female - Market size and forecast 2023-2028
      • Exhibit 75: Chart on Female - Market size and forecast 2023-2028 ($ million)
      • Exhibit 76: Data Table on Female - Market size and forecast 2023-2028 ($ million)
      • Exhibit 77: Chart on Female - Year-over-year growth 2023-2028 (%)
      • Exhibit 78: Data Table on Female - Year-over-year growth 2023-2028 (%)
    • 8.5 Market opportunity by Gender
      • Exhibit 79: Market opportunity by Gender ($ million)
      • Exhibit 80: Data Table on Market opportunity by Gender ($ million)

    9 Customer Landscape

    • 9.1 Customer landscape overview
      • Exhibit 81: Analysis of price sensitivity, lifecycle, customer purchase basket, adoption rates, and purchase criteria

    10 Drivers, Challenges, and Trends

    • 10.1 Market drivers
      • 10.2 Market challenges
        • 10.3 Impact of drivers and challenges
          • Exhibit 82: Impact of drivers and challenges in 2023 and 2028
        • 10.4 Market trends

          11 Vendor Landscape

          • 11.1 Overview
            • 11.2 Vendor landscape
              • Exhibit 83: Overview on Criticality of inputs and Factors of differentiation
            • 11.3 Landscape disruption
              • Exhibit 84: Overview on factors of disruption
            • 11.4 Industry risks
              • Exhibit 85: Impact of key risks on business

            12 Vendor Analysis

            • 12.1 Vendors covered
              • Exhibit 86: Vendors covered
            • 12.2 Market positioning of vendors
              • Exhibit 87: Matrix on vendor position and classification
            • 12.3 American Dream
              • Exhibit 88: American Dream - Overview
              • Exhibit 89: American Dream - Key offerings
            • 12.4 Atlantic Beach Park
              • Exhibit 90: Atlantic Beach Park - Overview
              • Exhibit 91: Atlantic Beach Park - Product / Service
              • Exhibit 92: Atlantic Beach Park - Key offerings
            • 12.5 CEDAR FAIR LP
              • Exhibit 93: CEDAR FAIR LP - Overview
              • Exhibit 94: CEDAR FAIR LP - Product / Service
              • Exhibit 95: CEDAR FAIR LP - Key offerings
            • 12.6 Comcast Corp.
              • Exhibit 96: Comcast Corp. - Overview
              • Exhibit 97: Comcast Corp. - Business segments
              • Exhibit 98: Comcast Corp. - Key news
              • Exhibit 99: Comcast Corp. - Key offerings
              • Exhibit 100: Comcast Corp. - Segment focus
            • 12.7 Diggerland USA
              • Exhibit 101: Diggerland USA - Overview
              • Exhibit 102: Diggerland USA - Product / Service
              • Exhibit 103: Diggerland USA - Key offerings
            • 12.8 Dollywood
              • Exhibit 104: Dollywood - Overview
              • Exhibit 105: Dollywood - Product / Service
              • Exhibit 106: Dollywood - Key offerings
            • 12.9 Fun Plex Waterpark and Rides
              • Exhibit 107: Fun Plex Waterpark and Rides - Overview
              • Exhibit 108: Fun Plex Waterpark and Rides - Product / Service
              • Exhibit 109: Fun Plex Waterpark and Rides - Key offerings
            • 12.10 Funland
              • Exhibit 110: Funland - Overview
              • Exhibit 111: Funland - Product / Service
              • Exhibit 112: Funland - Key offerings
            • 12.11 Hershey Entertainment and Resorts Co.
              • Exhibit 113: Hershey Entertainment and Resorts Co. - Overview
              • Exhibit 114: Hershey Entertainment and Resorts Co. - Product / Service
              • Exhibit 115: Hershey Entertainment and Resorts Co. - Key news
              • Exhibit 116: Hershey Entertainment and Resorts Co. - Key offerings
            • 12.12 Knoebels Amusement Resort
              • Exhibit 117: Knoebels Amusement Resort - Overview
              • Exhibit 118: Knoebels Amusement Resort - Product / Service
              • Exhibit 119: Knoebels Amusement Resort - Key offerings
            • 12.13 Motion JVco Ltd.
              • Exhibit 120: Motion JVco Ltd. - Overview
              • Exhibit 121: Motion JVco Ltd. - Business segments
              • Exhibit 122: Motion JVco Ltd. - Key news
              • Exhibit 123: Motion JVco Ltd. - Key offerings
              • Exhibit 124: Motion JVco Ltd. - Segment focus
            • 12.14 PARQUES REUNIDOS SERVICIOS CENTRALES SA
              • Exhibit 125: PARQUES REUNIDOS SERVICIOS CENTRALES SA - Overview
              • Exhibit 126: PARQUES REUNIDOS SERVICIOS CENTRALES SA - Product / Service
              • Exhibit 127: PARQUES REUNIDOS SERVICIOS CENTRALES SA - Key offerings
            • 12.15 SeaWorld Parks and Entertainment Inc.
              • Exhibit 128: SeaWorld Parks and Entertainment Inc. - Overview
              • Exhibit 129: SeaWorld Parks and Entertainment Inc. - Product / Service
              • Exhibit 130: SeaWorld Parks and Entertainment Inc. - Key news
              • Exhibit 131: SeaWorld Parks and Entertainment Inc. - Key offerings
            • 12.16 Six Flags Entertainment Corp.
              • Exhibit 132: Six Flags Entertainment Corp. - Overview
              • Exhibit 133: Six Flags Entertainment Corp. - Product / Service
              • Exhibit 134: Six Flags Entertainment Corp. - Key offerings
            • 12.17 The Walt Disney Co.
              • Exhibit 135: The Walt Disney Co. - Overview
              • Exhibit 136: The Walt Disney Co. - Business segments
              • Exhibit 137: The Walt Disney Co. - Key news
              • Exhibit 138: The Walt Disney Co. - Key offerings
              • Exhibit 139: The Walt Disney Co. - Segment focus

            13 Appendix

            • 13.1 Scope of the report
              • 13.2 Inclusions and exclusions checklist
                • Exhibit 140: Inclusions checklist
                • Exhibit 141: Exclusions checklist
              • 13.3 Currency conversion rates for US$
                • Exhibit 142: Currency conversion rates for US$
              • 13.4 Research methodology
                • Exhibit 143: Research methodology
                • Exhibit 144: Validation techniques employed for market sizing
                • Exhibit 145: Information sources
              • 13.5 List of abbreviations
                • Exhibit 146: List of abbreviations

              Research Methodology

              Technavio presents a detailed picture of the market by way of study, synthesis, and summation of data from multiple sources. The analysts have presented the various facets of the market with a particular focus on identifying the key industry influencers. The data thus presented is comprehensive, reliable, and the result of extensive research, both primary and secondary.

              INFORMATION SOURCES

              Primary sources

              • Manufacturers and suppliers
              • Channel partners
              • Industry experts
              • Strategic decision makers

              Secondary sources

              • Industry journals and periodicals
              • Government data
              • Financial reports of key industry players
              • Historical data
              • Press releases

              DATA ANALYSIS

              Data Synthesis

              • Collation of data
              • Estimation of key figures
              • Analysis of derived insights

              Data Validation

              • Triangulation with data models
              • Reference against proprietary databases
              • Corroboration with industry experts

              REPORT WRITING

              Qualitative

              • Market drivers
              • Market challenges
              • Market trends
              • Five forces analysis

              Quantitative

              • Market size and forecast
              • Market segmentation
              • Geographical insights
              • Competitive landscape

              Interested in this report?

              Get your sample now to see our research methodology and insights!

              Download Now

              Frequently Asked Questions

              Amusement and Theme Parkin US market growth will increase by $ 4020.45 mn during 2024-2028.

              The Amusement and Theme Parkin US market is expected to grow at a CAGR of 3.88% during 2024-2028.

              Amusement and Theme Parkin US market is segmented by Type( Mechanical rides, Water rides, Other rides) Revenue( Tickets, Hospitality, Merchandising, Others) Gender( Male, Female)

              American Dream, AMUSEMENTS OF AMERICA, Atlantic Beach Park, Belmont Park, CEDAR FAIR LP, Comcast Corp., Diggerland USA, Dollywood, Experience Kissimmee, Fun Plex Waterpark and Rides, Funland, Glenwood Caverns Adventure Park, Hershey Entertainment and Resorts Co., ICON PARK, Knoebels Amusement Resort, Motion JVco Ltd., PARQUES REUNIDOS SERVICIOS CENTRALES SA, SeaWorld Parks and Entertainment Inc., Six Flags Entertainment Corp., The Walt Disney Co. are a few of the key vendors in the Amusement and Theme Parkin US market.

              North America will register the highest growth rate of 100% among the other regions. Therefore, the Amusement and Theme Parkin US market in North America is expected to garner significant business opportunities for the vendors during the forecast period.

              US, North America

              • Rising investments in high-thrill roller coastersConventional roller coasters were produced using wood instead of steel is the driving factor this market.
              • as a result of which they lacked corkscrews is the driving factor this market.
              • loops is the driving factor this market.
              • and over-banked turns. However is the driving factor this market.
              • with advances in technology and innovations is the driving factor this market.
              • roller coasters have become more thrilling and adventurous and are made of steel is the driving factor this market.
              • providing possibilities for loops and drops. Furthermore is the driving factor this market.
              • the major revenue drivers in roller coasters are the supersized coasters and the small yet innovative amusement rides. While supersized coasters require huge capital investments is the driving factor this market.
              • small coasters do not require huge capital investments and are popular and creative. For example is the driving factor this market.
              • Alabama Rampage is the driving factor this market.
              • a 120-foot-tall wooden roller coaster is the driving factor this market.
              • has a 102-foot drop. Rampage hits a max speed of 56 mph. Alaska master blaster offers a 43-foot-high blastoff station in its water-powered roller coaster; the visitors should climb up 50 steps to the top before launching off. The water jets shoot up and down the 505-foot water-powered roller coaster. Kingda Ka by Six Flags Great Adventure (Six Flags Entertainment Corp.) in New Jersey is one of the tallest and fastest roller coasters globally is the driving factor this market.
              • featuring a hydraulic launch system that propels riders from 0 to 128 mph (206 km/h) in a matter of seconds. It also includes a 90-degree vertical drop. Top Thrill Dragster by Cedar Point (CEDAR FAIR LP.) in Ohio is a high-speed roller coaster that accelerates from 0 to 120 mph (193 km/h) in a few seconds. It includes a 420-foot (128-meter) tall vertical top hat element. Twisted Colossus by Six Flags Magic Mountain (Six Flags Entertainment Corp.) in California is a hybrid roller coaster with a steel track on a wooden structure. It features inversions is the driving factor this market.
              • steep drops is the driving factor this market.
              • and dueling trains for added excitement. With the increasing investment in high-thrill roller coasters is the driving factor this market.
              • innovative roller coasters will be introduced into the market to attract adventure lovers and other visitors to amusement parks. This will drive the growth of the amusement and theme park market in US during the forecast period. is the driving factor this market.

              The Amusement and Theme Parkin US market vendors should focus on grabbing business opportunities from the Mechanical rides segment as it accounted for the largest market share in the base year.
              RIA - Research AI Assistant
              Ask RIA